 Open Access Article
Creative Commons Attribution 3.0 Unported Licence
Investigation of chalcopyrite removal from low-grade molybdenite using response surface methodology and its effect on molybdenum trioxide morphology by roasting†
Reza Behmadiab,
Masoud Mirzaei *cd,
M. Reza Afshar*ab and
Hamidreza Najafiab
aDepartment of Materials Engineering, Science and Research Branch, Islamic Azad University, Shohada Hesarak Blvd., Daneshgah Square, Sattari Highway, Tehran, 1477893855, Iran. E-mail: mafshar@srbiau.ac.ir
bDepartment of Extraction & Recycling Materials, Research and Development of Engineering Materials Research Center, Science and Research Branch, Islamic Azad University, Shohada Hesarak Blvd., Daneshgah Square, Sattari Highway, Tehran, 1477893855, Iran
cDepartment of Chemistry, Faculty of Science, Ferdowsi University of Mashhad, Mashhad 9177948974, Iran. E-mail: mirzaeesh@um.ac.ir
dKhorasan Science and Technology Park (KSTP), 12th km of Mashhad-Quchan Road, Mashhad, 9185173911, Khorasan Razavi, Iran
First published on 15th May 2023
Abstract
In this research, purification of molybdenite concentrate (MoS2) using a nitric acid leaching process was employed for the improvement of molybdenum trioxide morphology during oxidative roasting in an air atmosphere. These experiments were performed using 19 trials designed with response surface methodology and three effective parameters being temperature, time, and acid molarity. It was found that the leaching process reduced the chalcopyrite content in the concentrate by more than 95%. The influence of chalcopyrite elimination and roasting temperature on the morphology and fiber growth of the MoO3 was also investigated by SEM images. Copper plays an important role in controlling the morphology of MoO3 and its decrease led to enhancing the length of quasi-rectangular microfibers from less than 30 μm for impure MoO3 up to several centimeters for purified MoO3.
1. Introduction
Molybdenite concentrate in the form of molybdenum disulfide is one of the most important mineral sources for producing molybdenum and its compounds.1 This mineral-based substance is a by-product in copper mines and is obtained via froth flotation processes.2 The crude material is converted into technical grade molybdenum trioxide by oxidative roasting in an air atmosphere in the presence of sodium chloride, lime or soda ash and is followed by purification by chemical leaching.3–5 Copper is typically found in nature as a sulfide, oxide, carbonate, or silicate mineral.6 The most significant copper sulfide mineral is chalcopyrite.7,8 Sulfide minerals like galena (PbS), pyrite (FeS2), and sphalerite (ZnS) are frequently found together with it.9 Chalcopyrite, a hard-to-leach mineral in acidic solutions, is typically the primary copper impurity in molybdenite concentrates.10,11 In leaching processes, secondary copper sulfides like covellite (CuS) and chalcocite (Cu2S) dissolve more quickly than chalcopyrite.12–14 A molybdenite concentrate's market value drastically decreases when chalcopyrite is present. To meet consumer requirements, molybdenite concentrate should contain less than 0.5 percent copper.5 When copper is present in the form of chalcopyrite, removing it from molybdenite by leaching necessitates the use of extremely aggressive solutions.13,15,16 Flotation processes frequently is used high doses of sodium sulfide and sodium cyanide to remove copper from molybdenite concentrates in industrial sectors.5,17Much effort has been applied to copper removal and molybdenum extraction from molybdenite concentrate.18–21 Copper in the form of chalcopyrite (CuFeS2) is one of the most important impurities in molybdenite concentrates.22 Using nitric acid as a solvent and an oxidant, or using sodium dichromate, sodium chlorate, and hypochlorite as oxidants, leaching of molybdenite has been investigated by some researchers.4 Padilla et al.13,23 used both sulfidation and leaching methods to decrease the chalcopyrite content and observed a selective elimination for copper and minimum molybdenum dissolution in a mixed solution of H2SO4–NaCl–O2 with acceptable efficiency of around 96%.13,23 Agaçayak et al.9 obtained optimum leaching conditions at a temperature of 80 °C with a solid-to-liquid ratio of 1/500 g/mL, 4 M HNO3, and rotation speed of 400 rpm for 3 h. The extraction of copper from chalcopyrite concentrate in nitric acid solution was approximately 80% under these conditions.9 Smirnov et al.24 addressed copper removal from molybdenite concentrate under high pressure conditions using sulfuric acid and nitric acid as the main medium and catalytic additive, respectively. They found that using nitric acid considerably increases the rate of molybdenite oxidation and subsequently reduces some operating conditions like temperature and pressure.24 Goodarzi et al.4 applied the analysis of variance (ANOVA) with the Taguchi method on the extraction of molybdenum from its concentrate and studied various effective parameters including reaction time, reaction temperature, hydrogen peroxide concentration, sulfuric acid concentration, pulp density and rotation speed. Based on their findings, the most important factors were H2O2 concentration, pulp density, and reaction temperature with reaction time being of marginal significance and rotation speed and H2SO4 concentration not statistically significant factors.4 On the other hand, Benzeşik et al.25 investigated the effects of H2SO4 concentration and the solid-to-liquid ratio on removal of copper from molybdenite concentrate and showed that 0.6 M H2SO4 can remove Cu at contents of 2.56 wt% up to 95.92% efficiency.25 Petrovic et al.26 studied leaching the chalcopyrite concentrate via HCl acid and H2O2 as an acid medium and strong oxidizer solution, respectively. Their experiments showed that 33% of the copper was dissolved in the first 60 min of a three-hour reaction.26 Almeida et al.27 studied the dissolution of chalcopyrite in acid solutions like nitric (HNO3), sulfuric (H2SO4), and hydrochloric (HCl) acid using electrochemical impedance spectroscopy (EIS) and found that dissolution of chalcopyrite is controlled by diffusion.27 Medvedev et al.28 carried out a series of kinetic studies on leaching molybdenite concentrate by investigating the effect of temperature and nitric acid concentration. Their suggested model has extracted molybdenum from the molybdenite concentrate up to 95%. Shalchian et al.29 addressed the effect of mechanical activation parameters on the leaching rate of molybdenite concentrate in nitric acid solution by ANOVA to determine the statistics of the main variations such as activation time, ball-to-powder ratio and rotation speed. They found that mechanical activation enhances the molybdenite leaching rate, considerably.29
Technical grade molybdenum trioxide (MoO3) is one of the initial substances used in a variety of industrial applications such as the production of molybdenum metal, ferromolybdenum alloy,3 batteries, sensors and electronic display devices, field emission, gas-chromic, photo-chromism devices, as well as the development of catalysts for petroleum and petrochemical industries because of its catalytic properties.30,31 Roasting is frequently used in the production of molybdenum trioxide from molybdenite concentrate.32,33 Some methods that are used for the preparation of molybdenum trioxide with different morphologies include hydrothermal/solvothermal methods, thermal evaporation, a sonochemical process, mechanical grinding and sonication, electro-spinning, and nanosecond-duration plasma discharges techniques.30,34,35 The temperature of the roasting process is usually between 400 to 700 °C in an air atmosphere. Some studies have shown that the oxidation rate is slow up to 444 °C and then increases up to 580 °C while becoming almost constant at 640 °C.32 Kim et al.3 found that during the oxidative roasting of low-grade molybdenite concentrate, more than 95% of the particles changed into molybdenum trioxide at 550 °C after 40 min.3 Basically, the thermodynamically stable orthorhombic MoO3 (α-type), metastable monoclinic MoO3 (β-type), and hexagonal MoO3 (h-type) are common polymorphic phases of molybdenum trioxide.36,37 Morphologically, depending on the starting materials and preparation methods, the shapes of molybdenum trioxide particles include belts, rods, tubes, fibers, wires, spheres, flakes, among others with different sizes from nano-to micrometers.30,31 Sui et al.30 synthesized α-MoO3 with a hierarchical flower-like structure using a facile solvothermal method and followed by calcination at 400 °C. The diameter of the microrods obtained was around 3–5 μm with average diameters of 150–200 nm.30 Szkoda et al.38 investigated the influence of water treatment on the morphology and crystalline structure of MoO3. Their method was based on the electrochemical anodization of a Mo plate inside the fluorine solution. Annealing at 500–700 °C created the regular MoO3 structure with a length of about 1 μm.38 Ornelas et al.39 synthesized molybdenum trioxide by a microwave assisted hydrothermal method and changed the morphology of MoO3 hexagonal rods from 3D to 2D using external heat treatment in an air atmosphere at a temperature above 650 °C.39
From the point of view of impurity effects on molybdenum trioxide morphology, it has been discovered by some researchers that reducing the iron amount with leaching provides thinner fibers during the process of oxidation. Overall, these studies express that the removal of iron from molybdenite can have a significant impact on the morphology of molybdenum trioxide fibers, resulting in smaller and more uniform fibers.40–42
In the present work, to investigate the influence of chalcopyrite on the molybdenum trioxide morphology after roasting the molybdenite concentrate at different temperatures, a series of nitric acid leaching experiments were designed with temperature (°C), time (h), and acid molarity (M) as the primary variables.
2. Experimental
2.1. Materials
A sample of raw molybdenite concentrate (RMC), a low-grade ore containing 52.38% Mo, 35.01% S, 2.45% Cu, 4.13% Fe and 6.03% other elements, was supplied from the Sarcheshmeh Copper Complex mine in the Kerman province of Iran. Ethyl acetate and nitric acid 65% (HNO3) were purchased from Sigma-Aldrich. The chemical composition of the RMC was analyzed by the ICP-MS method.2.2. Washing and leaching process
Removal of the residual flotation oil in the RMC was carried out using several washing steps with ethyl acetate and distilled water. Subsequently, the washed molybdenite concentrate (WMC) was filtered under vacuum on Whatman 42 filter paper and dried at 105 °C for 6 h. In the next step, 32 g of WMC was added to 800 mL of either 0.3, 0.6 and 0.6 M nitric acid solution in a 1000 mL Erlenmeyer flask and mixed completely with a magnetic stirrer for times of 1, 2, or 3 h) at 70, 80, and 90 °C (first value of each variable used in run 1. Subsequently, filtration of the purified molybdenite (PMC) was performed under vacuum followed by drying at 105 °C for 6 h.2.3. Roasting process
Technical molybdenum trioxide (α-MoO3) fibers were obtained via a roasting method. In order to find the optimum conditions for the roasting process, chemically activated pure MoS2 (PMS) was heated in three series of experiments at 600 °C, 625 °C, and 650 °C for 1 h each.2.4. Characterization
A scanning electron microscope (SEM) proX model with a voltage of 15 kV was used for the analysis of the sample morphology. A Thermo Scientific ELEMENT 2XR high-resolution inductively coupled plasma-mass spectrometer (ICP-MS) and the inductively coupled plasma-optical emission spectrometry (ICP-OES) equipped by a spectrometer with axially viewed plasma were used to determine the metal contents in molybdenite and acidic leaching solutions, respectively. The composition of the crystalline structure and phase content of all samples were analyzed by an XRD diffractometer (Philips X-pert Pro X-ray diffractometer). The target and wavelength were Cu Kα and 1.54060 Å, respectively. The XRD measurements were performed with a source power of 40 kV and with a 300 mA current, the scanning range was between 5° and 60° with a step size of 0.05°.3. Results and discussions
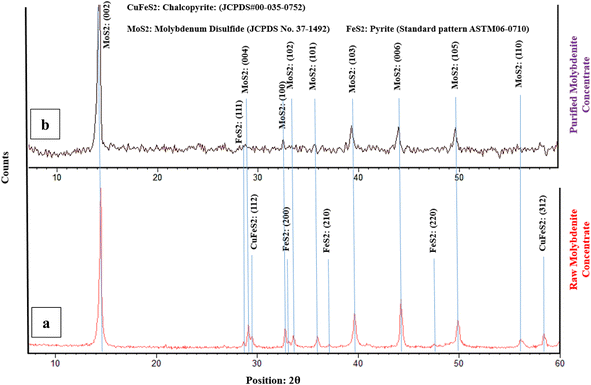
According to the chemical composition of RMC, copper and iron are the main impurities in the raw molybdenite concentrate. Fig. 1 shows the XRD graph to identify the minerals present in the initial ore and purified concentrate with nitric acid. Mineralogical study of the sample showed molybdenite (MoS2) as the main mineral phase and chalcopyrite (CuFeS2) and pyrite (FeS2) as the minor mineral impurities present. Also, many low intensity peaks were found which correspond to sulfide compounds such as FeS2 and CuFeS2.26,43 However, it was very difficult in the study to identify such sulfide compounds at the sample. This might be the reason that the amounts of all such sulfide compounds contained in the samples are relatively small.3The crystalline MoS2 structure was indexed at 14.4°, 28.4°, 35.9°, 39.6° and 43.3° corresponding to the (002), (004), (102), (103) and (006) crystal planes, which matched with the corresponding standard card (JCPDS card No. 75-1539) of the hexagonal MoS2 structure. The strongest diffraction peak is indexed to the (002) plane of MoS2, which means that a large number of grains are in parallel orientation, which is in good agreement with the literature.25,28,44 The peak at 2θ = 14.4° is an indication of the sulphur content of the concentrate.32,45
The XRD pattern for chalcopyrite in Fig. 1a, as the standard card of JCPDS# 00-035-0752, has peak positions of 29.6° and 58.5°, which correspond to the (112) and (312) crystallographic planes, respectively. The successful purification of the molybdenite concentrate through the HNO3 leaching process is verified by the absence of a chalcopyrite peak in Fig. 1b.
Additionally, the X-ray diffraction (XRD) pattern for pyrite present in molybdenite may vary depending on the specific sample and the experimental conditions used in the study. The standard card of ASTM06-0710 indicates that characteristic peaks for pyrite are typically observed at around 28.7°, 33.1°, 37.2°, and 47.6°, which correspond to the (111) (Fig. 1b), (200), (210), and (220) (Fig. 1a) crystallographic planes, respectively. The XRD results demonstrate a considerable decrease in the pyrite content following the leaching process.
The purpose of the present study was to identify the influence of roasting temperature and copper elimination on the molybdenum trioxide morphology. To investigate the influence of the copper presence or absence on technical molybdenum trioxide morphology during thermal treatment and according to the initial chemical composition of the molybdenite concentrate, removal of CuFeS2 was typically selected as the main purpose of the leaching process, because it is recognized as one of the most important impurities in the ore. Hence, to obtain the most efficient conditions for copper removal, optimization of the leaching process was determined by Central Composite Design (CCD).46–49 In the leaching process, three important factors affect copper removal and consequently the catalytic properties of molybdenite; the molarity of nitric acid, the temperature, and the leaching time.
By applying the multivariate Response Surface Methodology (RSM), the optimization of the process and the design of experiments were conducted faster, more economically, and more accurately.50 The molarity of nitric acid, temperature, and leaching time was regarded as independent variables; the residual copper was taken as the response variable. In all experiments the rotation speed and pulp density (powder molybdenite/nitric acid solution volume ratio) were 400 rpm and 1![[thin space (1/6-em)]](https://www.rsc.org/images/entities/char_2009.gif) :
:![[thin space (1/6-em)]](https://www.rsc.org/images/entities/char_2009.gif) 6, respectively. The quadratic model of (eqn (1)) was used to explain the relationship of responses as a function of independent variables:51–53
6, respectively. The quadratic model of (eqn (1)) was used to explain the relationship of responses as a function of independent variables:51–53
 | (1) |
| Run | Independent variables | Response | |||
|---|---|---|---|---|---|
| Nitric acid (molarity) | Time (hour) | Temperature (°C) | Residual Cu (ppm) | Cu removal efficiency (%) | |
| 1 | 0.3 | 3 | 70 | 6239 | 74.53 |
| 2 | 0.6 | 2 | 80 | 1295 | 94.71 |
| 3 | 0.3 | 3 | 90 | 2903 | 88.15 |
| 4 | 0.3 | 2 | 80 | 1411 | 94.24 |
| 5 | 0.6 | 2 | 80 | 2709 | 88.9 |
| 6 | 0.3 | 1 | 70 | 12![[thin space (1/6-em)]](https://www.rsc.org/images/entities/char_2009.gif) 656 656 |
48.34 |
| 7 | 0.9 | 2 | 80 | 2035 | 91.69 |
| 8 | 0.6 | 2 | 80 | 1039 | 95.75 |
| 9 | 0.6 | 2 | 70 | 3470 | 85.83 |
| 10 | 0.9 | 1 | 70 | 2517 | 89.72 |
| 11 | 0.3 | 1 | 90 | 8460 | 65.46 |
| 12 | 0.9 | 1 | 90 | 749 | 96.94 |
| 13 | 0.6 | 2 | 80 | 1750 | 92.85 |
| 14 | 0.9 | 3 | 70 | 718 | 97.06 |
| 15 | 0.6 | 2 | 80 | 1896 | 92.26 |
| 16 | 0.6 | 3 | 80 | 835 | 96.59 |
| 17 | 0.6 | 1 | 80 | 1935 | 92.10 |
| 18 | 0.6 | 2 | 90 | 1662 | 93.21 |
| 19 | 0.9 | 3 | 90 | 1492 | 93.91 |
RSM is one of the most efficient statistical and mathematical methods that is used for the investigation of multiple factors.54 In this work, the CCD was used to determine the effect of operating parameters (the molarity of nitric acid, working temperature, and leaching time) on the efficiency of copper removal. In the model equation obtained, the efficiency of copper removal (η) was determined as a function of (A) acid solution concentration, (B) operating temperature (C), and leaching time (eqn (2)). The model that relates the responses to operating parameters was developed using RSM in terms of actual factors:
| η = 9.86A + 4.22B + 5.77C − 9.92B2 − 5.57AC + 93.23 | (2) |
Table 2 presented ANOVA results to determine the statistical significance of the major variable effects as well as the interaction effects. The significance level employed in the analysis evaluated by p-values is less than 0.05.55 The significance of the predicted models and their parameters can be determined using ANOVA.56 The model F-value and p-value (prob > F) are 9.72 and 0.0005, respectively, which implies the model is significant.57 Generally, the larger F-statistic and smaller P-value indicate a higher significance of the corresponding variables. More specifically, values of “prob > F” less than 0.05 indicates that model terms are significant, while values greater than 0.1 are not considered significant items. The p-value is less than the significance level, so the sample data provide sufficient evidence that the developed regression model fits the data better than the model with no independent variables.58
| Factor | Sum of squares | DOF | Mean square | F-Value | P-Value |
|---|---|---|---|---|---|
| a R2 = 0.7889, adjusted R2 = 0.7077, predicted R2 = 0.4561, adequate precision = 11.960. | |||||
| Model | 2197 | 5 | 439.42 | 9.72 | 0.0005 |
| A: acid concentration | 972 | 1 | 972.20 | 21.50 | 0.0005 |
| B: temperature | 178 | 1 | 178.00 | 3.94 | 0.0688 |
| C: time | 332 | 1 | 332.70 | 7.36 | 0.0178 |
| AC | 248 | 1 | 248.31 | 5.49 | 0.0357 |
| B2 | 465 | 1 | 465.87 | 10.30 | 0.0068 |
| Residual | 587.81 | 13 | 45.22 | — | — |
| Pure error | 27.81 | 4 | 6.95 | — | — |
| Cor total | 2784.89 | 18 | — | — | — |
By considering this criterion, the terms A, C, AC and, B2 for which corresponding p-values are lower than 0.05, can be considered significant and effective model parameters. The values of R2, adjusted R2 and predicted R2 for the first model (η) are 0.7889, 0.7077 and 0.4561, respectively. These values indicate that the model fitting is appropriate and accurate. Adequate precision which measures the signal to noise is desirable at ratios greater than 4. In this case, it is 11.960, which indicates the experimental data can be predicted accurately by the model. R-squared measures the strength of the relationship between the model and the dependent variable.59 The F-test of overall significance is the hypothesis test for this relationship. Because the overall F-test is significant, it can be concluded that R-squared does not equal zero, and the correlation between the model and dependent variable is statistically significant.60
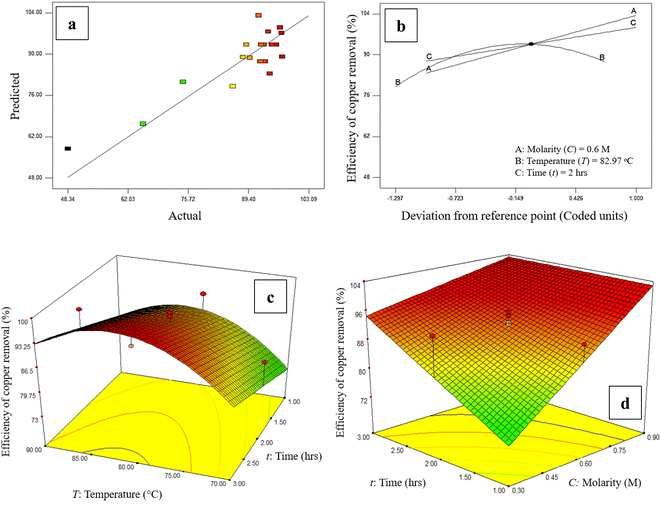
In addition, the values calculated by eqn (2), which are called predicted values, versus the actual values obtained by experiments, are shown in Fig. 2a which shows there is a good agreement between the predicted values and the actual ones. Three-dimensional response plots which were used to investigate the existence of a relationship between the acid media molarity and leaching time with copper removal efficiency are shown in Fig. 2c and d. The copper removal efficiency increased with both the rise of acid molarity and operating time and from Fig. 2b, the optimum operating temperature of the leaching process for removing copper in the form of chalcopyrite is around 82 °C. As a result, by increasing the contact time between the acidic solution and the MoS2 concentrate, both CuFeS2 solubility in acidic solution and the purity of MoS2. A limiting factor is the pulp density which, if too high means that the acid media becomes saturated with impurities faster, reducing the ability of the nitric acid to remove impurities.
Fig. 2b shows the perturbation plots related to the effect of the main factors on the efficiency of copper removal from WMC, which include the molarity of the acid solution, the operating temperature, and also the time of leaching an increase of the acid solution molarity and duration time of the leaching leads to a higher efficiency of the process. While temperatures up to 82.97 °C increases efficiency, at higher temperatures the amount of removed copper decreases to around 85%. From these experiments, run 12 (from Table 1) was selected as the optimum for the purification process of molybdenite concentrate (T: 80 °C, t: 2 h, M: 0.6) with an efficiency of copper removal of more than 95%.
Table 3 shows the leaching data obtained from filtered acidic solution after the purification of molybdenite concentrate. To obtain accurate data, each experiment was repeated twice. Every series of experiments was performed based on one fixed parameter and two variable parameters. Finally, the efficiency of decreasing main impurities included copper and iron is listed in Table 3.
| Operating parameters | Residual Cu (ppm) | Efficiency of copper removal | Residual Fe (ppm) | Efficiency of iron removal | |
|---|---|---|---|---|---|
| Molarity of nitric acid | 0.6 | 7689 | 78.46 | 3938 | 23.84 |
| 0.9 | 8519 | 86.93 | 5601 | 33.91 | |
| 0.3 | 4859 | 49.59 | 4001 | 24.22 | |
| 0.6 | 6539 | 66.73 | 6890 | 41.71 | |
| 0.9 | 8010 | 81.73 | 5552 | 33.61 | |
| 0.3 | 3028 | 30.91 | 3226 | 19.53 | |
| Time of leaching | 2 | 6111 | 62.34 | 10![[thin space (1/6-em)]](https://www.rsc.org/images/entities/char_2009.gif) 817 817 |
65.48 |
| 1 | 5302 | 54.08 | 7739 | 46.85 | |
| 3 | 8263 | 84.28 | 6214 | 37.62 | |
| 1 | 6027 | 61.53 | 7790 | 47.16 | |
| 3 | 8796 | 89.79 | 9629 | 58.29 | |
| 2 | 8159 | 83.36 | 10![[thin space (1/6-em)]](https://www.rsc.org/images/entities/char_2009.gif) 604 604 |
64.19 | |
| Temperature of leaching | 80 | 8550 | 87.24 | 4926 | 29.82 |
| 80 | 8691 | 88.67 | 8352 | 50.56 | |
| 90 | 8378 | 85.51 | 8228 | 49.81 | |
| 90 | 6909 | 70.51 | 8230 | 49.82 | |
| 70 | 5919 | 60.4 | 6426 | 38.9 | |
| 70 | 5647 | 57.65 | 8428 | 51.02 | |
3.1. Effect of nitric acid concentration
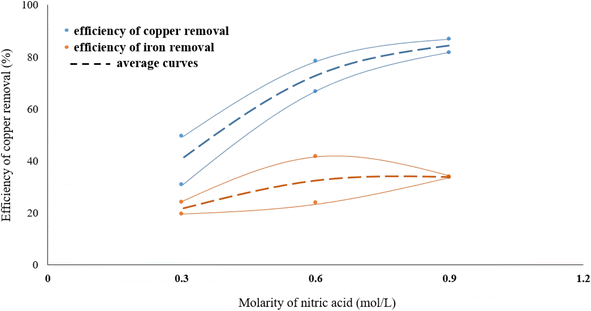
The effect of acid molarity on the dissolution of copper in the form of chalcopyrite was investigated using three different HNO3 concentrations (0.3, 0.6 and 0.9 mol L−1). In these experiments, the reaction temperature was kept constant at 70 °C, the solid/liquid ratio at 40 g L−1 and stirring speed at 500 rpm. The results, as shown in Fig. 3, demonstrate that the Cu removal increases as acid concentration increases. The molarity of nitric acid has an important effect on the copper dissolution efficiency from molybdenite concentrate. As seen in Fig. 2, leaching in 0.9 M HNO3 dissolved around three times as much copper from the molybdenite concentrate than a leaching in 0.3 M acid solution. This large effect of molarity on the efficiency of copper dissolution suggests that the dissolution reaction is controlled by heating.In the range of the acid molarity studied, the dissolution rate of iron is much lower than copper and increasing the molarity of nitric acid did not have a significant effect on decreasing the iron content. On the other hand, the removal efficiency of copper is between 1.5 and 2 times higher than iron.
3.2. Effect of leaching time
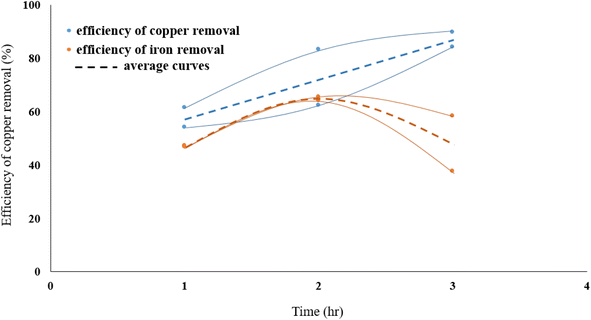
Fig. 4 presents the influence of leaching time on eliminating copper from molybdenite concentrate. The role of time on the dissolution of copper was investigated at various times (1, 2 and 3 h). In these experiments, the reaction temperature was kept constant at 70 °C, solid/liquid ratio at 40 g L−1, nitric acid molarity at 0.3 M, and stirring speed at 500 rpm. According to Fig. 2, the reaction rate has increased with increasing temperature. It can be concluded that chalcopyrite particles are slowly dissolved in the leach solution.In the range of time studied and after two hours of leaching process, the dissolution of iron decreases, while increasing the exposure time of molybdenite to nitric acid enhances the dissolution efficiency of copper.
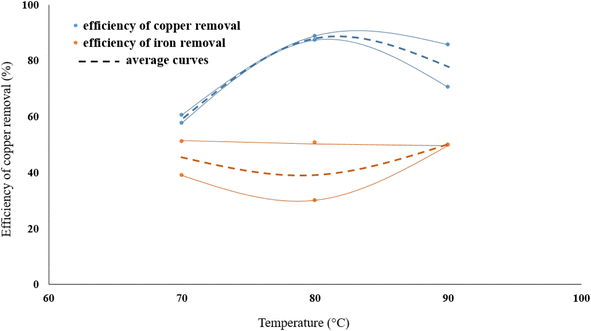
3.3. Effect of temperature
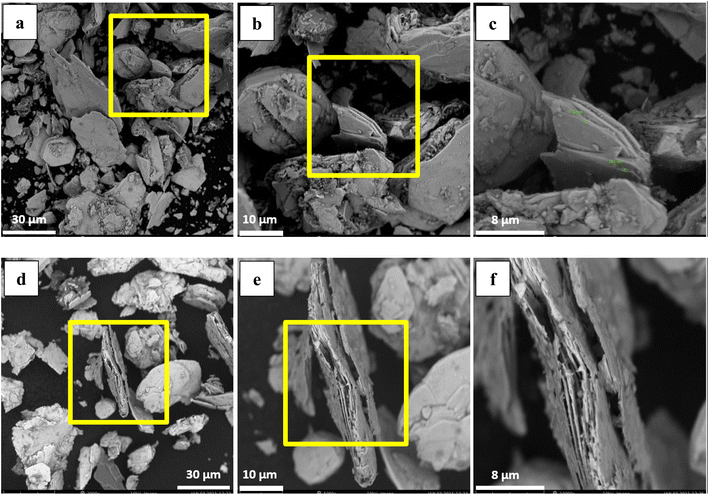
The effect of temperature on copper removal efficiency was investigated at 70, 80, and 90 °C. During the test, HNO3 concentration (0.3 M), stirring speed (500 rpm), leaching time (1 hour) and pulp density (32 g of WMC to 800 mL of acid solution) were kept constant. The results are presented in Fig. 5 which indicate that raising the temperature increases the Cu extraction but temperatures higher than 80 °C did not further increase the dissolution of copper from the molybdenite concentrate although it did have a positive effect on the reduction of iron content.One Mo and two S atoms form strong covalent connections within MoS2 layers, whereas weak van der Waals forces connect MoS2 monolayers.61 The multilayered nature of particles is demonstrated by SEM images of washed MoS2 (WMC) (Fig. 6a–c). In treated MoS2, an increase in the inter-layer space is observed following leaching (Fig. 6d–f). The removal of NOx may also have contributed to increasing the lattice expansion between MoS2 layers. As shown schematically in Fig. 7, and according to reaction (3) (the main reaction of sulfide minerals with acidic solutions) and reaction (4), sulfur vacancies in molybdenum disulfide can result from the partial removal of sulfur during the leaching process.24,62
| 3MS + 2HNO3 + 3H2SO4 → 3MSO4 + 3S0 + 2NO + 4H2O | (3) |
| MoS2 + 6HNO3 → H2MoO4 + 2H2SO4 + 6NO | (4) |
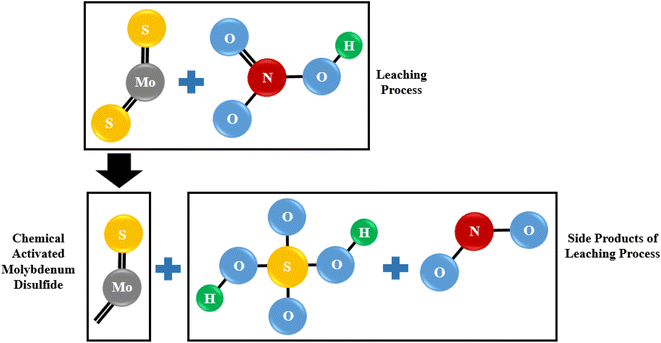 | ||
| Fig. 7 The scheme of sulfur vacancies created in MoS2 during the leaching process as a consequence of the reaction between molybdenum disulfide and nitric acid. | ||
Therefore, not only pyrite (reaction (5)) and chalcopyrite (reaction (6)) are oxidized, but also the separation of sulfur from MoS2 is caused by a chemical reaction that releases compounds like sulfuric acid (H2SO4) and nitrogen oxide (NOx).24
| 2FeS2 + 10HNO3 → Fe2(SO4)3 + H2SO4 + 10NO + 4H2O | (5) |
As see in reaction (5), nitric acid converts pyrite to ferric sulfate (Fe2(SO4)3) while producing the sulfuric acid (H2SO4), nitrogen monoxide gas (NO) and water (H2O) are as byproducts of the reaction.
| CuFeS2 + 4HNO3 → Cu(NO3)2 + Fe(NO3)3 + 2S + 2NO + 2H2O | (6) |
In reaction (6), nitric acid acts as an oxidizing agent and oxidizes the sulfide ions in chalcopyrite to elemental sulfur (S). The copper and iron ions are then dissolved in the nitric acid to form copper nitrate (Cu(NO3)2) and iron nitrate (Fe(NO3)3). The nitrogen monoxide gas (NO) and water (H2O) are also produced as byproducts of the reaction. The sulfuric acid generated from the reaction (5) aids in speeding up the dissolution of chalcopyrite in nitric acid. So, it leads to a higher solubility of chalcopyrite in comparison to pyrite, as observed in the results obtained under same operating conditions. Hence, reaction (7) is a better representation of what occurs in reality.
| 6CuFeS2 + 34HNO3 + 3H2SO4 → 3Fe2(SO4)3 + 6CuSO4 + 34NO + 20H2O | (7) |
The leaching process involves treating the molybdenite with a chemical solution, which dissolves the copper and leaves behind the molybdenite.63 The removal of copper from molybdenite through leaching can have a significant impact on the catalytic properties of the mineral. Molybdenite is commonly used as a catalyst in the petrochemical industry, and the presence of copper can interfere with its catalytic activity.64 By removing the copper through leaching, the catalytic properties of the molybdenite can be improved. The resulting material can have a higher surface area, which can increase its catalytic activity. Additionally, the removal of copper can reduce the formation of unwanted byproducts during catalysis, leading to a more efficient and selective process. On the other hand, drawbacks of unsupported MoS2 monolayers as catalyst include a low production rate, low porosity and a high aggregation degree, low catalytic. Thus, multilayer-MoS2 based catalysts can feature an enlarged active surface and have a higher activity. Thus, few-layer ordered and supported MoS2 catalysts are expected to have high efficiency in heterogeneous catalysis in numerous reaction systems.64,65
The results of slight reduction in iron content from molybdenite concentrate show that changes in the morphology of molybdenum trioxide after oxidation roasting are controlled by copper amount in the form of chalcopyrite.66
To obtain the optimum conditions for the oxidative roasting process, a series of experiments were conducted using the roasting temperature and the process time as main factors. SEM images (Fig. 8) show that the size reduction of the particles is a dominant phenomenon during the conversion of MoS2 to MoO3. Furthermore, the apparent surface of particles formed is that of quasi-hexagonal multilayer sheets, while the formation of short fibers is seen after the roasting process. Generally, MoO3 fibers have a small surface area as a consequence of the oxidative roasting reaction of molybdenite.
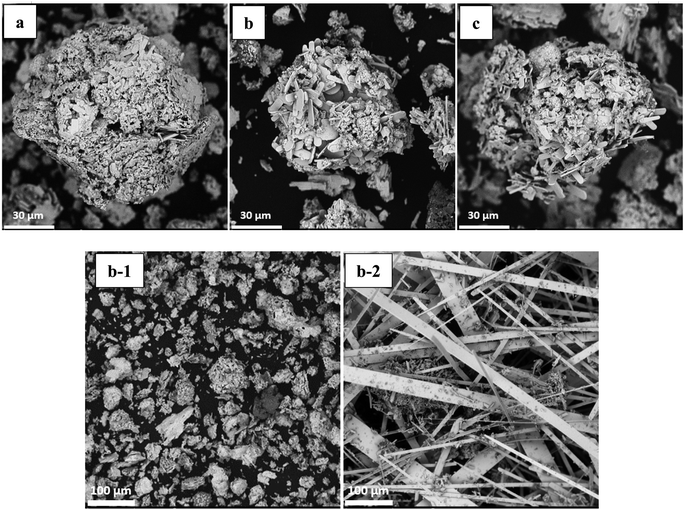 | ||
| Fig. 8 SEM images of roasted impure MoO3 at (a) 600 °C; (b) 625 °C; (c) 650 °C. (b-1) roasted impure and (b-2) roasted purified MoO3 at 625 °C. | ||
The oxidation process of MoS2 can occur inside an electrical furnace in presence of atmospheric oxygen. Molybdenum trioxide, which is converted in two stages as the reaction product between MoS2 and O2, is produced (MoS2 → MoO2 → MoO3), according to the reactions (8) and (9):67,68
| MoS2 + 3O2 → MoO2 + 2.5SO2 | (8) |
| MoO2 + 0.5O2 → MoO3 | (9) |
The overall reaction (10) of the oxidation process to convert molybdenum disulfide to trioxide can be written as follows:68
| MoS2 + 3.5O2 → MoO3 + 2SO2 | (10) |
It appears that the conversion rate to molybdenum trioxide is relatively low and occurs incompletely below 500 °C but can be accelerated at higher temperatures although there is a propensity for sintering above 625 °C owing to the presence of copper in the chemical composition of the concentrate.69 One of the reasons for sintering is the fairly low melting point of MoO3 which occurs at about 795 °C with a reaction between copper and MoO3 that lowers the melting point of the latter and accelerates the sintering of the fibers.70 Low-grade molybdenite concentrate has a copper content of 2.54% (in the form of chalcopyrite) compared to purified molybdenite with a copper content around 0.10%. Thus, sintering of impure concentrate could be caused by copper oxide and molybdenum trioxide forming a eutectic at 700 °C so, it is likely that significant sintering could take place at temperatures above 600 °C. At above 620 °C, the phenomena of melting/glazing simultaneously start to take place.71
In this research, particles of low grade molybdenite concentrate were investigated and the overall shape change of all the molybdenite particles after the oxidative roasting was considerable, as indirectly verified by scanning electron microscopy (SEM) as shown in Fig. 8. It appears that 625 °C is the best temperature for achieving more uniform fibers (Fig. 8b) as their growth is incomplete at lower temperature (600 °C) (Fig. 8a). However, agglomeration and sintering happen at higher temperatures (650 °C) (Fig. 8c) owing to the presence of copper that acts as an obstacle for the crystalline growth of molybdenum trioxide fibers. The SEM images of the molybdenum trioxide powder obtained after the purification of molybdenite concentrate exhibited a size change of fibers morphologically. The initial particles in the form of quasi-hexagonal molybdenum disulfide flakes have been predominantly changed into quasi-rectangular fiber structures after heating at 625 °C for 1 h. The size of the purified rectangular fibers is larger than the fibers produced from impure molybdenite concentrate. However, when the roasting temperatures are higher than 625 °C, the impure-MoO3 fibers joined together and sintering occurred. Additionally, it is evident that the agglomerated structure of the high-chalcopyrite MoO3 fibers decreases with increasing purity of the molybdenite concentrate used.
The obtained results confirm that iron removal, almost completely, can be led to the formation of thinner fibers with a more uniform diameter.40–42 While, after leaching of molybdenite under the designed conditions, the removed iron impurity was measured around 40 to 50% that it may be considered in the form of CuFeS2. In the other words, Iron in the form of FeS2 was not dissolved in the acid solution or its dissolution amounts was trace. Nonetheless, using nitric acid have eliminated the highest content of Cu, over 95%, from molybdenite concentrate. So, according to the research findings, the presence or absence of copper in molybdenite concentrate composition is only affected parameter that plays a critical role in increasing the length of MoO3 fibers. It can, therefore, be deduced that changes of molybdenite composition have a direct impact on the MoO3 morphology.
The results show that the morphology of the molybdenum trioxide produced is controlled by the copper content of the molybdenite concentrate used and that is influenced by of the purification conditions and temperature of the leaching process. Thus, copper in the form of chalcopyrite plays a negative role in the crystalline growth of MoO3 fibers as their length can be considerably increased after decreasing the copper content.
Fig. 8(b) and (b1) illustrates that the clustered fibers have a short coral-like fiber morphology with mean diameters and lengths of about 3 and 20 μm, respectively. From the high magnification SEM image of impure MoO3, it can be seen that the micro-clusters are constructed by rather rough microfibers with the average diameters of about 150–200 nm, which seemingly have grown around a center. In order to survey the growth mechanism and control the morphology of MoO3 microfibers, some experiments have been performed including purification and copper reduction by leaching process and optimization of roasting temperature. Different morphologies of MoO3 fibers (shown in Fig. 8(b2)) can be obtained after leaching by nitric acid, implying that chalcopyrite reduction plays an important role in the control of the morphology of MoO3 fibers. After purification via HNO3 leaching and calcination at 625 °C in air for 1 h, the coral-like morphology of the MoO3 almost disappeared.
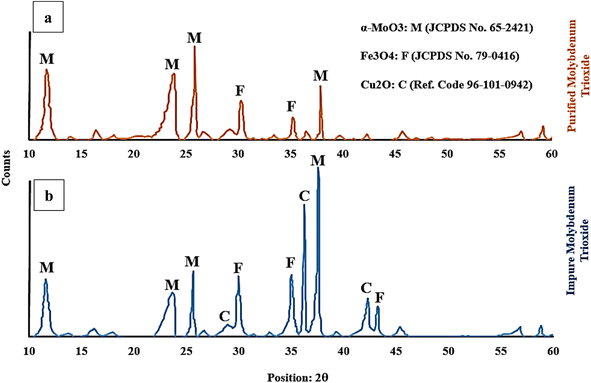
Fig. 9 shows the XRD graph to identify the impurities present in the purified (Fig. 9a) and impure (Fig. 9b) molybdenum trioxide after roasting in air atmosphere. The phase transformation temperature of chalcopyrite to its oxide state depends on various factors such as heating rate, oxygen pressure and the purity of the chalcopyrite. The phase transformation of chalcopyrite (between 500 °C to 800 °C) and pyrite (between 500 °C to 900 °C) to their oxide state results in the formation of copper and iron oxides. At mentioned temperatures, pyrite decomposes to form iron oxide (FeO) and sulfur dioxide (SO2). The main copper oxide formed during this process is cuprous oxide (Cu2O) while the iron oxide produced is mainly magnetite (Fe3O4). However, other iron oxide phases such as hematite (Fe2O3) and wustite (FeO) may also be produced depending on reaction conditions. Mineralogical investigation of the samples (IMT and PMT) showed α-MoO3 as the main oxide that is also known as a catalytic phase as well as Cu2O and Fe3O4 as the minor mineral impurities present.
The crystalline α-MoO3 structure was indexed at 12.3°, 23.3°, 26.4°, and 38.7° corresponding to the (020), (110), (040), and (060) crystal planes, which matched with the corresponding standard card (JCPDS card No. 65-2421) of the catalytic MoO3 structure.
Additionally, the X-ray diffraction (XRD) pattern for pyrite present in molybdenite may vary depending on the specific sample and the experimental conditions used in the study. The standard card of JCPDS card No. 79-0416 indicates that characteristic peaks for magnetite are typically observed at around 30.1°, 35.6°, and 43.2° which correspond to the (220), (311), and (400) crystallographic planes, respectively.
The XRD pattern for Cu2O, as the reference code 96-101-0942, has peak positions of 28.5°, 35.5°, and 38.7°, which correspond to the (110), (111), and (200) crystallographic planes, respectively. The successful purification of the molybdenite concentrate through the HNO3 leaching process is confirmed by the absence of a cuprous oxide peak in Fig. 9a.
4. Conclusions
Removing impurities, especially chalcopyrite, from low-grade molybdenite concentrate (RMC) in nitric acid media was studied using response surface methodology. The effect of operating factors including reaction time, leaching temperature, and HNO3 molarity were addressed by central composite design. It was observed that copper in the form of chalcopyrite as the main impurity declined considerably (more than 95%) under optimum conditions. According to the results of these experiments, to maximize copper removal, a reaction time of 2 h, reaction temperature of higher than 80 °C, HNO3 molarity of 0.6 M, pulp density of 40 g L−1 (32 g raw molybdenite: 800 mL HNO3 solution) and same rotation speed of 500 rpm should be selected. The morphology of the molybdenum trioxide is mainly investigated by SEM images with the conclusion copper acts as an obstacle to the crystalline growth of molybdenum trioxide fibers. The results showed that the removal of copper impurity from molybdenite is only positive effective factor on enhancement of fiber length. Meanwhile, the presence or absence of iron impurities, in the forms of CuFeS2 and FeS2, are ineffective on the further growth of molybdenum trioxide fibers. Thus, chalcopyrite elimination resulting from molybdenite leaching, plays an important role in controlling the morphology of MoO3 and enhancing the length of quasi-rectangular microfibers from less than 30 μm for impure IMT up to several centimeters for PMT.Conflicts of interest
The authors declare that they have no competing interests.Abbreviations
| CCD | Central composite design |
| ICP-MS | Inductively coupled plasma-mass spectrometer |
| ICP-OES | Inductively coupled plasma-optical emission spectrometry |
| IMT | Impure molybdenum trioxide |
| PMC | Purified molybdenite concentrate |
| PMT | Purified molybdenum trioxide |
| RMC | Raw molybdenite concentrate |
| RSM | Response surface methodology |
| SEM | Scanning electron microscope |
| WMC | Washed molybdenite concentrate |
| XRD | X-ray diffraction |
Acknowledgements
Masoud Mirzaei gratefully acknowledges supports from Science and Research Branch of the Islamic Azad University, Ferdowsi University of Mashhad, Iran Science Elites Federation (ISEF), Zeolite and Porous Materials Committee of Iranian Chemical Society and Iran National Science Foundation (INSF). Authors want to express their heartfelt gratitude and appreciation to Dr. Khajavian for his invaluable support and guidance. Also, we hereby declare that this article is an extract from a doctoral dissertation with tracking code 162490379, conducted under the supervision of the "Department of Materials Engineering, Faculty of Engineering, Science and Research Branch, Islamic Azad University, Tehran, Iran".References
- G. Yi, E. Macha, J. V. Dyke, R. Macha, T. McKay and M. L. Free, Recent progress on research of molybdenite flotation: A review, Adv. Colloid Interface Sci., 2021, 295(4), 1–41 Search PubMed.
- M. Abdollahi, A. Bahrami, A. Danesh, Y. Ghorbani, M. S. Mirmohammadi and F. Kazemi, A process mineralogy approach to optimize molybdenite flotation in copper – molybdenum processing plants, Miner. Eng., 2020, 157, 1–10 CrossRef.
- B.-S. Kim, H.-I. Lee, Y.-Y. Choi and S. Kim, Kinetics of the oxidative roasting of low grade mongolian molybdenite concentrate, Mater. Trans., 2009, 50, 2669–2674 CrossRef CAS.
- M. Moazemi Goodarzi, B. Rezai and A. Seifikhani, Leaching and Kinetic Modelling of Molybdenite Concentrate Using Hydrogen Peroxide in Sulfuric Acid Solution, Iran. J. Chem. Chem. Eng., 2014, 33, 73–85 Search PubMed.
- H. Abdollahi, Z. Manafi, Z. Shafaei Sied, M. Noaparast and N. Manafi Moorkani, Removal of copper from molybdenite concentrate by mesophilic and extreme thermophilic microorganisms, Int. J. Min. Sci. Technol., 2013, 23, 827–834 CrossRef CAS.
- S. Liu, Y. Li, J. Liu, Z. Yang, J. Liu and Y. Shi, Equilibrium Cu isotope fractionation in copper minerals: a first-principles study, Chem. Geol., 2021, 564, 1–12 CrossRef.
- A. Bahrami, M. Mirmohammadi, Y. Ghorbani, F. Kazemi, M. Abdollahi and A. Danesh, Process mineralogy as a key factor affecting the flotation kinetics of copper sulfide minerals, Int. J. Miner., Metall. Mater., 2019, 26, 430–439 CrossRef CAS.
- Z. Xiao-liang, J. Kou, S. Chun-bao, Z. Rui-yang, S. Min and L. Shuo-fu, Mineralogical characterization of copper sulfide tailings using automated mineral liberation analysis: A case study of the Chambishi Copper Mine tailings, Int. J. Miner., Metall. Mater., 2021, 28, 944–955 CrossRef.
- T. Agaçayak and A. Aras, Leaching of chalcopyrite concentrate (CuFeS2) in nitric acid (HNO3) solution, Acad. J. Sci., 2013, 2, 61–65 Search PubMed.
- W. Zhang, A. Noble, X. Yang and R. Honaker, A comprehensive review of rare earth elements recovery from coal-related materials, Catalysts, 2020, 10, 1–28 CrossRef.
- I. Sadia, K. Min-seuk and L. Jae-chun, Integration of microbial and chemical processing for a sustainable metallurgy, J. Chem. Technol. Biotechnol., 2017, 93, 320–332 Search PubMed.
- S. Anggara, F. Bevan, R. C. Harris, G. Frisch, J. M. Hartley, G. R. T. Jenkin and A. P. Abbott, Direct extraction of copper from copper sulfide minerals using deep eutectic solvents, Green Chem., 2019, 21, 6502–6512 RSC.
- R. Padilla, H. Letelier and M. C. Ruiz, Copper removal from molybdenite by sulfidation leaching process, Mater. Process. Fundam., 2013, 217–223 CAS.
- K. J. Nyembwe, E. Fosso-Kankeu, F. Waanders and M. Mkandawire, pH-dependent leaching mechanism of carbonatitic chalcopyrite in ferric sulfate solution, Trans. Nonferrous Met. Soc. China, 2021, 31, 2139–2152 CrossRef CAS.
- A. Kritskii, K. Karimov and S. Naboichenko, Pressure leaching of chalcopyrite concentrate: Iron removal from leaching residues, Solid State Phenom., 2020, 299, 1052–1057 Search PubMed.
- I. Park, S. Hong, S. Jeon, M. Ito and N. Hiroyoshi, A review of recent advances in depression techniques for flotation separation of Cu–Mo sulfides in porphyry copper deposits, Metals, 2020, 10, 1–26 Search PubMed.
- S. Lin, R. Liu, Y. Hu, W. Sun, Z. Shi, H. Han and W. Li, Optimize flotation process of Mo-Bi sulfide ore for cleaner production, J. Cleaner Prod., 2021, 1–11 Search PubMed.
- M. Abdollahi, S. Z. Noaparast, A. Shafaei, A. Akcil, S. Panda, M. Hazrati Kashia and P. Karimi, Prediction and optimization studies for bioleaching of molybdenite concentrate using artificial neural networks and genetic algorithm, Miner. Eng., 2019, 130, 24–35 CrossRef.
- D. Yuan, K. Cadien, Q. Liu and H. Zeng, Selective separation of copper-molybdenum sulfides using humic acids, Miner. Eng., 2019, 133, 43–46 CrossRef CAS.
- Y. Chen, X. Chen and Y. Peng, The effect of sodium hydrosulfide on molybdenite flotation as a depressant of copper sulfides, Miner. Eng., 2020, 148, 1–7 CrossRef.
- T. Huang, X. Wei and S. Zhang, Bioleaching of copper sulfide minerals assisted by microbial fuel cells, Bioresour. Technol., 2019, 288, 1–7 Search PubMed.
- I. Park, S. Hong, S. Jeon, M. Ito and N. Hiroyoshi, Flotation Separation of Chalcopyrite and Molybdenite Assisted by Microencapsulation Using Ferrous and Phosphate Ions: Part I. Selective Coating Formation, Metals, 2020, 10, 1–11 Search PubMed.
- R. Padilla, H. Letelier and M. C. Ruiz, Kinetics of copper dissolution in the purification of molybdenite concentrates by sulfidation and leaching, Hydrometallurgy, 2013, 137, 78–83 CrossRef CAS.
- K. M. Smirnov, N. A. Raspopov, Y. M. Shneerson, A. Y. Lapin, G. A. Bitkov, Y. A. Menshikov, P. N. Paskhin and V. P. Kirichenk, Autoclave leaching of molybdenite concentrates with catalytic additives of nitric acid, Russ. Metall., 2010, 588–595 CrossRef.
- K. Benzeşik, S. Sonmez and O. Yücel, Evaluation of molybdenum concentrates, The Minerals, Metals & Materials Society, 2017, pp. 441–447 Search PubMed.
- S. Petrovic, G. D. Bogdanovic and M. M. Antonijevic, Leaching of chalcopyrite with hydrogen peroxide in hydrochloric acid solution, Trans. Nonferrous Met. Soc. China, 2018, 28, 1444–1455 CrossRef CAS.
- T. D. C. Almeida, E. M. Garcia, H. W. A. da Silva, T. Matencio and V. de Freitas Cunha Lins, Electrochemical study of chalcopyrite dissolution in sulphuric, nitric and hydrochloric acid solutions, Int. J. Miner. Process., 2016, 149, 25–33 CrossRef CAS.
- A. S. Medvedev and P. V. Alexandrov, Variants of processing molybdenite concentrates involving the use of preliminary mechanical activation, Russian Journal of NonFerrous Metals, 2012, 53, 437–441 CrossRef.
- H. Shalchian, J. Vahdati Khaki, A. Babakhani, I. De Michelis, F. Veglio and M. Torabi Parizi, An enhanced dissolution rate of molybdenite and variable activation energy, Hydrometallurgy, 2018, 175, 52–63 CrossRef CAS.
- L.-I. Sui, Y.-M. Xu, X.-F. Zhang, X.-L. Cheng, S. Gao, H. Zhao, Z. Cai and L.-H. Huo, Construction of three-dimensional flower-like alpha-MoO3 with hierarchical structure for highly selective triethylamine sensor, Sens. Actuators, B, 2015, 208, 406–414 CrossRef CAS.
- M. Liao, L. Wu, Q. Zhang, J. Dai and W. Yao, Controlled morphology of single-crystal molybdenum trioxide nanobelts for photocatalysis, J. Nanosci. Nanotechnol., 2020, 20, 1917–2192 CrossRef CAS PubMed.
- T. Marin, T. Utigard and C. Hernandez, Roasting kinetics of molybdenite concentrates, Can. Metall. Q., 2009, 48, 73–80 CrossRef CAS.
- S. Kan, K. Benzeşik, Ö. Can Odabaş and O. Yücel, Investigation of molybdenite concentrate roasting in chamber and rotary furnaces, Min., Metall., Explor., 2021, 38, 1597–1608 Search PubMed.
- X. Wang, Z. Feng, J. Liu, Z. Huang, J. Zhang, J. Mai and Y. Fang, In-situ preparation of molybdenum trioxide-silver composites for the improved photothermal catalytic performance of cyclohexane oxidation, J. Colloid Interface Sci., 2020, 580, 377–388 CrossRef CAS PubMed.
- G. Mai, C. Zhang, J. Song, Y. Che and J. He, Preparation of highly uniform molybdenum powder by the short-process reduction of molybdenum trioxide with hydrogen, Int. J. Refract. Met. Hard Mater., 2021, 100, 1–7 CrossRef.
- X. Hou, J. Huang, M. Liu, X. Li, Z. Hu, Z. Feng, M. Zhang and J. Luo, Single-crystal MoO3 micrometer and millimeter belts prepared from discarded molybdenum disilicide heating elements, Nature, 2018, 8, 1–8 Search PubMed.
- Y. Wang, Y. Zhu, Z. Xing and Y. Qian, Hydrothermal Synthesis of α-MoO3 and the Influence of Later Heat Treatment on its Electrochemical properties, Int. J. Electrochem. Sci., 2013, 8, 9851–9857 CAS.
- M. Szkoda, K. Trzcinski, A. P. Nowak, M. Gazda, M. Sawczak and A. Lisowska-Oleksiak, The effect of morphology and crystalline structure of Mo/MoO3 layers on photocatalytic degradation of water organic pollutants, Mater. Chem. Phys., 2020, 248, 1–8 CrossRef.
- C. Ornelas, J. Lara-Romero, C. Campos-Valadez, C. Leyva-Porras and F. Paraguay-Delgado, Morphology change study of molybdenum oxide from 3D to 2D particles, Microscopy Society of America, 2019 Search PubMed.
- X. Li, Y. Chen, J. Li, Y. Shi, Y. Xiong, W. Wu, S. Cao and Y. Wang, Morphological and compositional modifications of MoO3 nanofibers through acid leaching of molybdenite concentrate, J. Alloys Compd., 2016, 680, 117–123 Search PubMed.
- N. Al Azzawi, R. R. Bacsa, M. N. Hedhili and M. S. AlSalhi, Influence of Fe on the morphology and properties of MoO3 nanofibers synthesized via hydrothermal method, J. Nanopart. Res., 2019, 21, 1–14 CrossRef.
- M. Kaveh, M. S. AlSalhi and N. Al Azzawi, Effect of Fe impurities on the morphology and properties of MoO3 nanofibers synthesized via sol-gel method, J. Sol-Gel Sci. Technol., 2020, 96, 277–287 Search PubMed.
- H. Abdollahi, S. Seyed Ziaedin, M. Noaparast, Z. Manafi, N. Aslan and A. Akcil, The effect of different additives and medium on the bioleaching of molybdenite for Cu and Mo extraction using mix mesophilic microorganism, International Journal of Mining and Geo-Engineering, 2013, 47, 61–80 Search PubMed.
- S. V. P. Vattikuti, B. Venkatesh, C. Byon, C. V. Reddy and J. Shim, Co-precipitation synthesis and characterization of faceted MoS2 nanorods with controllable morphologies, Appl. Phys. A: Mater. Sci. Process., 2015, 119, 813–823 CrossRef CAS.
- H. Shalchian, J. Vahdati Khaki, A. Babakhani and M. Torabi Parizi, Investigating the effect of mechanical activation parameters on structural changes and leaching rate of molybdenite concentrate, Procedia Mater. Sci., 2015, 11, 754–760 CrossRef CAS.
- M. K. Tanaydın, Z. B. Tanaydın and N. Demirkıran, Determination of optimum process conditions by central composite design method and examination of leaching kinetics of smithsonite ore using nitric acid solution, Journal of Sustainable Metallurgy, 2021, 7, 178–191 CrossRef.
- S. Maiti, B. Prasad and A. K. Minocha, Optimization of copper removal from wastewater by fly ash using central composite design of Response surface methodology, SN Appl. Sci., 2020, 2, 1–14 Search PubMed.
- S. Chehreghani, M. Yari, A. Amir Zeynali, B. Nemati Akhgar, H. Hosseinzadeh Gharehgheshlagh and M. Pishravian, Optimization of chalcopyrite galvanic leaching in the presence of pyrite and silver as catalysts by using Response Surface Methodology (RSM), The Mining-Geology-Petroleum Engineering Bulletin, 2021, 37–47 CAS.
- R. Fawaz Mutar and M. Anhab Saleh, Optimization of arsenic ions adsorption and removal from hospitals wastewater by nano-bentonite using central composite design, Mater. Today: Proc., 2022, 1–9 Search PubMed.
- H. Li, S. van den Driesche, F. Bunge, B. Yang and M. J. Vellekoop, Optimization of on-chip bacterial culture conditions using the Box-Behnken design response surface methodology for faster drug susceptibility screening, Talanta, 2018, 194, 627–633 CrossRef PubMed.
- M. Cánovas, J. Valenzuela, L. Romero and P. González, Characterization of electroosmotic drainage: application to mine tailings and solid residues from leaching, J. Mater. Res. Technol., 2020, 9, 2960–2968 CrossRef.
- O. D. Onukwuli and I. A. Nnanwube, Optimization of zinc recovery from sphalerite using response surface methodology and particle swarm optimization, Period. Polytech., Chem. Eng., 2022, 66, 20–29 CrossRef CAS.
- M. P. Arancibia-Bravo, F. A. Lucay, F. D. Sepúlveda, L. Cortés and L. A. Cisternas, Response Surface Methodology for Copper Flotation Optimization in Saline Systems, Minerals, 2022, 12, 1–20 CrossRef.
- S. J. Mohammed Breig and K. J. Kadhum Luti, Response surface methodology: A review on its applications and challenges in microbial cultures, Mater. Today: Proc., 2021, 42, 2277–2284 Search PubMed.
- G. Di Leo and F. Sardanelli, Statistical significance: p value, 0.05 threshold, and applications to radiomics—reasons for a conservative approach, European Radiology Experimental, 2020, 4, 1–8 CrossRef PubMed.
- M. Elkelawy, H. Alm-Eldin Bastawissi, K. K. Esmaeil, A. H. Radwan, H. Panchal, K. K. Sadasivuni, M. Suresh and M. Israr, Maximization of biodiesel production from sunflower and soybean oils and prediction of diesel engine performance and emission characteristics through response surface methodology, Fuel, 2020, 266, 1–17 CrossRef.
- N. Saafie, M. Fakhrul Ridhwan Samsudin and S. Sufian, Optimization of methylene blue adsorption via functionalized activated carbon using response surface methodology with central composite design, Key Eng. Mater., 2020, 841, 220–224 Search PubMed.
- R. Behmadi, M. Mokhtarian, A. Davoodi and S. Hosseinpour, Desulfurization of natural gas condensate using polyethylene glycol and water intercalated activated γ-bauxite, J. Cleaner Prod., 2022, 1–9 Search PubMed.
- R. Valbuena, A. Hernando, J. Antonio Manzanera, E. B. Görgens, D. R. A. Almeida, C. A. Silva and A. García-Abril, Evaluating observed versus predicted forest biomass: R-squared, index of agreement or maximal information coefficient?, Eur. J. Remote Sens., 2019, 52, 345–358 CrossRef.
- M. S. Kim, Comparative R squared, 2021, 1–26 Search PubMed.
- R. M. Arif Khalil, F. Hussain, A. Manzoor Rana, M. Imran and G. Murtaza, Comparative study of polytype 2H-MoS2 and 3R-MoS2 systems by employing DFT, Phys. E, 2019, 106, 338–345 CrossRef CAS.
- Y. Zhao, J. Hwang, M. T. Tang, H. Chun, X. Wang, H. Zhao, K. Chan, B. Han, P. Gao and H. Li, Ultrastable molybdenum disulfide-based electrocatalyst for hydrogen evolution in acidic media, J. Power Sources, 2020, 456, 1–9 Search PubMed.
- D. R. Nagaraj, R. R. Joshi and S. R. Valluri, Leaching of molybdenite concentrate with nitric acid: effect of process parameters and optimization of copper removal, Sep. Sci. Technol., 2015, 51, 216–227 Search PubMed.
- C. Liu, L. Yuan, Y. Ma, L. Zhang, Y. Sun and C. Ma, Effect of acid leaching on the structure and catalytic properties of MoO3 catalysts for propane oxidation, Appl. Surf. Sci., 2019, 481, 563–571 Search PubMed.
- A. Maleki and H. A. Kazemian, The role of copper in activity and stability of MoS2 catalysts: A review, J. Mol. Catal. A: Chem., 2016, 422, 186–201 Search PubMed.
- Q. Liu, R. Liu, S. Yang, W. Feng and M. Wang, Removal mechanism of mineral impurities in molybdenum concentrate treatment process, Minerals, 2023, 13, 1–18 Search PubMed.
- C. Wu, L. Ma, Y. Zhu, X. Guo, Y. Wu, Z. Wu, X. Zhang and L. Hou, High-temperature reaction mechanism of molybdenum metal in direct coal liquefaction residue, Catalysts, 2022, 12, 1–14 Search PubMed.
- H. Sun, G.-H. Li, Q.-Z. Bu, Z.-Q. Fu, H.-B. Liu, X. Zhang, J. Luo, M.-J. Rao and T. Jiang, Features and mechanisms of self-sintering of molybdenite during oxidative roasting, Trans. Nonferrous Met. Soc. China, 2022, 32, 307–318 CrossRef CAS.
- A. Abdulrasheed, A. Abdul Jalil, Y. Gambo, M. Ibrahim, H. U. Hambali and M. Y. Shahul Hamid, A review on catalyst development for dry reforming of methane to syngas: Recent advances, Renewable Sustainable Energy Rev., 2019, 108, 175–193 CrossRef CAS.
- A. Eschenbacher, A. Saraeian, P. A. Jensen, B. H. Shanks, C. Li, J. Ø. Duus, T. E. L. Smitshuysen, C. D. Damsgaard, A. B. Hansen, K. I. Kling, U. V. Mentzel, U. B. Henriksen, J. Ahrenfeldt and A. D. Jensen, Deoxygenation of wheat straw fast pyrolysis vapors over Na-Al2O3 catalyst for production of bio-oil with low acidity, Chem. Eng. J., 2020, 394, 1–55 CrossRef.
- U. Onwukwe, L. Anguilano and P. Sermon, Advanced characterizations of oxides for optoelectronic applications, Oxide Electron., 2021, 453–495 CAS.
Footnote |
| † Electronic supplementary information (ESI) available. See DOI: https://doi.org/10.1039/d3ra02384b |
| This journal is © The Royal Society of Chemistry 2023 |

