 Open Access Article
Exploring the redox characteristics of porous ZnCoS@rGO grown on nickel foam as a high-performance electrode for energy storage applications†
Amir Muhammad Afzal *a,
Muhammad Awaisa,
Aneeqa Yasmeena,
Muhammad Waqas Iqbala,
Sohail Mumtaz
 b,
Mohamed Ouladsmanec and
Muhammad Usmand
aDepartment of Physics, Riphah International University, Campus Lahore, Pakistan. E-mail: amirafzal461@gmail.com
bDepartment of Electrical and Biological Physics, Kwangwoon University, Seoul 01897, Korea
cDepartment of Chemistry, College of Science, King Saud University, Riyadh 11451, Saudi Arabia
dDepartment of Bioinformatics, School of Medical Informatics and Engineering, Xuzhou Medical University, Xuzhou, P. R. China
First published on 13th July 2023
Abstract
A supercapattery is a device that combines the properties of batteries and supercapacitors, such as power density and energy density. A binary composite (zinc cobalt sulfide) and rGO are synthesized using a simple hydrothermal method and modified Hummers' method. A notable specific capacity (Cs) of 1254 C g−1 is obtained in the ZnCoS@rGO case, which is higher than individual Cs of ZnS (975 C g−1) and CoS (400 C g−1). For the asymmetric (ASC) device (ZnCoS@rGO//PANI@AC), the PANI-doped activated carbon and ZnCoS@rGO are used as the cathode and anode respectively. A high Cm of 141 C g−1 is achieved at 1.4 A g−1. The ASC is exhibited an extraordinary energy density of 45 W h kg−1 with a power density 5000 W kg−1 at 1.4 A g−1. To check the stability of the device, the ASC device is measured for 2000 charging/discharging cycles. The device showed improved coulombic efficiency of 94%. These findings confirmed that the two-dimensional materials provide the opportunities to design battery and supercapacitor hybrid devices.
Introduction
Throughout the previous decade, numerous work has been done to develop efficient electrochemical energy storage appliances: lithium-ion storage-cells and supercapacitors. Research groups have focused on forming electrode materials for energy storage gadgets that can provide long-term stability, high capacity, and fast charge and discharge cycling.1–5 To attain future energy demands, energy storage devices with high-power delivery and good rate capability, that are environmentally friendly and low cost are preferred.6,7 Lately, supercapacitors (SCs) have predictable considerations owing to their fast charging, high power density, discharging speeds, exceptional cycling stability, and good environmental aspects.8–10 By the charge storage method, the supercapacitors (SCs) are distributed into two parts: pseudo capacitors (PCs) and electrical double-layer capacitors (EDLCs). The absorption or desorption of charge at the electrolyte surface is a primary charge storage method of electrical double-layer capacitors (EDLCs). These usually demonstrate extraordinary cyclic stability in the long-lasting charge and discharge process.11 While the pseudo capacitors (PCs), because of the faradaic redox responses of the electrode materials, generally offer high capacitances.12Materials such as transition metal chalcogenides (TMCs), transition metal nitrides (TMNs),13–21 conducting polymers, transition metal oxides (TMOs),22–24 and carbon materials25–27 have received considerable attention for energy-storage devices electrode fabrication in the recent years. TMNs for supercapacitor fabrication have been studied primarily, but integrating the TMNs is a time-intensive process and very difficult to synthesise. TMCs and TMOs have multiple oxidation states, so these are promising electrode materials for high-performance ultra-capacitors.28 A major challenge is to control surface area, morphology, and the structure of pseudo-capacitive materials to enhance electrochemical functioning.29 The pseudo capacitors (PCs) electrode materials are metal oxides, hydroxides, conducting polymers, and metal sulfides. The ternary metal oxides, like CuCO2O4, MnCO2O4, ZnCO2O4, and NiCO2O4, have an attractive established structure because of their high theoretical capacitance and low cost.30–34 Though, theoretical values of the specific capacitance of these ternary metal oxides are higher than experimentally calculated values. Even the ternary metal oxides owing to their low electrical conductivity capability and low activation energy value, have complications of cyclic steadiness and low-rate ability.35,36 The ternary metal sulfides have a high energy density, thermal stability, and large electrochemical active sites. Therefore, ternary metal sulfides have been considered suitable electrode materials for pseudocapacitors (PCs).37–39 Moreover, substituting oxygen (O2) with sulfur (S) shifts flexibility in configuration. It reduces the risks of structural loss owing to the higher electronegativity of oxygen (O2) compared to sulfur (S). Thus, long-term charge and discharge processes attain better stability.40–43
However, a single transition metal sulfide has a higher optical band gap but lower electrical conductivity.44–47 Rather than oxides of transition metals, their sulfides are suitable substitutes.48,49 Cobalt sulfide (CoS) and zinc sulfide (ZnS) have several advantages, like long-term steadiness, low cost, high theoretical specific capacitances, and electroactivity. Additionally, the combined effects of cobalt and zinc ions are ensuing in improved energy storage capacity due to incredible redox reactions in binary sulfides aside from those of single sulfides.50–52
In this work, the zinc–cobalt sulfide is synthesised through a hydrothermal process. The XRD, SEM, and XPS are utilised to know the structural and morphological properties. The electrochemical characteristics are estimated by measuring the CV and GCD. 3 M KOH is used as an electrolyte for two and three-electrode measurements to calculate the charge storage performance. To measure the efficiency of energy storage, an asymmetric device was used with an electrode that exhibited optimal electrochemical behaviour.
Experimental section
Materials and techniques
Zinc nitrate hex hydrate (N2O6Zn·6H2O), sodium sulfide hydrate (Na2S·9H2O), cobaltous nitrate hexahydrate (Co(NO3)2·6H2O), carbon black (CB), potassium hydroxide pellets (KOH), N-polyvinylidene-fluoride (PVDF), aniline and HCl were used and purchased from Sigma-Aldrich. Nickel Foam (NF) was acquired from Urich Technology (Malaysia). Nickel Foam (NF) was washed with ethanol, deionized (DI) water, and HCl to remove the oxide layer and the impurities from the NF surface. In this work, all solutions were prepared with deionised (DI) water.Synthesis of materials
Firstly, the zinc sulfide (ZnS) was synthesised by mixing 8.92 g of zinc nitrate hexahydrate and 8.73 g of cobalt nitrate hexahydrate in 50 ml DI water and mixed dropwise in the solution of sodium sulfide hydrate. The solution was mixed with continuous stirring for 30 minutes. The homogeneous solution was put into Teflon lined stainless steel autoclave and placed inside the oven. The solution was heated up to 6 to 7 hours at 170 °C. After the cooling process, the solution having precipitates were washed numerous time to drain the impurities and remained the pH of the solutions. Finally, the precipitates solution was heated and dried to obtain the nanostructures powder. All compounds were commercially standard and purchased from Sigma-Aldrich; no further purification was needed before usage. The systematic diagram of all the above steps is shown in Fig. 1(a and b).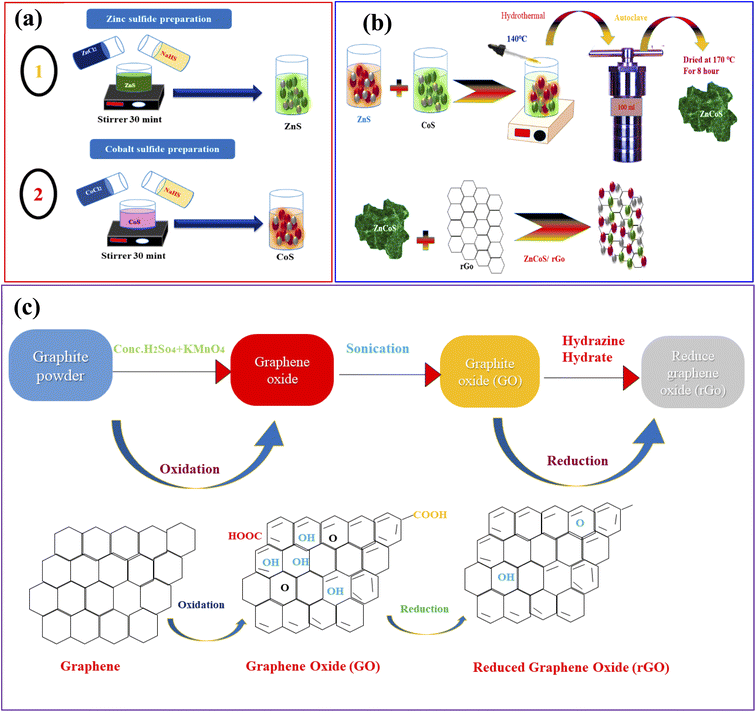 | ||
| Fig. 1 (a) Representation of the hydrothermal procedure for the synthesis of zinc sulfide (ZnS), and cobalt sulfide (CoS). (b) Syntheses of ZnCoS by hydrothermal method. (c) Syntheses of rGO. | ||
Synthesis of rGO
The chemical exfoliation method associated with Hummer's modified technique was used to make rGO from graphite flakes.53–55 Then, 2 g of flakes and 80 ml of H2SO4 were continually mixed until a dark consistent suspension was obtained. During stirring, the oxidised catalyst (KMnO4) (8 g) was added to the solution. Ice flakes were used to maintain a consistent temperature in the solution to keep the oxidation reaction from getting too hot. This combination homogeneous suspension was then kept at room temperature for 24 hours. Then, 0.4 ml of H2O2 was mixed with the brownish suspension. Aqua-dest was used to add the brown suspension to get a pH of 7. After that, the water was removed from the brown suspension, which produced a more concentrated form. After three days of vacuum freeze-drying at a low temperature, the brown suspension was finally reduced to brown powder. The dry brown powder was recognised as graphite oxide. To remove the graphene sheets from the graphite oxide powder, it was ultra-sonicated for 3 hours with 200 mg of rGO and 200 ml of aqua-dest. After three days of vacuum freeze drying, the resulting dark brown powder (GO) was condensed and dried. Annealing the GO powder at 200 degrees Celsius resulted in a size reduction. After being subjected to high temperatures, the brown powder became a dark powder known as rGO powder. The synthesis process of rGO is shown in Fig. 1(c).Synthesis of conducting polymer (polyaniline (PANI)) and activated carbon
Polyaniline was obtained by simply polymerising the aniline. The synthesis process was initiated by stirring a 20 ml 1 M HCL aqueous solution containing 0.25 M aniline for 30 minutes at room temperature. Subsequently, another 30 ml 1 M HCL aqueous solution was prepared with 0.1 M ammonium per sulfate, which was added drop by drop in the above aqueous solution and left for overnight stirring. After the night, the green precipitates accumulated at the bottom of the solution are collected and rinsed thoroughly with 0.2 M HCL aqueous solution and acetone each for two times to be dried at 60 °C afterward. The activated carbon was obtained from the waste of tea.Electrode synthesis and characterisation methods
The electrochemical properties of galvanostatic charge–discharge (GCD) and cyclic voltammetry (CV) are measured for all samples. The electrochemical properties are examined using an Auto lab PGSTAT302N Potentiostat. The potentiostat is used in a three-electrode setup for electrochemical testing. In the three-electrode assembly, a reference electrode (Hg/HgO), and a counter electrode (platinum wire) are used. The nickel foam is covered with active material. 3 M KOH solution as an electrolyte is retained constant during the whole electrochemical measurement. The intermission of the working electrode consists of 50 wt% of active material, 20 wt% of PVDF (binder), and 30 wt% of ethylene black (carbon black), all in NMP solvent. A homogeneous solution is obtained by continuously stirring for 6 hours. The nickel foam is washed with DI water, acetone, HCl, and ethanol before testing. The slurry is placed over the nickel foam uniformly for the working electrode to cover an area of 1.6 × 1.6 cm2 with a material mass of almost 5 mg cm−2. The same steps are also followed for ZnS, CoS, and ZnCoS/rGO.Fabrication of ZnCoS@rGO//AC@PANI
To examine the practical applications of ZnCoS/rGO, an ASC device is assembled using ZnCoS/rGO as an anode, and PANI-doped AC as a cathode. The electrochemical measurement is performed in a 3 M KOH solution. For the electrode preparation, carbon black and PVDF binder are used to make a homogeneous solution. The suspension is drop-coated uniformly over a clean nickel foam (NF) 1.5 cm × 1.5 cm and placed inside the oven at 70 °C overnight. The activated carbon@PANI (AC@PANI) is used to ensure the complete coverage of both nickel foam (NF) sides. The process is shown in Fig. S1.†Results and discussion
Structure and surface morphology
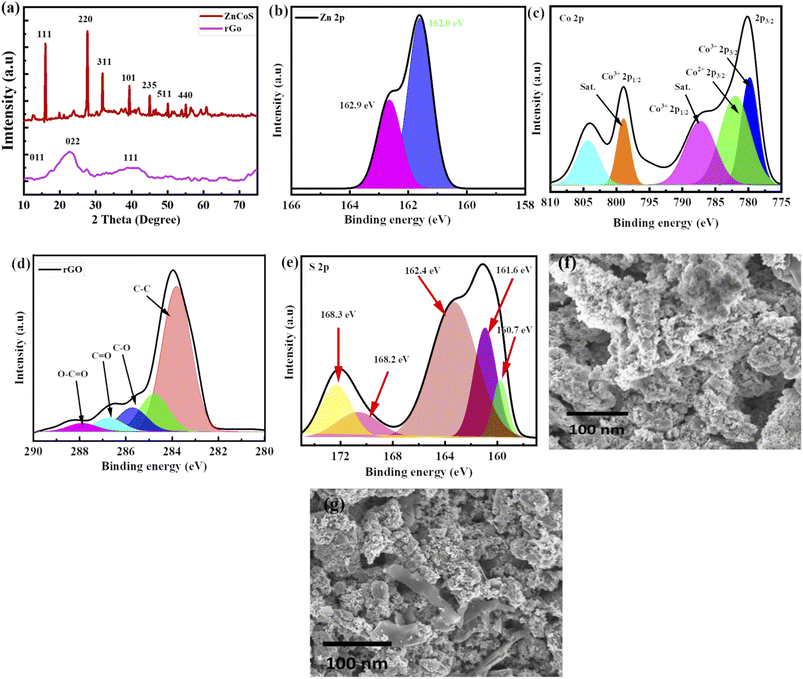
Material crystalline nature is obtained by using XRD (X-ray diffraction), as revealed in Fig. 2(a) and XRD peaks appeared at (111), (220), (311), (331), (101), (235), (511) and (440) planes which are correlated to JCPDS card no. 47-1656. No more XRD peaks are found, showing the purity of zinc-cobalt sulfide (ZnCoS). In the case of rGO, a broad peak at 25.4° formed, matching the (002) plane, while a smaller peak occurred at 43.6°, matching the (111) plane.56 Zn 2p spectra are shown in Fig. 2(b) at 162.9 eV and 162.0.57 Fig. 2(c) shows the XPS spectra of cobalt core peaks (Co 2p3/2 and Co 2p1/2).58 The first core peak is de-convoluted into two peaks at 803.3 and 798.8 eV: Co2+ 2p3/2 and Co3+ 2p3/2. The Co2+ 2p1/2 and Co3+ 2p1/2 peaks are de-convoluted at 786.6 eV and 778.8 eV, correspondingly.59,60 The Co–S bond is represented by the two primary peaks of Co2+ and Co3+. 61–63 There are two shake-up satellite peaks because of repeated electron excitation of Co2+ and Co3+ in cobalt sulfide.Fig. 2(d) shows XPS spectra for rGO corresponding to the 284.4 eV peak, which is the most common.64 Fig. 2(e) shows the XPS spectra of S 2p, which show that sulfur exists in several different chemical states. Sulfide (S 2p) peaks at 160.7 eV, 161.6 eV, and 162.4 eV, and sulfate (S6+) peaks at 168.2 eV and 168.3 eV are attributed to different sulfate species.
The synthesised process and morphological changes of the synthesised material zinc sulfide, cobalt sulfide, and the composite sample ZnCoS on nickel foam are examined by conducting time-dependent experiments. The zinc sulfide, cobalt sulfide, and composite samples are synthesised at 150 °C for 8 hours to understand the growth process of Ni-foam (NF). The reaction time dramatically affects the shape of materials. SEM image of ZnCoS, shown in Fig. 2(f). Most of the nanoparticles have a uniform flower-like morphology across each particle. SEM image of ZnCoS/rGO is shown in the Fig. 2(g), which show the clear flake of rGO.
Electrochemical performance
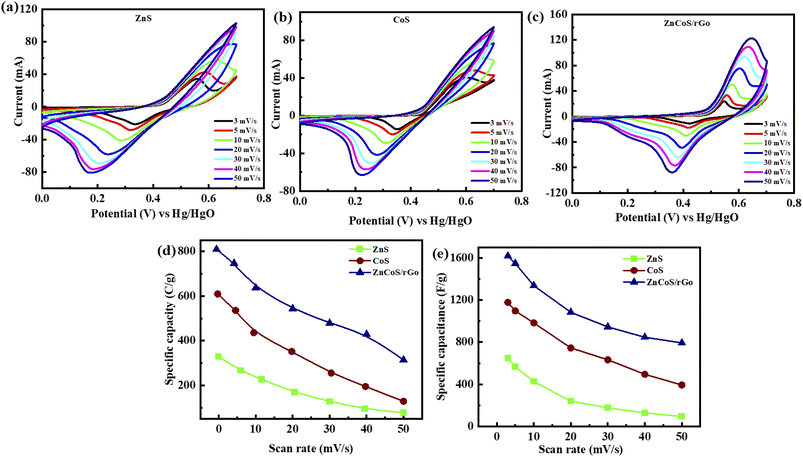
The synthesised zinc sulfide, cobalt sulfide, and composite sample electrodes are examined for electrochemical performance in a three-electrode assembly. The synthesised material's CV curves show the electrode material's oxidation/reduction behaviour. To examine CV measurements at several scan rates for all materials are taken at the potential window (0–0.7 V) in a 3 molar solution of KOH.However, the specific capacity (Qs) of the binary composite electrode refers to the zinc sulfide (ZnS)65 and cobalt sulfide (CoS) transitions reversible faradaic redox techniques related with (OH−) anions,66 as presented by the subsequent equations,67
| CoS + OH− ↔ CoSOH + e | (1) |
| CoSOH + OH− ↔ CoSO + H2O + e− | (2) |
| ZnS + OH− ↔ ZnSOH + e− | (3) |
As scan rates enlarged, the current density is even increased steadily. The shift in cathode peaks and anodic peaks to the negative and positive direction, respectively, show the fast redox reactions and the comparatively low resistance of the electrodes. Fig. 3(a and b) represented the CV curves of zinc sulfide (ZnS) and cobalt sulfide (CoS) at several scan rates and showed similar faradaic characteristics. All the prepared samples showed almost symmetrical CV curves, suggesting the reversible redox reaction, fast ion transport, and high-rate capability. ZnS and CoS are blended using a 90/10 ratio with rGO to improve the whole efficiency of the electrode shown in Fig. 3(c). For all the synthesised electrodes, the specific capacity is calculated with the following equation,
 | (4) |
Specific capacitance calculated for ZnS, CoS, and ZnCoS/rGO is 606 F g−1, 1178 F g−1, and 1618 F g−1, respectively, shown in Fig. 3(e). ZnCoS/rGO has a higher specific capacitance value when mixed with cobalt, and it also has a nanoparticle-like shape, a larger surface area, and more excellent electric conductivity. Therefore, the movement of electrons and ions is relatively easier from an electrolyte to the surface. This form of charge transfer resulted from a redox reaction during the charging and discharging procedure.71
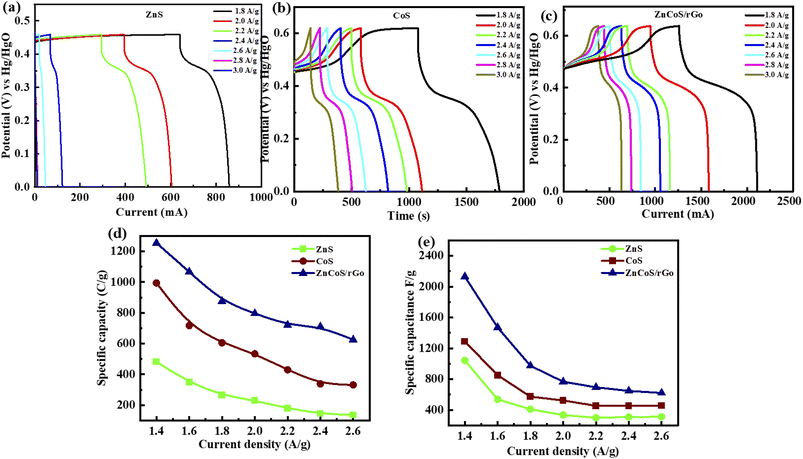
Galvanostatic charge–discharge (GCDs) analysis further scrutinised the electrochemical performance of synthesised nanomaterial. The calculations are accomplished at various current density values using an electrolyte of 3 M KOH. Fig. 4(a–c) illustrates the GCD curves for ZnS, CoS, and ZnCoS/rGO that are measured at various current densities of 1.8 to 3 A g−1. The non-triangular charge–discharge behaviour of all the GCD materials illustrates reversible redox reactions. This reversible reaction is essential for charge storage mechanisms homologous to battery-grade material. Specific capacity in eqn (5) is the specific capacity from GCD curves of all the electrodes with the following relations:72 the specific capacity using the CV and GCS measurements for individually ZnS, CoS, and ZnCoS are further calculated and shown in Fig. S2–S3.†
 | (5) |
The specific capacitance is also obtained from these GCD curves. Fig. 4(e) shows the comparison of Qs of ZnS, CoS, and ZnCoS/rGO at 1.8 A g−1. The capacitance value decreased as the current density increased. The maximum specific capacitance found from the calculated values for zinc sulfide (ZnS), cobalt sulfide (CoS), and composite material zinc cobalt sulfide with 90/10% weight ratio of rGO (ZnCoS/rGO) is 800 F g−1, 1951 F g−1, and 2508 F g−1.
The three-electrode assembly measurements showed that composite material ZnCoS/rGO has higher electrochemical measurements than other fabricated electrodes. The following bases may result from the enhanced working of the composite material ZnCoS/rGO. Firstly, the binder and carbon caused the dead volume, which is avoided by the direct growth of the composite material electrode on nickel foam. By this, the amount of electroactive spots increases throughout the electrochemical process. Secondly, the maximum interfacial contact is present between the substrate and electrode material due to the directly grown electrode material on nickel foam, therefore carrying of the electron is enhanced, which leads to the maximum capability rate. Thirdly, the balanced growth of material on nickel foam provided a productive path for carrying electrons and ions, which enhanced the rate capability and specific capacitance.
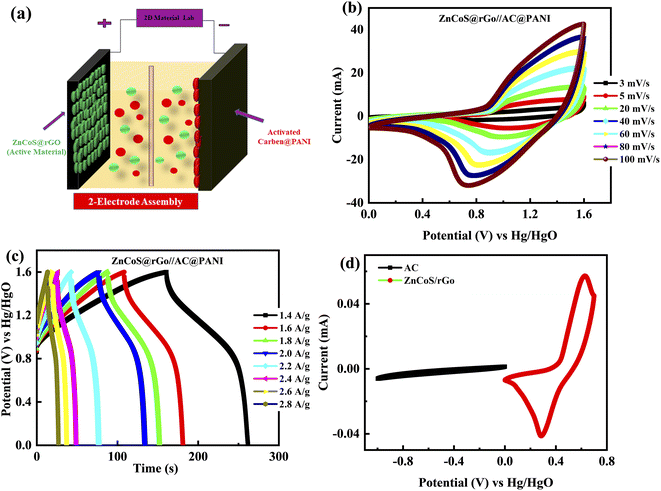
Due to the high-quality performance of the composite material ZnCoS/rGO, the composite material is investigated for practical (real device) applications. The asymmetric supercapattery device is fabricated using the negative electrode of the activated carbon (AC) and the positive electrode of the composite material. In the fabrication of a real device, both electrodes (5.0 mg cm−2 for activated carbon and 3.0 mg cm−2 for composite material) with a different active material mass per unit area were used to retain the charge balance.73–75 The ions of electrolytes are transported by channels, which are provided by a porous membrane (used as a separator between the electrodes). The fabricated supercapattery device is diagrammatically demonstrated in Fig. 5(a).
Fig. 5(b and c) illustrates the electrochemical performance results for the ZnCoS@rGO//AC@PANI electrode. For this primarily, the CV is measured at 3 mV s−1 in three-electrode fabrication for composite material ZnCoS/rGO and activated carbon@PANI (AC@PANI) separately, as illustrated in Fig. 5(d). Subsequently, two-electrode fabrication for ZnCoS@rGO//AC@PANI is prescribed in a 3 molar solution of (KOH) and calculated the CV measurements at different scan rates. The capacitive nature is indicated by the non-appearance of redox peaks curves from (0–0.5 V) potential value and the formation of pseudo rectangular CV curves. Initially, when the potential value is enhanced, redox peaks appeared to reveal the presence of faradaic reactions. The combined effect of faradaic and non-faradaic reactions manifested by the fabricated ASC device is because of the faradaic nature exhibited by the composite electrode and the non-faradaic behaviour exhibited by the double-layer capacitor (DLC) capacitance of the activated carbon (AC) electrode. Further, the GCD of the device is also performed at various In Fig. S4–S5† the specific capacity analyses for ZnS, CoS, and ZnCoS/rGo by using CV and GCD curves for real device application at a scan rate from 3 mV s−1 to 100 mV s−1 and different current densities from 1.4 A g−1 to 2.8 A g−1 are shown. A comparison of ZnCoS and ZnCoS@rGo for real device applications for CV and GCD measurements is shown in Fig. S6.†
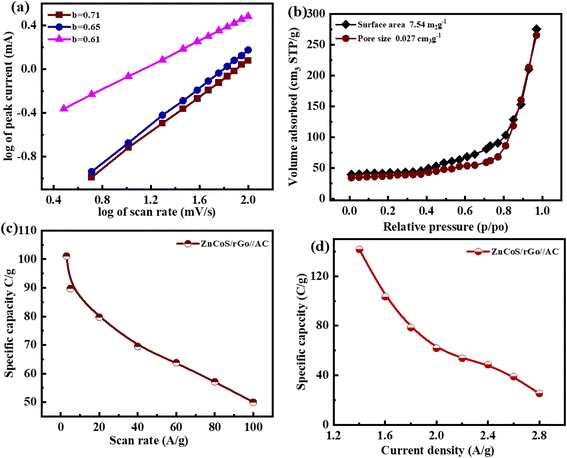
The b-values calculated for this ASC device are represented in Fig. 6(a). The range for the battery and supercapacitors of b-values lies in 0–0.5 and 0.8–1.0, respectively. While for supercapattery, the range of b-values lies between 0.5–0.8; this range lies between the batteries and the supercapacitors' b-values.76 So computed b-values are in the range of supercapattery b-values. So, the charge storing mechanism in this ASC device is due to the charge adsorption/desorption and faradaic reactions. Consequently, we can say that charge adduction/desorption and faradaic processes contributed to the charge stored in this device. According to Brunauer–Emmett–Teller,54 the surface area of electrode materials (ZnCoS/rGO) is 7.54 m2 g−1, and the pore size volume is 0.023 cm3 g−1, as shown in Fig. 6(b). The combined action of zinc sulfide and copper sulfide in a bimetallic tungstate increases surface area and pore size dispersion. So ZnCoS/rGO material has a high surface area and a uniform pore size distribution. The pore size volume and the surface area for ZnS are 0.002 cm3 g−1,2.04 m2 g−1, for CoS are 0.002 cm3 g−1 and 2.04 m2 g−1, and for ZnCoS the surface area and pore size volume are 0.002 cm3 g−1, 5.40 m2 g−1 shown in the Fig. S7.†
By the CV and GCD, the specific capacity and specific capacitance of the asymmetric supercapattery fabrication (ASC device) are also calculated. The specific capacity for the asymmetric supercapattery device by considering the CV and GCD measurements is displayed in Fig. 6(c and d). The specific capacity value calculated by the CV measurements at 3 mV s−1 for this ASC device is 101 C g−1. However, considering the GCD measurements, the specific capacity value at a 1.4 A g−1 current density for this ASC device is 141 C g−1. The b values of any device are used to estimate the charge-storage mechanism.
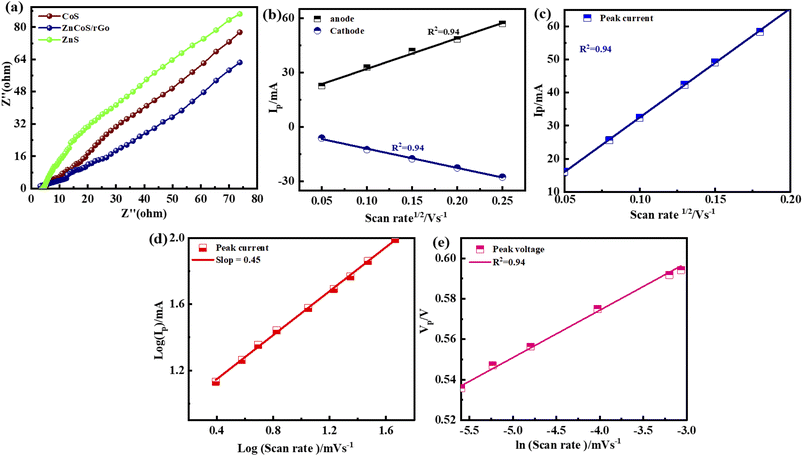
The crossing point on the real axis at higher frequencies shows the electrode materials' ESR (equivalent series resistance). The electrical resistance or ESR value will be larger if they have a lesser electrical conductivity. Fig. 7(a) represents the comparable ESR value of the material by using EIS. This shows ZnCoS/rGO have the smallest value compared to the other samples. Sample ZnCoS/rGO has the highest level of interaction between zinc sulfide and cobalt sulfide because it has the lowest equivalent series resistance value compared to both samples. Because its Rct value is lower than other materials, ZnCoS/rGO attribute to have improved charge transmission. The ESR value for ZnCoS@rGo, ZnS, CoS, and ZnCoS are 0.94 Ω, 1.67 Ω, 12.8 Ω and, 1.15 Ω shown in Fig. S8.†
The charge storage diffusion properties of the ZnCoS/rGO composite are depicted by the linear connection between the anodic and cathodic peaks in Fig. 7(b). The Randles–Sevcik formula, which describes the maximum current outputs for processes governed by reversible diffusion, is used to determine the charge storage mechanism,77
 | (6) |
Charging–discharging behaviour of a ZnCoS/rGO electrode at various cycle numbers is measured by using the GCD curve. The present study on potential windows exposes the door to observing the charging–discharging pattern through the applied potential (start and finish for the initial and final applied voltage) for the 2000th GCD cycle. The device has an extremely high level of consistency during the entire charging and discharging procedures. No voltage loss is noticed at the start of the charging-discharging cycles, as shown in Fig. 8(a). At 400 charging-discharging cycles, no voltage is a drop, so no IR drop is shown in Fig. 8(b). Same as in previous cycles, at 700 cycles, there is no voltage drop, as represented in Fig. 8(c). Nevertheless, a voltage decrease is observed after 2000 cycles when the number of cycles increases. The voltage drop is around 0.65 V after 1000–2000 cycles, shown in Fig. 8(d), and there is no noticeable rise after 2000 cycles, as seen in Fig. 8(e).
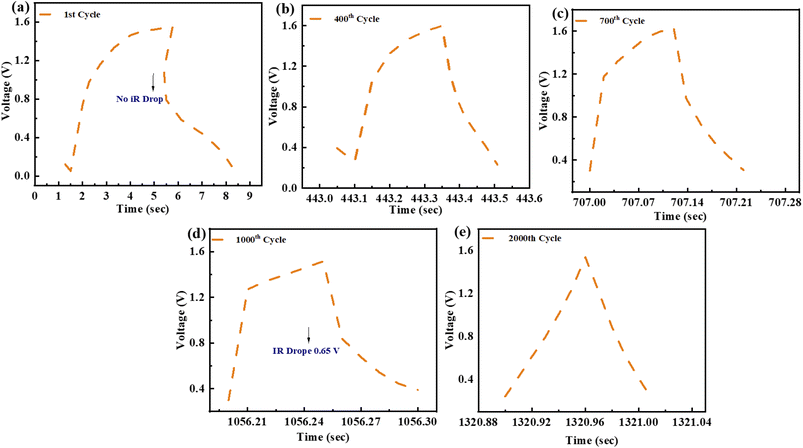 | ||
| Fig. 8 (a) GCD profile for 1st cycle (b) 400th cycle for GCD testing. (c) GCD testing of 700th cycle (d) GCD pattern for 1000th cycle (e) GCD pattern of 2000th cycle. | ||
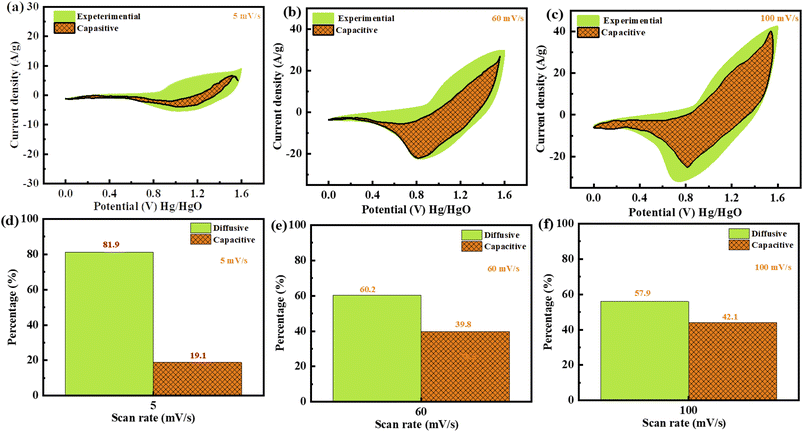
The device's CV profiles are also analysed in detail to learn more about the charge storage system. Applying a model presented by Dunn and coworkers to the CV curves gives the following equation, which describes the relationship between the current density I at a given voltage and the two components of the scan rates ‘v’.43–45,79–81
| i(v) = k1v + k2v0.5 | (7) |
 | (8) |
Plotting  as a function of v0.5 yields the values for the constants k1 and k2, while the slope and y-intercept of the previous equation provide the values for k1 and k2, respectively. The current output of the capacitive and diffusive system at a scan rate of 5 mV s−1, 60 mV s−1, and 100 mV s−1 is represented in Fig. 9(a–c). The orange region shows the capacitive effect on the CV curve. Fig. 9(d–f) shows the percentages of capacitance and diffusivity as bar plots for various scan rates, including 5, 60, and 100 mV s−1. At the lower scan rate of 5 mV s−1, the capacitance effect of 19.1% is negligible compared to the diffusive component of 81.9%. Rising the scan rate increases the capacitive impact but decreases the diffusive impact. At the maximum scan rate of 100 mV s−1, the capacitive value is 42.1%, while the diffusive value is measured at 57.9%. This indicates that at a reduced scan rate, the positive electrode (battery grade) has sufficient time to accomplish the redox process and a greater diffusive impact on the whole device's capacity. The capacitive type (negative) electrode has enough opportunity to adsorb charges at the electrode/electrolyte surface at higher scan rates, resulting in an immense capacitive influence on overall device efficiency.
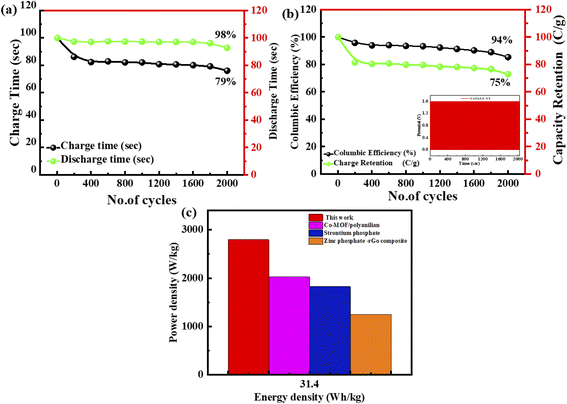
The cyclic stability of this ASC device (supercapattery) is also evaluated by performing the lifespan test. This fabricated ASC device functioned for 2000 charging-discharging cycles. The current density all the time while performing the test is sustained. The time calculated for 2000 cycles of charging–discharging is demonstrated in Fig. 10(a). The specific capacity of this ASC device is maintained at 98% after completing 2000 cycles of charging/discharging, as represented by the green spots line. Furthermore, the coulombic efficiency is 94%, demonstrated by the green colour curve in Fig. 10(b).
The energy and power density are essential for estimating energy storage device performance. The energy density and power density are estimated by using the following equations;82
 | (9) |
 | (10) |
Conclusion
In this work, the composite material ZnCoS/rGO was synthesised via a hydrothermal. The formation of zinc cobalt sulfide (ZnCoS) has been proven by the peaks perceived in XRD. The morphology of the synthesised material (ZnCoS/rGO) was indicated by the SEM images. The Cs of the devices found from GCD analyses for ZnS, CoS, ZnCoS, and ZnCoS@rGO were 800 F g−1, 1951 F g−1, and 2508 F g−1, respectively. In two-electrode ASC fabrication (ZnCoS@rGO//AC@PANI), the specific capacity calculated by the CV measurements was 101 C g−1. However, for the GCD measurements, the specific capacity value at a 1.6 A g−1 current density was 141 C g−1. The maximum energy density attained by the ASC device was 45 W h kg−1 with a power density value of 5000 W kg−1 at 1.4 A g−1. The specific capacity was maintained at 98% after completing 2000 cycles of charging/discharging, and the coulombic efficiency was 94%. Therefore, ZnCoS/rGO has marvelous performance for energy storage devices and can perform well acting as an electrode material for asymmetric ASC devices.Conflicts of interest
There are no conflicts to declare.Acknowledgements
This work was funded by the Researchers Supporting Project Number (RSPD2023R664) King Saud University, Riyadh, Saudi Arabia.References
- P. Simon and Y. Gogotsi, in Nanoscience and technology: a collection of reviews from Nature journals, World Scientific, 2010, pp. 320–329 Search PubMed.
- J. R. Miller and P. Simon, Science, 2008, 321, 651–652 CrossRef CAS.
- G. Wang, L. Zhang and J. Zhang, Chem. Soc. Rev., 2012, 41, 797–828 RSC.
- R. Mukherjee, R. Krishnan, T.-M. Lu and N. Koratkar, Nano Energy, 2012, 1, 518–533 CrossRef CAS.
- C. Lamiel, I. Hussain and J.-J. Shim, Energy, 2017, 140, 901–911 CrossRef CAS.
- B. E. Conway, Electrochemical supercapacitors: scientific fundamentals and technological applications, Springer Science & Business Media, 2013 Search PubMed.
- M. Hanna and A. Nozik, J. Appl. Phys., 2006, 100, 074510 CrossRef.
- H.-L. Zhu and Y.-Q. Zheng, Electrochim. Acta, 2018, 265, 372–378 CrossRef CAS.
- X. Li, M. Zhang, L. Wu, Q. Fu and H. Gao, J. Alloys Compd., 2019, 773, 367–375 CrossRef CAS.
- H. Si, L. Sun, Y. Zhang, Y. Zhang, L. Bai and Y. Zhang, Dalton Trans., 2019, 48, 285–295 RSC.
- X. Li, Y. Qiao, C. Wang, T. Shen, X. Zhang, H. Wang, Y. Li and W. Gao, J. Alloys Compd., 2019, 770, 803–812 CrossRef CAS.
- W. Qiu, H. Xiao, M. Yu, Y. Li and X. Lu, Chem. Eng. J., 2018, 352, 996–1003 CrossRef CAS.
- C. Lamiel, D. R. Kumar and J.-J. Shim, Chem. Eng. J., 2017, 316, 1091–1102 CrossRef CAS.
- G. Huang, S. Xu, S. Lu, L. Li and H. Sun, Electrochim. Acta, 2014, 135, 420–427 CrossRef CAS.
- W. Yang, Z. Gao, J. Ma, X. Zhang, J. Wang and J. Liu, J. Mater. Chem. A, 2014, 2, 1448–1457 RSC.
- L. Yu, G. Zhang, C. Yuan and X. W. D. Lou, Chem. Commun., 2013, 49, 137–139 RSC.
- M. Yu, J. Chen, Y. Ma, J. Zhang, J. Liu, S. Li and J. An, Appl. Surf. Sci., 2014, 314, 1000–1006 CrossRef CAS.
- C. Yuan, L. Su, B. Gao and X. Zhang, Electrochim. Acta, 2008, 53, 7039–7047 CrossRef CAS.
- R. Zou, M. F. Yuen, Z. Zhang, J. Hu and W. Zhang, J. Mater. Chem. A, 2015, 3, 1717–1723 RSC.
- M. Chhowalla, H. S. Shin, G. Eda, L.-J. Li, K. P. Loh and H. Zhang, Nat. Chem., 2013, 5, 263–275 CrossRef PubMed.
- M.-R. Gao, Y.-F. Xu, J. Jiang and S.-H. Yu, Chem. Soc. Rev., 2013, 42, 2986–3017 RSC.
- Q. Wu, Y. Xu, Z. Yao, A. Liu and G. Shi, ACS Nano, 2010, 4, 1963–1970 CrossRef CAS PubMed.
- S. Dhibar and C. K. Das, J. Alloys Compd., 2015, 653, 486–497 CrossRef CAS.
- Z. Gao, W. Yang, J. Wang, H. Yan, Y. Yao, J. Ma, B. Wang, M. Zhang and L. Liu, Electrochim. Acta, 2013, 91, 185–194 CrossRef CAS.
- A. R. John and P. Arumugam, J. Power Sources, 2015, 277, 387–392 CrossRef CAS.
- Z. Niu, J. Chen, H. H. Hng, J. Ma and X. Chen, Adv. Mater., 2012, 24, 4144–4150 CrossRef CAS PubMed.
- Q. Xu, X. Yu, Q. Liang, Y. Bai, Z.-H. Huang and F. Kang, J. Electroanal. Chem., 2015, 739, 84–88 CrossRef CAS.
- J. Jiang, Y. Li, J. Liu, X. Huang, C. Yuan and X. W. D. Lou, Adv. Mater., 2012, 24, 5166–5180 CrossRef CAS PubMed.
- X. Lu, M. Yu, G. Wang, Y. Tong and Y. J. E. Li, Science, 2014, 7, 2160–2181 Search PubMed.
- Y. Wang, D. Yang, J. Lian, T. Wei and Y. Sun, J. Alloys Compd., 2018, 741, 527–531 CrossRef CAS.
- C. Xiao, X. Zhang and D. R. MacFarlane, Electrochim. Acta, 2018, 280, 55–61 CrossRef CAS.
- D. Song, J. Zhu, J. Li, T. Pu, B. Huang, C. Zhao, L. Xie and L. Chen, Electrochim. Acta, 2017, 257, 455–464 CrossRef CAS.
- P. Zhao, X. Ye, Y. Zhu, H. Jiang, L. Wang, Z. Yue, Z. Wan and C. Jia, Electrochim. Acta, 2018, 281, 717–724 CrossRef CAS.
- T.-H. Ko, S. Radhakrishnan, M.-K. Seo, M.-S. Khil, H.-Y. Kim and B.-S. Kim, J. Alloys Compd., 2017, 696, 193–200 CrossRef CAS.
- J. Wei, Z. Zang, Y. Zhang, M. Wang, J. Du and X. Tang, Opt. Lett., 2017, 42, 911–914 CrossRef CAS PubMed.
- Y. Zhang, S. Liu, Y. Ji, J. Ma and H. Yu, Adv. Mater., 2018, 30, 1706310 CrossRef.
- H. You, L. Zhang, Y. Jiang, T. Shao, M. Li and J. Gong, J. Mater. Chem. A, 2018, 6, 5265–5270 RSC.
- H. Zhaodong, Z. Rong, Z. Shaoce, L. Pei, L. Chuan and Z. Chunyi, Mater. Futures, 2022, 1, 022101 CrossRef.
- M. Ali, A. M. Afzal, M. W. Iqbal, A. Ur Rehman, S. M. Wabaidur, E. A. Al-Ammar, S. Mumtaz and E. H. Choi, FlatChem, 2023, 40, 100518 CrossRef CAS.
- N. Muzaffar, A. M. Afzal, H. H. Hegazy and M. W. Iqbal, J. Energy Storage, 2023, 64, 107142 CrossRef.
- K. Yousefipour, R. Sarraf-Mamoory and S. Mollayousefi, RSC Adv., 2022, 12, 27868–27876 RSC.
- K. Yousefipour, R. Sarraf-Mamoory and A. J. C. Yourdkhani, Colloids Surf., A, 2022, 647, 129066 CrossRef CAS.
- H. Tong, W. Bai, S. Yue, Z. Gao, L. Lu, L. Shen, S. Dong, J. Zhu, J. He and X. Zhang, J. Mater. Chem. A, 2016, 4, 11256–11263 RSC.
- M. Y. Lu, M.-P. Lu, Y.-A. Chung, M.-J. Chen, Z. L. Wang and L.-J. Chen, J. Phys. Chem. C, 2009, 113, 12878–12882 CrossRef CAS.
- L. Yu, L. Zhang, H. B. Wu, G. Zhang and X. W. D. J. E. Lou, Science, 2013, 6, 2664–2671 CAS.
- L. Huang, D. Chen, Y. Ding, S. Feng, Z. L. Wang and M. Liu, Nano Lett., 2013, 13, 3135–3139 CrossRef CAS PubMed.
- J. Xiao, X. Zeng, W. Chen, F. Xiao and S. Wang, Chem. Commun., 2013, 49, 11734–11736 RSC.
- A. Yasmeen, A. M. Afzal, M. W. Iqbal, A. Zaka, H. u. Hassan, T. Abbas, M. Usman, L. Wang, Y. M. Alanazi and S. Mumtaz, J. Electrochem. Energy Convers. Storage, 2024, 21, 021002 CrossRef.
- S. Sahoo, R. Mondal, D. J. Late and C. S. J. M. Rout, Materials, 2017, 244, 101–108 CAS.
- S. Peng, L. Li, C. Li, H. Tan, R. Cai, H. Yu, S. Mhaisalkar, M. Srinivasan, S. Ramakrishna and Q. Yan, Chem. Commun., 2013, 49, 10178–10180 RSC.
- Q. Liu, J. Jin and J. Zhang, ACS Appl. Mater. Interfaces, 2013, 5, 5002–5008 CrossRef CAS PubMed.
- Y. Zhang, Q. Zhou, J. Zhu, Q. Yan, S. X. Dou and W. Sun, Adv. Funct. Mater., 2017, 27, 1702317 CrossRef.
- W. S. Hummers Jr and R. E. Offeman, J. Am. Chem. Soc., 1958, 80, 1339 CrossRef.
- H. Saleem, M. Haneef and H. Y. Abbasi, Mater. Chem. Phys., 2018, 204, 1–7 CrossRef CAS.
- M. P. Lavin-Lopez, A. Paton-Carrero, L. Sanchez-Silva, J. L. Valverde and A. Romero, Adv. Powder Technol., 2017, 28, 3195–3203 CrossRef CAS.
- R. K. Gautam, H. Bhattacharjee, S. Venkata Mohan and A. Verma, RSC Adv., 2016, 6, 110091–110101 RSC.
- A. U. Rehman, A. M. Afzal, M. W. Iqbal, M. Ali, S. M. Wabaidur, E. A. Al-Ammar, S. Mumtaz and E. H. Choi, J. Energy Storage, 2023, 71, 108022 CrossRef.
- W. Yuan, S. Wang, Y. Ma, Y. Qiu, Y. An and L. Cheng, ACS Energy Lett., 2020, 5, 692–700 CrossRef CAS.
- M. Imran, A. M. Afzal, M. W. Iqbal, H. H. Hegazy, M. Z. Iqbal, S. Mumtaz and R. Qureshi, Mater. Sci. Semicond. Process., 2023, 158, 107366 CrossRef CAS.
- K. Zhu, C. Jin, Z. Klencsár, A. S. Ganeshraja and J. Wang, Catalysts, 2017, 7(5), 138 CrossRef.
- Z. Kang, C. Wu, L. Dong, W. Liu, J. Mou, J. Zhang, Z. Chang, B. Jiang, G. Wang, F. Kang and C. Xu, ACS Sustainable Chem. Eng., 2019, 7, 3364–3371 CrossRef CAS.
- P. Faguy, N. Markovic, R. Adzic, C. Fierro and E. J. J. o. e. c. Yeager, Electrochemistry, 1990, 289, 245–262 CAS.
- Y. Li, L. Hu, W. Zheng, X. Peng, M. Liu, P. K. Chu and L. Y. S. Lee, Nano Energy, 2018, 52, 360–368 CrossRef CAS.
- S. D. Gardner, C. S. K. Singamsetty, G. L. Booth, G.-R. He and C. U. Pittman, Carbon, 1995, 33, 587–595 CrossRef CAS.
- A. Agresti, A. Pazniak, S. Pescetelli, A. Di Vito, D. Rossi, A. Pecchia, M. Auf der Maur, A. Liedl, R. Larciprete and D. V. Kuznetsov, Nat. Mater., 2019, 18, 1228–1234 CrossRef CAS PubMed.
- Y. Wen, S. Peng, Z. Wang, J. Hao, T. Qin, S. Lu, J. Zhang, D. He, X. Fan and G. Cao, J. Mater. Chem. A, 2017, 5, 7144–7152 RSC.
- J. A. Syed, J. Ma, B. Zhu, S. Tang and X. Meng, Adv. Energy Mater., 2018, 8, 1800106 CrossRef CAS.
- M. Z. Iqbal, M. M. Faisal, S. R. Ali, S. Farid and A. M. Afzal, Electrochim. Acta, 2020, 346, 136039 CrossRef CAS.
- M. Z. Iqbal, M. M. Faisal, S. R. Ali, A. M. Afzal, M. R. Abdul Karim, M. A. Kamran and T. Alharbi, Ceram. Int., 2020, 46, 10203–10214 CrossRef CAS.
- M. Z. Iqbal, M. M. Faisal, S. R. Ali and A. M. Afzal, J. Electroanal. Chem., 2020, 871, 114299 CrossRef CAS.
- M. F. Iqbal, H. Mahmood Ul, M. N. Ashiq, S. Iqbal, N. Bibi and B. Parveen, Electrochim. Acta, 2017, 246, 1097–1103 CrossRef CAS.
- K. Xu, W. Li, Q. Liu, B. Li, X. Liu, L. An, Z. Chen, R. Zou and J. Hu, J. Mater. Chem. A, 2014, 2, 4795–4802 RSC.
- M. Z. Iqbal, S. S. Haider, S. Zakar, M. Alzaid, A. M. Afzal and S. J. M. R. B. Aftab, 2020, 131, 110974.
- J. Feng, N. A. Chernova, F. Omenya, L. Tong, A. C. Rastogi and M. J. J. o. S. S. E. Stanley Whittingham, 2018, 22, 1063–1078.
- S. Dsoke, B. Fuchs, E. Gucciardi and M. J. J. o. P. S. Wohlfahrt-Mehrens, 2015, 282, 385–393.
- M. Z. Iqbal, J. Khan, S. Siddique, A. M. Afzal and S. Aftab, Int. J. Hydrogen Energy, 2021, 46, 15807–15819 CrossRef CAS.
- N. Neghmouche and T. J. I. L. o. C. Lanez, Physics and Astronomy, 2013, 4, 37–45 Search PubMed.
- P. Kissinger and W. R. Heineman, Laboratory Techniques in Electroanalytical Chemistry, revised and expanded, CRC press, 2018 Search PubMed.
- S.-B. Xia, S.-W. Yu, L.-F. Yao, F.-S. Li, X. Li, F.-X. Cheng, X. Shen, C.-K. Sun, H. Guo and J.-J. Liu, Electrochim. Acta, 2019, 296, 746–754 CrossRef CAS.
- A. M. Afzal, T. Ejaz, M. W. Iqbal, B. S. Almutairi, M. Imran, A. Manzoor, H. H. Hegazy, A. Yasmeen, A. Zaka and T. Abbas, ChemistrySelect, 2023, 8, e202300440 CrossRef CAS.
- H.-L. Girard, B. Dunn and L. Pilon, Electrochim. Acta, 2016, 211, 420–429 CrossRef CAS.
- S. Sahoo, S. Zhang and J.-J. Shim, Electrochim. Acta, 2016, 216, 386–396 CrossRef CAS.
- W. Ma, H. Nan, Z. Gu, B. Geng and X. Zhang, J. Mater. Chem. A, 2015, 3, 5442–5448 RSC.
Footnote |
| † Electronic supplementary information (ESI) available. See DOI: https://doi.org/10.1039/d3ra02792a |
| This journal is © The Royal Society of Chemistry 2023 |

