 Open Access Article
Expanded vermiculite supported capric–palmitic acid composites for thermal energy storage
Ruixue Baia,
Songyang Liu *ab,
Jie Hanab,
Mengqing Wanga,
Wei Gaoa,
Dapeng Wuc and
Meng Zhoua
aSchool of Civil Engineering, Liaoning Petrochemical University, Fushun 113001, China
bLiaoning Key Lab of Petro-chemical Special Building Materials, Liaoning Shihua University, Fushun 113001, China. E-mail: liusongyanglnsh@163.com
cCollege of Science, Liaoning Petrochemical University, Fushun 113001, China
First published on 9th June 2023
Abstract
In this study, the potential application of expanded vermiculite (EVM) as the supporting material and capric–palmitic acid (CA–PA) binary eutectic as the adsorbent mixture to fabricate a form-stable composite CA–PA/EVM by a vacuum impregnation method was investigated. The prepared form-stable composite CA–PA/EVM was then characterized by scanning electronic microscopy (SEM), Fourier transform infrared spectroscopy (FT-IR), X-ray diffraction (XRD), thermogravimetric analysis (TG), differential scanning calorimetry (DSC) and a thermal cycling test. The maximum loading capacity and melting enthalpy of CA–PA/EVM could reach 51.84% and 67.5 J g−1. Meanwhile, the thermal physical and mechanical properties of the CA–PA/EVM-based thermal energy storage mortars were examined to determine if the composite material based on the newly invented CA–PA/EVM material can be employed for energy conservation and efficiency in the building field. In addition, the law of full-field deformation evolution of CA–PA/EVM-based thermal energy storage mortar under uniaxial compression failure was studied based on digital image correlation (DIC) technology, which provides certain guiding significance for the application of CA–PA/EVM-based thermal energy storage mortars in practical engineering.
1. Introduction
With the continuous improvement of people's quality of living, energy consumption has increased day by day in recent years. The forthcoming global energy crisis has brought about worldwide attention. Furthermore, the reduction of traditional fuels generates an energy crisis, and the combustion of traditional fuel causes the greenhouse effect, which poses a significant threat to people's existing environment. In this grim situation, considerable research for years has focused on incorporating phase change materials (PCMs) into building materials to achieve the purpose of energy saving and heat transfer enhancement.1,2 Incorporating PCMs into building materials with stable shapes has been widely taken into consideration in recent years.The PCM is a new type of functional material that absorb or release a large amount of energy by changing form and keeping its temperature unchanged. It has a good foreground in the application of building energy conservation, solar energy utilization, heat recovery, temperature control, battery thermal management, and other fields.3–7 According to phase change states, PCMs are generally divided into three categories: solid–liquid PCMs, solid–solid PCMs, and liquid–gas PCMs. Compared with solid–solid PCMs with low latent heat and liquid–gas PCMs with large volume change during phase transition, solid–liquid PCMs have been widely used in latent heat storage due to their high latent heat, low undercooling, nontoxicity, and good thermal stability.8–12 However, the leakage in the process of transforming from solid state to liquid state restricts the wide application of PCMs in the building envelope. To overcome this shortcoming, impregnating porous structural materials with PCMs has been proved to be a practical and effective method, such as diatomite,13–16 kaolin,17–19 montmorillonite,20–22 expanded perlite,23–26 and so on. Significantly, EVM has a unique unit layer structure and abundant pore channels, which is inexpensive and readily available, coupled with its characteristic of excellent chemical compatibility with organic PCMs such as fatty acids, has become an ideal candidate for the fields of solar energy utilization and load.27–29 Zhang et al.30 modified EVM by in situ carbonization to adsorb SA, and revealed through XRD and FT-IR analysis that the interaction between SA and EVM was a simple physical loading without any chemical reaction. EVM can be used as a good support matrix for thermal storage. Wen et al.31 studied the thermal properties of CA–LA/EVM and the results showed that the composite PCM still had a good structural form after 200 phase change cycles, which could effectively prevent the leakage of phase change material. Numerous studies have shown that EVM is a good candidate material for the heat storage system.
In addition, several scholars have achieved significant advances in scientific theory and engineering practice in the development of energy storage building materials using porous-based composite PCMs as the primary raw materials.32,33 Liu et al.34 added the binary eutectic hydrate salt/expanded graphite of finalized composite PCM into the mortar. Although the compressive strengths of energy storage mortar are observably reduced in comparison with that of Ordinary cement mortar, the 28 day compressive strength of the thermal storage mortar with the composite PCM content of 13.3wt% still reaches 11.5 MPa. Abden et al.35 prepared composite PCM gypsum board with SA/diatomite as raw material. The result shows that the average 3 day drop of peak temperature in a laboratory scale is 3.5 °C, indicating that energy storage gypsum board can effectively improve the indoor thermal environment. Ren et al.36 prepared electric energy storage concrete by adding carbon nanofibers based on LA–MA–PA/ceramsite PCM. The maximum increase of conductivity is 15% and the internal temperature is significantly reduced, which is conducive to peak shaving and valley filling of electric heating buildings. It can be found that most scholars pay attention to the mechanical properties and thermal properties of phase change energy storage building materials, while there are few studies on the influence mechanism of deformation between composite PCMs and energy storage mortar.
Based on the academic idea of high value utilization of expanded vermiculite resources, its heat storage characteristics were explored and the performance of CA–PA/EVM for the preparation of energy storage mortar was evaluated in this study. The compatibility, stability, and thermal properties of CA–PA/EVM were determined by FT-IR, XRD, SEM, TG, and DSC. To investigate whether the CA–PA/EVM can be used in the field of energy-saving buildings, the mechanical and thermal properties of CA–PA/EVM-based thermal energy storage mortar were systematically studied. Notably, DIC technology was used to examine the uniaxial failure process of CA–PA/EVM-based thermal energy storage mortar, and the test results were used to investigate the crack failure features and first failure time of thermal energy storage mortar.
2. Materials and methods
2.1 Materials
EVM was obtained from Lingshou, Hebei province. It was sieved before use to keep its diameter at 0.075–2 mm. The typical chemical composition is (mass%): SiO2, 66.86%, and Al2O3, 15.16%. CA (C10H20O2) was purchased from Shanghai Maclin Biochemical Technology Co., Ltd, while PA (C16H32O) was supplied by Sinopharm Reagent Co., Ltd. Ordinary Portland cement (PO 42.5) was produced by Fushun Cement Co., Ltd. The standard sand was purchased from Xiamen Aiou Co., Ltd with a particle size range of 0.08–2 mm. The water is laboratory tap water.2.2 Preparation of CA–PA binary eutectic PCM
CA and PA were selected to prepare binary eutectic PCM, and the phase transition temperature and latent heat of pure CA and PA were obtained by DSC test. According to Schroeder's formula,37,38 the ratio, phase transition temperature, and latent heat of the CA–PA eutectic PCM can be theoretically predicted. The mass ratio of CA to PA in binary eutectic PCM is approximately 82% to 18% by calculating. CA and PA were weighed in accordance with the determined proportion and submerged in water heated to 80 °C until melted. Using a magnetic stirring device, the mixture was stirred at 1200 revolutions per minute for 30 minutes before being cooled to room temperature.To verify that the predicted CA–PA phase transition temperature and latent heat are within the allowable error range, the prediction of CA–PA was compared with the actual data. Table 1 shows the distinction between the predicted temperature and latent heat of phase change for CA–PA, as well as the data of pure CA, PA, and CA–PA binary eutectic PCM measured by DSC. The deviation between the projected and actual values of the transition temperature and latent heat of fatty acids should be less than 5 °C and 30 J g−1, respectively.39 As can be seen from Table 1, the temperature and latent heat error of binary eutectic are 2.22 °C and 11.6 J g−1, respectively. Within the allowed error range, the experimental value is in good agreement with the predicted value, it is proved that the method of predicting the ratio of binary phase change materials by the Schroeder equation is reasonable.
| Pure CA | Pure PA | Predicted value of CA–PA | The actual value of CA–PA | |
|---|---|---|---|---|
| Phase transition temperature [°C] | 31.10 | 62.43 | 26.05 | 23.83 |
| Phase change latent heat [J g−1] | 139.5 | 182.2 | 141.8 | 130.2 |
2.3 Preparation of CA–PA/EVM composite PCMs
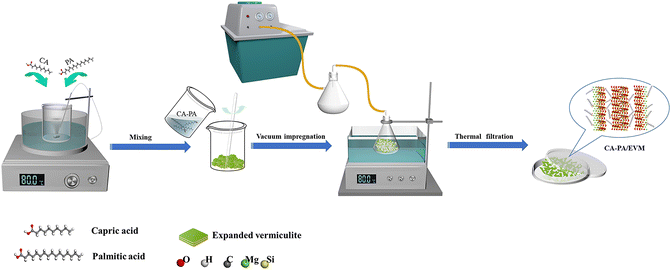
The CA–PA/EVM composite PCMs were prepared with EVM as the matrix and CA–PA eutectic PCM as the adsorbent. The preparation process of CA–PA/EVM can be obtained in Fig. 1 The CA–PA and EVM were mixed in different proportions (5![[thin space (1/6-em)]](https://www.rsc.org/images/entities/char_2009.gif) :
:![[thin space (1/6-em)]](https://www.rsc.org/images/entities/char_2009.gif) 5, 6
5, 6![[thin space (1/6-em)]](https://www.rsc.org/images/entities/char_2009.gif) :
:![[thin space (1/6-em)]](https://www.rsc.org/images/entities/char_2009.gif) 4, 7
4, 7![[thin space (1/6-em)]](https://www.rsc.org/images/entities/char_2009.gif) :
:![[thin space (1/6-em)]](https://www.rsc.org/images/entities/char_2009.gif) 3, and 8
3, and 8![[thin space (1/6-em)]](https://www.rsc.org/images/entities/char_2009.gif) :
:![[thin space (1/6-em)]](https://www.rsc.org/images/entities/char_2009.gif) 2, named CA–PA-1, CA–PA-2, CA–PA-3, and CA–PA-4, respectively). The composite was placed in a water bath pot at 80 °C for 5 min to melt the CA–PA, vacuumed to −0.1 MPa, and kept at 80 °C for 30 min. The vacuum pump was turned off to enter the air, forcing the CA–PA to penetrate the pores of the EVM and ultrasonically heated at 80 °C for 5 min. After cooling to room temperature, the composite was kept in a 50 °C oven for 12 h to remove excess CA–PA through heat filtration, resulting in EVM-based composite PCM.
2, named CA–PA-1, CA–PA-2, CA–PA-3, and CA–PA-4, respectively). The composite was placed in a water bath pot at 80 °C for 5 min to melt the CA–PA, vacuumed to −0.1 MPa, and kept at 80 °C for 30 min. The vacuum pump was turned off to enter the air, forcing the CA–PA to penetrate the pores of the EVM and ultrasonically heated at 80 °C for 5 min. After cooling to room temperature, the composite was kept in a 50 °C oven for 12 h to remove excess CA–PA through heat filtration, resulting in EVM-based composite PCM.
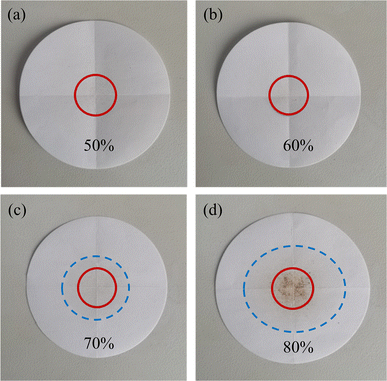
Leakage tests were used to examine the stability of CA–PA/EVM composite PCMs and identify the ideal matrix ratio. The center of the filter paper (D = 115 mm) was used as a circle with a diameter of 30 mm as the test area, and the sample was tiled in the test area. The sample was then smoothly moved into a 50 °C oven for 2 h, and the leakage phenomenon of CA–PA can be observed on the filter paper. When heated above the melting point of CA–PA, the leakage fraction (L) is less than 10%, the composite phase transition was considered stable.40 The optimal ratio of composite PCM was selected and named CA–PA/EVM.
The CA–PA/EVM was placed on the filter paper and placed in the oven at 50 °C for 10 min. The filter paper was taken out and placed at room temperature for 10 min. This was considered to be a phase transition cycle and the composite PCM undergoing 100 cycles was named CA–PA/EVM-1.
2.4 Preparation of CA–PA/EVM-based thermal energy storage mortar
The mix ratio of the CA–PA/EVM-based mortar test block was designed by the equal volume substitution method. CA–PA/EVM with different volume fractions (0%, 20%, 25%, 30%, and 35%) were incorporated into the mortar instead of standard sand, named NC, PCMC-20, PCMC-25, PCMC-30, and PCMC-35. To avoid reactions between the CA–PA and the admixture affecting the performance of mortar, any chemical admixtures such as water reducers were not added.41 The mixed design of CA–PA/EVM-based thermal energy storage mortar is shown in Table 2.| Mix design | Volume fraction | Cement [kg m−3] | Sand [kg m−3] | CA–PA/EVM [kg m−3] | W/C ratio |
|---|---|---|---|---|---|
| NC | 0% | 450 | 1350 | 0 | 0.5 |
| PCMC-20 | 20% | 450 | 1080 | 108 | 0.5 |
| PCMC-25 | 25% | 450 | 1013 | 135 | 0.5 |
| PCMC-30 | 30% | 450 | 945 | 162 | 0.5 |
| PCMC-35 | 35% | 450 | 878 | 189 | 0.5 |
The preparation of mortar is carried out by the following method. The cement and CA–PA/EVM were first allowed to dry-mixed at low speed for 1 min. After that, the sand was added and mixed for a further 2 minutes at the same slow speed.42 The water was added and stirred at low speed and high speed for 2 min. After the mortar was prepared, it was loaded into the standard mold. The subsequent mechanical and thermal properties tests were carried out after curing for 28 days in a standard curing tank with a temperature of 20 ± 2 °C and relative humidity of 90%.
2.5 Characterization
The FT-IR (Nicolet 5700 spectrophotometer) was applied to study the chemical compatibility of CA, PA, EVM, CA–PA/EVM, and CA–PA/EVM-1. The FT-IR spectra of KBr pellets and test samples were analyzed in the frequency range of 4000 cm−1 to 400 cm−1 after mixing and grinding. The XRD (Bruker D8 Advance) was investigated the crystallization characteristics of CA–PA, EVM, CA–PA/EVM, and CA–PA/EVM-1. The Scanning range was from 5° to 70° and using a step size of 0.02° and a scan speed of 10° min−1. The microstructure of EVM, CA–PA/EVM, and CA–PA/EVM-based thermal energy storage mortar were observed by SEM (FEI Quanta-200). DSC (TADSC-Q20) was used to analyze the phase transition temperature and latent heat of CA, PA, EVM, CA–PA/EVM, CA–PA/EVM-1, and CA–PA/EVM-based thermal energy storage mortar at a constant nitrogen flow rate of 5° min−1 in the range of 0–100 °C. The thermal conductivity of CA–PA and CA–PA/EVM was determined by TC 3000 thermal constant analyzer. Thermal stability analysis was performed using TGA (SDT Q600) under constant argon flow at a rate of 10° min−1 in the range of room temperature to 400 °C. Compressive strength tests were performed using rectangular blocks of 70.1 × 70.1 × 70.1 mm3 that were filled with the CA–PA/EVM-based energy storage mortar.The CA–PA/EVM-based thermal energy storage mortars were observed simultaneously with DIC equipment during the compression test. Black and white matte paint speckle was prefabricated on the relatively smooth surface of the phase change mortar. The evolution of the transverse deformation field of energy storage mortar under load was observed. Stress control loading mode was adopted in the uniaxial compression test, and the loading rate was set as 0.05 MPa s−1. A digital speckle observation system, which primarily comprises of two cameras (CCD) (resolution 2448 × 2048 pixels), an A/D converter, and a computer (PC) terminal, was used to examine the transverse deformation field of CA–PA/EVM-based energy storage mortar. The frame capture rate of a high-speed camera is 10 Hz, and the image acquisition rate is 2 frames/second. The loading system and VIC system are synchronized.
3. Results and discussions
3.1 Leakage test of CA–PA/EVM composite PCMs
Fig. 2 and Table 3 show the leak conditions of CA–PA/EVM composite PCMs after the leakage test (leakage trail is marked with blue dotted line). Fig. 2(a) shows that no leakage of CA–PA was observed on the filter paper surface of the CA–PA-1. It can be seen from Fig. 2(b) that a very small amount of leakage was found within the test zone for the CA–PA-2. As can be seen from Fig. 2(c) and (d), a large amount of leakage of CA–PA-3 and CA–PA-4 can be observed. Table 3 shows that the leakage rates of CA–PA-1, CA–PA-2, CA–PA-3 and CA–PA-4 are 0%, 10%, 66.7% and 123.3%, respectively. To obtain the high latent heat of CA–PA/EVM composite PCMs with a stability requirement, the optimum compound design of CA–PA-2 with a mass fraction of 60% was used to prepare the CA–PA/EVM.| Samples | CA–PA-1 | CA–PA-2 | CA–PA-3 | CA–PA-4 |
|---|---|---|---|---|
| D0 [mm] | 30 | 30 | 30 | 30 |
| Dmin [mm] | 0 | 32 | 49 | 64 |
| Dmax [mm] | 0 | 34 | 51 | 70 |
![[D with combining macron]](https://www.rsc.org/images/entities/i_char_0044_0304.gif) [mm] [mm] |
0 | 33 | 50 | 67 |
| L [mm] | 0 | 10.0 | 66.7 | 123.3 |
3.2 Crystalloid phase of composite PCMs
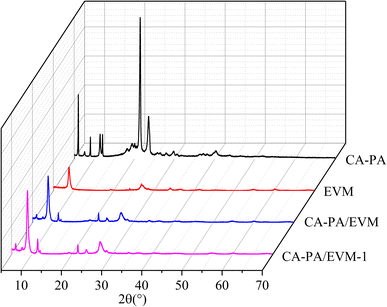
Fig. 3 presents the XRD peaks of CA–PA, EVM, CA–PA/EVM, and CA–PA/EVM-1. As can be seen from Fig. 3, CA–PA has four strong peaks at 6.1°, 11.5°, 21.5°, and 23.6°, respectively. This is consistent with previous research.43,44 EVM has characteristic peaks at 8.9°, 27.0°, and 28.7°, indicating that EVM had incomplete crystallinity.45 All characteristic peaks of CA–PA eutectic and EVM are reflected in the XRD patterns of CA–PA/EVM. Meanwhile, it can be observed that the peak strength of CA–PA/EVM is lower than that of CA–PA. This is because the movement of CA–PA molecules is limited due to the pore size of EVM, and the crystallization behavior of CA–PA is obviously oriented towards (005) crystal plane.46–48 XRD analysis showed that no chemical reaction occurred between CA–PA eutectic and EVM. Moreover, the characteristic diffraction peaks of CA–PA/EVM-1 and CA–PA/EVM are nearly unchanged after 100 phase change cycles. Therefore, it can be demonstrated that CA–PA can be immersed into the layered structure of EVM through physical bonding without changing their chemical properties and showing good chemical stability.3.3 Chemical structure of composite PCMs
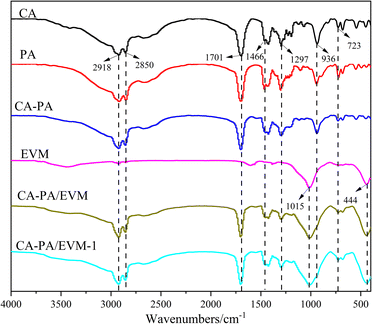
The FT-IR spectra of CA, PA, CA–PA, EVM, CA–PA/EVM, and CA–PA/EVM-1 are shown in Fig. 4. As can be seen from Fig. 4, the spectra of CA, PA, and CA–PA are similar, because they all belong to saturated fatty acids with similar structures. The absorption peaks at 2918 and 2850 cm−1 represent asymmetric and symmetric stretching vibrations of fatty acid –CH2, respectively. The peak at wave number 1701 cm−1 is caused by the tensile vibration of the carbon base (C![[double bond, length as m-dash]](https://www.rsc.org/images/entities/char_e001.gif) O). The characteristic peak at 1466 cm−1 indicates that –CH3 has shear bending vibration. In addition, the peaks of 1297 and 936 cm−1 in the infrared spectrum correspond to the bending vibration of the functional group in and out of the plane of fatty acids –OH, respectively. The peak value at 723 cm−1 represents the in-plane oscillation vibration of –OH.46 In the EVM spectrum, the infrared peak at 1015 cm−1 is attributed to the tensile vibration of Si–O–Si and Si–O–Al, while the peak at 444 cm−1 is due to the bending vibration of Si–O–Mg.49 It can be observed that the main absorption peaks of CA–PA eutectic and EVM appear in the infrared spectrum of the CA–PA/EVM, which indicates that CA–PA is successfully loaded into the EVM. It is worth noting that the spectral peaks of CA–PA/EVM-1 are nearly unchanged after 100 thermal cycles, indicating that CA–PA/EVM has good chemical stability.
O). The characteristic peak at 1466 cm−1 indicates that –CH3 has shear bending vibration. In addition, the peaks of 1297 and 936 cm−1 in the infrared spectrum correspond to the bending vibration of the functional group in and out of the plane of fatty acids –OH, respectively. The peak value at 723 cm−1 represents the in-plane oscillation vibration of –OH.46 In the EVM spectrum, the infrared peak at 1015 cm−1 is attributed to the tensile vibration of Si–O–Si and Si–O–Al, while the peak at 444 cm−1 is due to the bending vibration of Si–O–Mg.49 It can be observed that the main absorption peaks of CA–PA eutectic and EVM appear in the infrared spectrum of the CA–PA/EVM, which indicates that CA–PA is successfully loaded into the EVM. It is worth noting that the spectral peaks of CA–PA/EVM-1 are nearly unchanged after 100 thermal cycles, indicating that CA–PA/EVM has good chemical stability.
3.4 Heat storage and thermal conductivity properties of composite PCMs
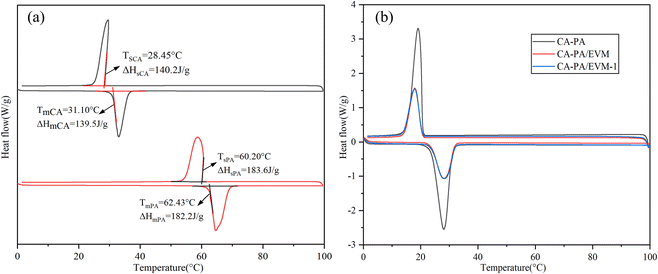
The thermal storage characteristics of CA, PA, CA–PA, CA–PA/EVM, and CA–PA/EVM-1 were studied by DSC thermal analysis in Fig. 5. It can be seen from Fig. 5(a) that the melting and solidification phase transition temperatures (Tm and Ts) of CA are 31.10 and 28.45 °C, respectively, and the latent heats of melting and solidification (Hm and Hs) are 139.5 and 142.2 J g−1, respectively. While the melting and solidification phase transition temperatures of PA are 62.43 and 60.20 °C, respectively. The latent heats of melting and solidification are 182.2 and 183.6 J g−1, respectively.Based on the DSC curve of CA–PA, the thermal properties and thermal reliability of CA–PA/EVM and CA–PA/EVM-1 were evaluated in Fig. 5(b). It can be observed from the diagram that the melting phase transition temperature and latent heat of CA–PA are 23.83 °C and 130.2 J g−1, while the solidification phase transition temperature and latent heat are 20.64 °C and 127.9 J g−1. It is worth noting that the phase transition temperature of CA–PA meets the indoor comfort temperature range. Compared with CA–PA, the melting transformation temperatures of CA–PA/EVM and CA–PA/EVM-1 are 23.61 and 23.74 °C, and the melting latent heat is 67.5 and 66.0 J g−1. Meanwhile, the solidification transformation temperatures are 20.41 and 20.47 °C, and the melting latent heat is 64.9 and 63.8 J g−1, respectively. The tiny change in the phase change temperature of CA–PA/EVM may be due to the physical interaction between CA–PA and EVM.50 Through calculation, we know that the mass ratios of CA–PA eutectic in the CA–PA/EVM and CA–PA/EVM-1 are 51.84% and 50.69%, respectively, which is consistent with the mass ratio of 6![[thin space (1/6-em)]](https://www.rsc.org/images/entities/char_2009.gif) :
:![[thin space (1/6-em)]](https://www.rsc.org/images/entities/char_2009.gif) 4 of the initial CA–PA and EVM. The decrease in loading capacity may be caused by the thermal filtration of CA–PA/EVM. The thermal properties of EVM-based composites in different works of literature are compared in Table 4, and it can be seen that the prepared CA–PA/EVM has certain advantages in loading capacity. Meanwhile, The DSC curves of CA–PA/EVM before and after 100 thermal cycles almost coincide, and the change rate of phase transition temperature and latent heat is relatively small, indicating that the CA–PA/EVM has good thermal reliability.
4 of the initial CA–PA and EVM. The decrease in loading capacity may be caused by the thermal filtration of CA–PA/EVM. The thermal properties of EVM-based composites in different works of literature are compared in Table 4, and it can be seen that the prepared CA–PA/EVM has certain advantages in loading capacity. Meanwhile, The DSC curves of CA–PA/EVM before and after 100 thermal cycles almost coincide, and the change rate of phase transition temperature and latent heat is relatively small, indicating that the CA–PA/EVM has good thermal reliability.
| Phase transition temperature [°C] | Phase change latent heat [J g−1] | Loading capacity [%] | Reference | |
|---|---|---|---|---|
| CA–PA/EVM | 22.61 | 61.03 | 40.00 | 51 |
| CA–SA/EVM | 25.64 | 72.05 | 40.00 | |
| CA–SA/EVM | 24.54 | 76.32 | 41.38 | 52 |
| Paraffin/EVM | 48.85 | 101.14 | 53.20 | 53 |
| SA/EVM | 66.4 | 77.6 | 38.90 | 54 |
| CA–MA–SA/EVM | 23.26 | 62.1 | 39.10 | 55 |
| CA–PA/EVM | 23.61 | 67.5 | 51.84 | This work |
Thermal conductivity is an important characteristic for characterizing phase transition materials' properties. The thermal conductivity of CP-PA and CA–PA/EVM are 0.22 and 0.25 W (m−1 K−1), respectively. The results suggest that the porous network structure of EVM may provide a heat transfer channel for CA–PA, and the thermal conductivity of CA–PA/EVM is marginally increased.
3.5 Thermal stability of composite PCMs
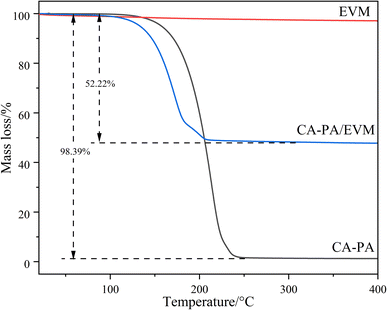
The TGA curves for CA–PA, EVM, and CA–PA/EVM are displayed in Fig. 6. It can be seen that the EVM weight loss at 400 °C is only 2.90%, mainly due to the small amount of free water between EVM and the evaporation of interlayer water. Additionally, CA–PA eutectic PCM exhibits good thermal stability at about 120 °C. After this, the mass of CA–PA is rapidly lost, with weight loss reaching 98.39% at 250 °C, which is almost equal to the mass rate of CA–PA in CA–PA/EVM. For CA–PA/EVM, the mass loss is about 52.22% at 110–210 °C, which is almost equal to the maximum load of CA–PA in EVM. Compared with CA–PA, the mass loss of the prepared CA–PA/EVM is relatively faster. This may be due to the different physical behavior between free and pore-con fined CA–PA.56 It may be inferred that the prepared CA–PA/EVM has good thermal reliability at the working temperature since the decomposition temperature of the prepared composite PCM is much higher than the operational temperature (80 °C).3.6 Microstructure of the supporting matrix and composite PCM
The microstructure of EVM, CA–PA–EVM, CA–PA/EVM-1, NC, and PCMC are shown in Fig. 7. It can be seen from Fig. 7(a) that the EVM shows a typical layered morphology, and a large number of layers are stacked together to increase its specific surface area, which is helpful to adsorb PCM in the molten state and can be used as the supporting matrix of PCM. As shown in Fig. 7(b), the layered structure of EVM becomes thickened by CA–PA occupation. The surface tension and capillary force of EVM lead to its excellent physical compatibility with organic PCM, which makes the composite phase change materials have good PCM leakage resistance, thus forming CA–PA/EVM with a stable shape. The changes in carbon components before and after EVM adsorption of CA–PA can be validated by EDS. As seen in Fig. 7(c), the morphology of CA–PA/EVM before and after the phase change cycle changes very tiny, suggesting that the CA–PA doesn't leak and the CA–PA/EVM-1 is stable. It can be discovered in Fig. 7(d) that the microscopic surface of ordinary mortar is relatively flat and smooth, with a dense structure and fewer pores. The overall view of the microstructure of PCMC is shown in Fig. 7(e) and (f). In the microscopic diagram of PCMC, CA–PA/EVM has no damage in the mixing process, and its spatial distribution tends to be uniform. There is no obvious fracture damage in the interface transition zone between hydrated cement slurry and CA–PA/EVM. Through microscopic observation, although PCMC has more pores than NC, CA–PA/EVM is still closely related to cement slurry.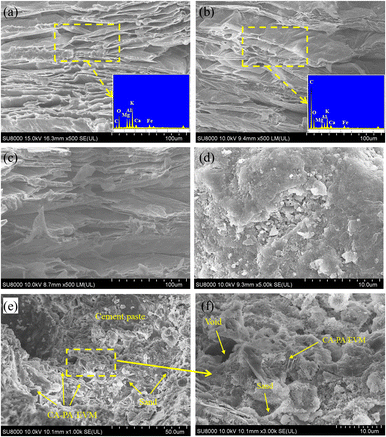 | ||
| Fig. 7 Microstructure of (a) EVM, (b) CA–PA/EVM, (c) CA–PA/EVM-1, (d) NC, (e) PCMC at 1000 times, and (f) PCMC at 3000 times. | ||
3.7 Mechanical properties and thermal properties of CA–PA/EVM-based thermal energy storage mortars
Mechanical qualities and thermal parameters were measured to determine whether CA–PA/EVM is suitable for the enclosing construction of energy-saving buildings. According to the results of compressive strength in Fig. 8(a), NC as the control with compressive strength of 26.7 MPa, the compressive strength of PCMC-20, PCMC-25, PCMC-30, and PCMC-35 on the 28th day was 13.7, 9.5, 6.3 and 3.8 MPa, respectively. According to GB50574-2010, masonry mortar strength is not less than 5 MPa, therefore, the content of CA–PA/EVM in mortar is less than 30% in line with the standard. It can be seen that compared with the compressive strength decreases less. The addition of CA–PA/EVM leads to a serious loss of mechanical strength, which can be attributed to the fact that the addition of CA–PA/EVM generally increases the porosity of mortar, has low strength and stiffness, and has poor bond strength with cement slurry, so it can be easily failed during loading.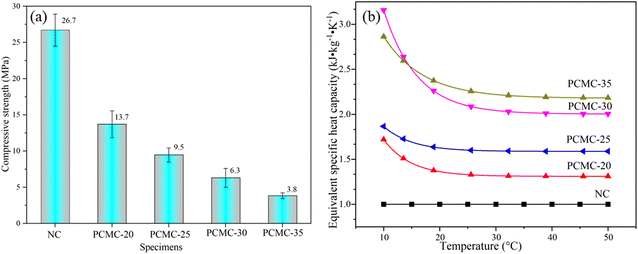 | ||
| Fig. 8 (a) Compressive strength of thermal energy storage mortars, (b) evolution of thermal energy storage mortars equivalent of specific heat capacity. | ||
The equivalent specific heat capacity and equivalent heat storage of several CA–PA/EVM-based thermal energy storage mortars were examined to investigate the thermophysical features of mortars. The DSC test of NC was taken as the control, the evolution of PCMC equivalent specific heat capacity with temperature is shown in Fig. 8(b). It can be seen from Fig. 8 that the equivalent specific heat capacity of energy storage mortar is better than that of ordinary mortar NC and increases with the increase of CA–PA/EVM content. At the same time, with the increase in temperature, the equivalent specific heat capacity of heat storage mortar tends to be stable. The equivalent specific heat capacities of PCMC-20, PCMC-25, PCMC-30, and PCMC-35 were increased by 33.8%, 60.5%, 114.7%, and 128.4%, respectively compared with NC. The increase of equivalent specific heat capacity may be due to the addition of CA–PA binary eutectic.
The equivalent energy storage of CA–PA/EVM-based thermal energy storage mortars can be obtained from the equivalent specific heat capacity.57 Table 5 displays the results of the equivalent energy storage calculation. Considering the equivalent specific heat capacity at 25 °C the value of temperature ranged from 22 to 28 °C, which is the human body's acceptable temperature range.
| Mortar | Equivalent specific heat capacity [kJ m−3] | Unit weight [kg m−3] | Equivalent energy storage [×104 kJ m−3] | Growth rate of equivalent energy storage [%] |
|---|---|---|---|---|
| NC | 1.00 | 2217.43 | 1.33 | 0.00 |
| PCMC-20 | 1.34 | 1873.86 | 1.51 | 13.54 |
| PCMC-25 | 1.60 | 1814.86 | 1.74 | 30.83 |
| PCMC-30 | 2.15 | 1757.56 | 2.27 | 70.68 |
| PCMC-35 | 2.28 | 1701.47 | 2.33 | 75.19 |
By calculation, the equivalent heat storage capacity of PCMC-20, PCMC-25, PCMC-30, and PCMC-35 is increased by 13.54%, 30.83%, 70.68%, and 75.19%, respectively. Thus, the equivalent specific heat capacity and equivalent energy storage have been significantly improved. Considering the mechanical properties and thermophysical properties of thermal energy storage mortar, PCMC-30 with higher heat storage capacity is selected as the best mix mortar based on satisfying the mechanical properties.
3.8 Deformation evolution law of PCMC-30
In this study, DIC technology is used to collect and analyze speckle images of NC and PCMC-30, and the evolution of the transverse strain field during the deformation and failure process is determined. The evolution of the mortar transverse strain field can be divided into four stages: initial loading stage, compaction stage, crack germination stage, expansion stage, and failure stage. Four distinctive sites (labeled i, ii, iii, and iv) in the evolution of the strain field in the deformation and failure processes of NC and PCMC-30, respectively, are chosen for analysis in Fig. 9(a) and (b). The transverse strain stress nephogram of NC in the initial loading stage (point i) resembles that of PCMC-30 in that it displays a condition of compression with maximal strain at the top and bottom and a uniform strain field distribution.58 The mortar's original pores and cracks tend to shut at this stage. The NC and PCMC-30 are in the compaction stage (point ii) with the increasing test force, and the strain concentration zone is formed around the crack at this time. No obvious cracks are apparent on the sample's surface. The strain concentration area extends toward the specimen's center at the point iii stage of crack germination and propagation.59 At this stage, there are no visible penetrating cracks on the surface and the specimen remains in a safe condition. The test strength reaches its maximum at the test block's failure stage (point iv). The transverse strain nephograms of NC and PCMC-30 show clear strain concentration zones at this stage, which will rapidly enlarge to produce penetrating cracks as the load is increased. PCMC-30 caused the fractures to be more curved and numerous than NC from Fig. 9 (points iii and iv). Cracks are well known to spread along the weakest part of the mortar first. The fracture curves because the interface between the hydrated cement slurry and the CA–PA/EVM in PCMC-30 is weaker or has more weak places, which can be somewhat proven in SEM. This is one of the factors that reduce the strength of PCMC-30.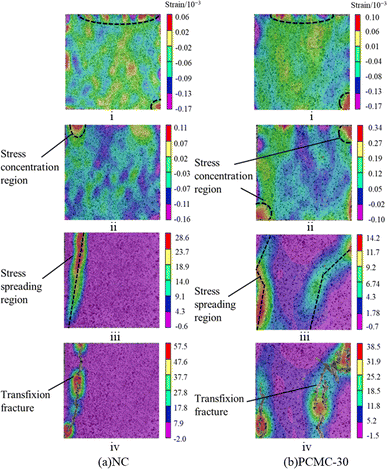 | ||
| Fig. 9 Nephogram of strain field evolution during deformation and failure of (a) NC and (b) PCMC-30. | ||
It is important to note that the axial load associated with the first crack in NC during the crack initiation and propagation stage is 35.85% of the total load, whereas the first crack in energy storage mortar is 75.43% of the total load. As observed, thermal energy storage mortar splits later than regular mortar even though its strength is visibly lower than that of regular mortar. This could be because the presence of phase transition components increases the cracking resistance of the energy storage mortar, which can lessen thermal cracking caused by the hydration process during curing.
4. Conclusions
In this study, the XRD and FTIR studies proved that the CA–PA/EVM crystal structure was stable and had excellent chemical compatibility. The CA–PA eutectic was physically adsorbed to the layered pore structure of EVM as demonstrated by SEM. The DSC test showed that CA–PA/EVM had a suitable temperature and higher latent heat of phase transition. TG demonstrated that CA–PA/EVM had good thermal stability at working temperature. Meanwhile, CA–PA/EVM still retained good thermal reliability after 100 thermal cycles. Furthermore, the mechanical and thermal properties of CA–PA/EVM-based thermal energy storage mortar were systematically investigated. It's worth noting that the initial cracking time of PCMC-30 is later than that of NC by DIC technology, implying that PCMC-30 through the test may have better cracking resistance. This study exclusively uses the strain field approach to examine the full-field deformation and failure development law of the CA–PA/EVM-based heat storage mortar. The impact of CA–PA/EVM on the functionality of energy storage mortar can be further investigated in the following stage using a method that combines strain and displacement fields, which could provide up more possibilities for its use in practical engineering.Author contributions
Ruixue Bai and Songyang Liu wrote the manuscript and directed the project. Jie Han, Mengqing Wang, Wei Gao, Dapeng Wu and Meng Zhou implemented the synthetic experiments and interpreted the experimental outcomes.Conflicts of interest
There are no conflicts to declare.Acknowledgements
This work was supported by the General Projects in 2021 of the Educational Department of Liaoning Province, China (Grant No. LJKZ0405 and LJKZ0390) and Liaoning Key Lab of Petro-chemical Special Building Materials.Notes and references
- Q. Al-Yasiri and M. Szabó, J. Build. Eng., 2021, 36, 102122 CrossRef.
- G. Hekimoğlu, A. S. Sari, T. Kar, S. Keleş, K. Kaygusuz, N. Yildirim, V. V. Tyagi, R. K. Sharma and T. A. Saleh, Int. J. Energy Res., 2021, 45, 10271–10284 CrossRef.
- J. Guo, Y. Jiang, Y. Wang and B. Zou, Energy Convers. Manage., 2020, 205, 112288 CrossRef.
- Q. He, H. Fei, J. Zhou, X. Liang and Y. Pan, Constr. Build. Mater., 2023, 372, 130841 CrossRef CAS.
- J. Zhou, H. Fei, Q. He, P. Li, Y. Pan and X. Liang, Sci. Total Environ., 2023, 882, 163670 CrossRef CAS PubMed.
- W. Du, H. Fei, Y. Pan, Q. He, J. Zhou and X. Liang, Constr. Build. Mater., 2022, 320, 126309 CrossRef CAS.
- H. Yang, W. Zhang, Y. Zhu, Y. Shao, Y. Shao and X. Zhang, J. Energy Storage, 2022, 56, 106047 CrossRef.
- F. Ma, C. Chen and Y. Wang, Constr. Build. Mater., 2021, 305, 124795 CrossRef CAS.
- B. Lu, Y. Zhang, D. Sun and X. Jing, Renewable Energy, 2021, 178, 669–678 CrossRef CAS.
- M. George, A. K. Pandey, N. A. Rahim, V. V. Tyagi, S. Shahabuddin and R. Saidur, J. Energy Storage, 2020, 31, 101568 CrossRef.
- P. Kulkarni and A. Muthadhi, Innovative Infrastructure Solutions, 2021, vol. 6 Search PubMed.
- F. Liu, J. Zhu, J. Liu, B. Ma, W. Zhou and R. Li, Energy Build., 2018, 158, 1781–1789 CrossRef.
- J. Jin, L. Liu, R. Liu, H. Wei, G. Qian, J. Zheng, W. Xie, F. Lin and J. Xie, Constr. Build. Mater., 2019, 226, 616–624 CrossRef CAS.
- J. Fořt, A. Trník, M. Pavlíková, Z. Pavlík and R. Černý, Int. J. Thermophys., 2018, 39, 137 CrossRef.
- J. A. C. Costa, A. E. Martinelli, R. M. do Nascimento and A. M. Mendes, Constr. Build. Mater., 2020, 232, 117167 CrossRef CAS.
- J. Han and S. Liu, RSC Adv., 2017, 7, 22170–22177 RSC.
- M. Jafaripour, S. M. Sadrameli, H. Pahlavanzadeh and S. A. H. S. Mousavi, J. Energy Storage, 2021, 33, 102155 CrossRef.
- P. Lv, C. Liu and Z. Rao, Appl. Energy, 2016, 182, 475–487 CrossRef CAS.
- S. Liu, Z. Yan, L. Fu and H. Yang, Sol. Energy Mater. Sol. Cells, 2017, 167, 140–149 CrossRef CAS.
- H. Yi, Z. Ai, Y. Zhao, X. Zhang and S. Song, Sol. Energy Mater. Sol. Cells, 2020, 204, 110233 CrossRef CAS.
- K. Peng, L. Fu, X. Li, J. Ouyang and H. Yang, Appl. Clay Sci., 2017, 138, 100–106 CrossRef CAS.
- H. Ai, L. Lv, T. Chen, Y. Zhang, L. Dong and S. Song, Energy Convers. Manage., 2022, 253, 115172 CrossRef CAS.
- P. Rathore, S. Shukla and N. Gupta, J. Sol. Energy Eng., 2020, 142, 1–33 CrossRef.
- C. Liu, C. Luo, T. Xu, P. Lv and Z. Rao, Sol. Energy, 2019, 191, 585–595 CrossRef CAS.
- Y. Bian, K. Wang, J. Wang, Y. Yu, M. Liu and Y. Lv, Renewable Energy, 2021, 179, 1027–1035 CrossRef CAS.
- C. Yao, X. Kong, Y. Li, Y. Du and C. Qi, Energy Convers. Manage., 2018, 155, 20–31 CrossRef.
- N. Xie, J. Luo, Z. Li, Z. Huang, X. Gao, Y. Fang and Z. Zhang, Sol. Energy Mater. Sol. Cells, 2019, 189, 33–42 CrossRef CAS.
- Y. Deng, M. He and J. Li, Mater. Lett., 2019, 234, 17–20 CrossRef CAS.
- H. Zhang, J. Zhu, Z. Weibing, L. Fengli and K. Li, J. Mater. Sci., 2019, 54, 2231–2240 CrossRef CAS.
- X. Zhang, Z. Yin, D. Meng, Z. Huang, R. Wen, Y. Huang, X. Min, Y. Liu, M. Fang and X. Wu, Renewable Energy, 2017, 112, 113–123 CrossRef CAS.
- R. Wen, X. Zhang, Y. Huang, Z. Yin, Z. Huang, M. Fang, Y. g. Liu and X. Wu, Energy Build., 2017, 139, 197–204 CrossRef.
- S. Pilehvar, V. D. Cao, A. M. Szczotok, L. Valentini, D. Salvioni, M. Magistri, R. Pamies and A.-L. Kjøniksen, Cem. Concr. Res., 2017, 100, 341–349 CrossRef CAS.
- L. Afolabi, A. Elfaghia, T. Alomayri, A. Arogundade, S. Mahzan, N. Mat Isa, S. Lin and T. Otitoju, Int. J. Energy Res., 2021, 45, 13575–13590 CrossRef CAS.
- Y. Liu, M. Xie, X. Gao, Y. Yang and Y. Sang, Appl. Therm. Eng., 2018, 140, 112–119 CrossRef CAS.
- M. J. Abden, Z. Tao, Z. Pan, L. George and R. Wuhrer, Appl. Energy, 2020, 259, 114113 CrossRef CAS.
- M. Ren, Y. Liu and X. Gao, Energy, 2020, 197, 117262 CrossRef CAS.
- C. M. Oldenburg and F. J. Spera, Int. J. Heat Mass Transfer, 1991, 34, 2107–2121 CrossRef CAS.
- H. Ke, Appl. Therm. Eng., 2017, 113, 1319–1331 CrossRef CAS.
- Q. Yan, Q. Fan, J. Zhang, C. Liu and C. Wang, IOP Conf. Ser.: Mater. Sci. Eng., 2019, 585, 012035 CAS.
- L. Jiesheng, Y. Yuanyuan and H. Xiang, Energy Build., 2016, 110, 108–111 CrossRef.
- H.-W. Min, S. Kim and H. S. Kim, Constr. Build. Mater., 2017, 149, 749–762 CrossRef.
- B. Xu, H. Ma, Z. Lu and Z. Li, Appl. Energy, 2015, 160, 358–367 CrossRef CAS.
- F. Tang, D. Su, Y. Tang and G. Fang, Sol. Energy Mater. Sol. Cells, 2015, 141, 218–224 CrossRef CAS.
- A. Sarı, A. Bicer, A. Al-Ahmed, F. A. Al-Sulaiman, M. H. Zahir and S. A. Mohamed, Sol. Energy Mater. Sol. Cells, 2018, 179, 353–361 CrossRef.
- R. Wen, Z. Huang, Y. Huang, X. Zhang, X. Min, M. Fang, Y. g. Liu and X. Wu, Energy Build., 2016, 116, 677–683 CrossRef.
- M. Mehrali, S. T. Latibari, M. Mehrali, T. M. Indra Mahlia and H. S. Cornelis Metselaar, Energy, 2013, 58, 628–634 CrossRef CAS.
- Z. An, H. Chen, X. Du, T. Shi and D. Zhang, ACS Omega, 2022, 7, 34436–34448 CrossRef CAS PubMed.
- W. Zhang, X. Zhang, Z. Huang, Z. Yin, R. Wen, Y. Huang, X. Wu and X. Min, J. Mater. Sci. Technol., 2018, 34, 379–386 CrossRef CAS.
- J. Feng, M. Liu, W. Mo and X. Su, Ceram. Int., 2021, 47, 25373–25380 CrossRef CAS.
- X. Guo, H. Wei, X. He, M. He and D. Yang, Build. Environ., 2022, 221, 109318 CrossRef.
- A. Karaipekli and A. Sarı, J. Ind. Eng. Chem., 2010, 16, 767–773 CrossRef CAS.
- A. Sari, A. Biçer and G. Hekimoglu, J. Compos. Mater., 2018, 53, 002199831880835 Search PubMed.
- W.-m. Guan, J.-h. Li, T.-t. Qian, X. Wang and Y. Deng, Chem. Eng. J., 2015, 277, 56–63 CrossRef CAS.
- X. Li, H. Wei, X. Lin and X. Xie, Sol. Energy Mater. Sol. Cells, 2016, 155, 9–13 CrossRef CAS.
- H. Wei, X. Xie, X. Li and X. Lin, Appl. Energy, 2016, 178, 616–623 CrossRef CAS.
- S. A. Memon, H. Cui, T. Y. Lo and Q. Li, Appl. Energy, 2015, 150, 245–257 CrossRef CAS.
- Q. Ma and M. Bai, Constr. Build. Mater., 2018, 176, 43–49 CrossRef.
- L. Wang, Y. Zhao and Y. Xing, Constr. Build. Mater., 2022, 324, 126638 CrossRef.
- S. Zhu, M. Wang, W. Zhai, C. Cai, C. Zhao, D. Zeng and J. Zhang, Constr. Build. Mater., 2018, 187, 460–473 CrossRef.
| This journal is © The Royal Society of Chemistry 2023 |

