 Open Access Article
MIL-88B(Fe)-NH2: an amine-functionalized metal–organic framework for application in a sensitive electrochemical sensor for Cd2+, Pb2+, and Cu2+ ion detection†
Luyen T. Tran ,
Hue T. M. Dang*,
Hoang V. Tran
 *,
Giang T. L. Hoang and
Chinh D. Huynh
School of Chemical Engineering, Hanoi University of Science and Technology, 1 Dai Co Viet Road, Hai Ba Trung District, Hanoi 100000, Vietnam. E-mail: hue.dangthiminh@hust.edu.vn; hoang.tranvinh@hust.edu.vn
First published on 19th July 2023
Abstract
We propose here an electrochemical platform for multi-heavy metal ion detection in water based on MIL-88B(Fe)-NH2, an amine-functioned metal–organic framework (MOF) for modifying the surface of a glassy carbon electrode (GCE). Herein, MIL-88B(Fe)-NH2 with abundant functionalized amine groups can play the role of capture sites for the enrichment of metal ions before electrochemical oxidation sensing. MIL-88B(Fe)-NH2 was synthesized under optimized conditions through a solvothermal method and characterized by X-ray diffraction (XRD), scanning electron microscopy (SEM), transition electron microscopy (TEM), Fourier-transform infrared spectroscopy (FT-IR), cyclic voltammetry (CV) and electrochemical impedance spectroscopy (EIS) techniques. MIL-88B(Fe)-NH2 was then drop-casted on GCE to electrochemically determine the Cd2+, Pb2+ and Cu2+ ion concentrations by differential pulse voltammetry (DPV). The electrochemical sensor exhibits excellent electrochemical performance toward Cd2+, Pb2+ and Cu2+ ions in the large linear ranges of 0.025–1.000 μM, 0.3–10.0 μM and 0.6–10.0 μM with limits of detection that are 2.0 × 10⁻¹⁰ M, 1.92 × 10⁻⁷ M and 3.81 × 10⁻⁷ M, respectively. The fabricated sensor also shows high reliability and good selectivity. This MIL-88B(Fe)-NH2 application strategy is promising for the evaluation of various heavy metal ions in water.
1. Introduction
Metal–organic framework (MOF) is a unique class of porous materials constituting metal ions (or clusters) and organic ligands that link together via coordination bonds. Due to their unique structure, MOFs have high specific porosity and surface area,1,2 tunable chemical functionalization, reversible adsorption, and high catalytic ability.3 As a result, MOFs can be applied in various fields, such as gas storage and separation,4,5 drug delivery,6,7 chemical separation,8 catalysis,9 cell imaging,10 and sensing.11–13 In terms of the sensing domain, MOFs are considered as a promising material class for the detection of various contaminants, such as organic substances,14,15 antibiotics,16–19 inorganic and heavy metal ions,20 owing to good physico-chemical properties (e.g., large surface area, sensitivity to target ions, and versatile structure). For the synthesis of MOFs materials, linear organic linkers, such as terephtalic acid, have been widely used due to their ability to create open framework structures. The presence of functional groups in the organic linkers leads to changes in the physicochemical behavior of the MOFs products, including the Brønsted/Lewis acid/base properties, the solubility of the starting materials, and the changes in the pore opening (flexibility) and in the adsorption selectivity to targets.21–23 On the organic linker molecule, the amino groups (–NH2) have lone pair electrons and act as the Lewis base. They can form coordinate bonds with the heavy metal ions. Thus, using NH2-functionalized MOFs as sensors to detect heavy metals is significant. In this study, we chose 2-aminoterephtalic acid (H2N-BDC), which is the one of the simplest amino diacids as an organic linker for the synthesis of MIL-88B(Fe)-NH2 (MIL: Materials of Institute Lavoisier), a common MOF whose structure is built up by Fe3+ clusters and 2-aminoterephthalate anionic ligands.24 The outstanding advantages of MIL-88B(Fe)-NH2 compared to other MOFs are its chemical stability, less toxicity, and abundant raw sources. Thus, it attracts considerable research in different applications including adsorption, sodium-ion batteries, and heterogeneous catalysis.25–29 However, the use of MIL-88B(Fe)-NH2 in the fabrication of electrochemical sensors for the detection of heavy metal ions is a relatively new issue that requires further investigation.Nowadays, the term “heavy metal” has been utilized to describe metallic elements that are harmful to the environment and humans. In recent decades, heavy metal pollution has become increasingly serious due to global population growth and industrial development. Transportation, farming activities, and industrial manufacturing like pesticides, metallurgy, oil refining, and chemicals have released an excessive amount of heavy metal (ions) into the environment. These contaminants cannot be degraded or demolished, leading to accumulation in the environment and the consequent contamination of food chains—a severe threat to human health and species. For instance, people who consume large quantities or get regularly exposed to cadmium (Cd) have a higher rate of prostate and lung cancers than others.30 Furthermore, lead (Pb) is harmful to the digestive, cardiovascular, nervous, and kidney systems.31 Another example is copper (Cu), an essential trace metal for some biological functions. However, at elevated concentrations, it can destroy many red blood cells, or result in neurological symptoms, including behavioral abnormalities, tremors of the hands, unclear speech, and others.32 Thus, examining the concentration of the heavy metal (ions) is urgent and essential.
Among many methods used to detect heavy metal ions in the water environment, MOF-based sensors show great potential for application in practice by the possibility to build portable instruments, its high sensitivity, and the ability obtain quick results.20 MOF-based sensors for heavy metal ion sensing are classified into optical sensors33,34 and electrochemical sensors.20,35–40 Furthermore, electrochemical sensors with its many advantages, such as high sensitivity and selectivity, wide linear response range, good stability and reproducibility, quick detection, ease of use, and reasonable cost, have many potential applications for the monitoring of heavy metal ions.20,36
In this work, the metal–organic framework MIL-88B(Fe)-NH2 was synthesized. The specific characteristics of the obtained MIL-88B(Fe)-NH2 samples were investigated using a number of chemical-physical techniques in order to select the optimized synthesis conditions. Then, the MIL-88B(Fe)-NH2 material was used to modify the glassy carbon electrode (GCE) to develop the sensitive electrochemical sensor for the detection of Cd2+, Pb2+, and Cu2+ ions in aqueous solutions.
2. Experimental
2.1. Chemicals and instrumentation
2-Aminoterephthalic acid H2N-C6H3-1,4-(COOH)2 (NH2-TPA) (99 wt%), iron(III) chloride hexahydrate FeCl3·6H2O (99 wt%), methanol CH3OH (MeOH) (anhydrous, 99.8 v/v%), sodium acetate CH3COONa (99 wt%), acetic acid CH3COOH (99.5 wt%), cadmium nitrate tetrahydrate Cd(NO3)2·4H2O (99 wt%), lead nitrate Pb(NO3)2 (99 wt%), and copper sulfate pentahydrate CuSO4·5H2O (99 wt%.) were purchased from Sigma-Aldrich. Cobalt sulphate heptahydrate (CoSO4·7H2O 99.5 wt%), nickel sulphate hexahydrate (NiSO4·6H2O 98.5 wt%), potassium dichromate (K2Cr2O7 99.8 wt%), and zinc chloride (ZnCl2 98 wt%.) were supplied by Xilong Chemical Co., China. The appropriate amounts of sodium acetate and acetic acid were used to prepare acetate buffer solution 0.1 M (ABS) with pH 6.0. Dimethylformamide C3H7NO (DMF) (99.94 v/v%) was purchased from Fisher Chemical. Polyethylene glycol 2000 (H(OCH2CH2)nOH, PEG 2000) was supplied by Alfa Aesar.A Siemens D5005 diffractometer (Cu Kα radiation, λ = 1.54056 Å), a NICOLET iS50FT-IR spectrometer, a Hitachi S4800 scanning electron microscope (SEM), and a TECNAI F20-G2 high-resolution transmission electron microscope (TEM) were used to perform X-ray diffraction (XRD), Fourier-transform infrared spectroscopy (FT-IR), SEM, and TEM measurements, respectively. Electrochemical measurements were conducted using a PGSTAT302N AutoLab electrochemical workstation (Metrohm, Netherlands).
2.2. Optimization of the synthetic conditions of MIL-88B(Fe)-NH2
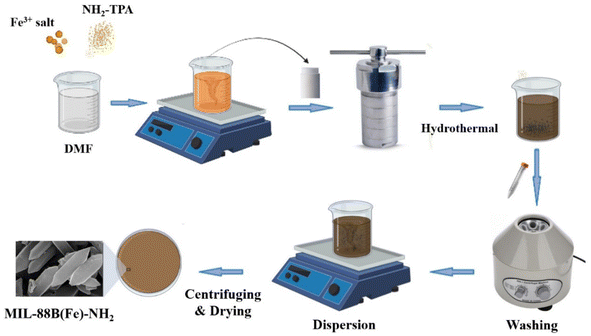
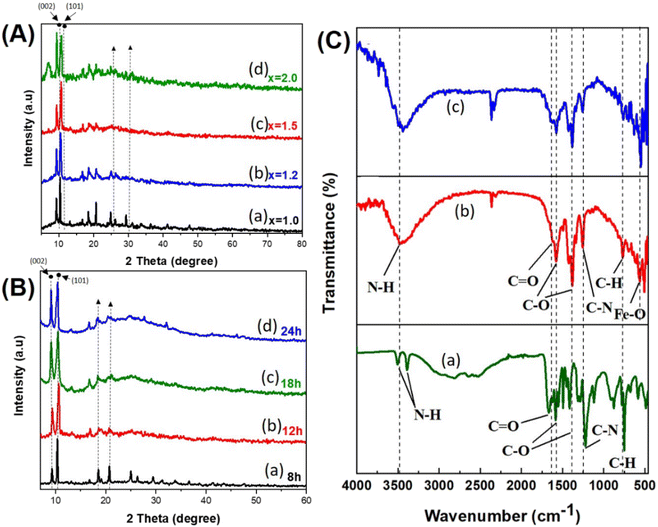
Fig. 1 shows a typical process for the synthesis of MIL-88B(Fe)-NH2 by the solvothermal method. To investigate the impact of the molar ratio between the metal ion and the ligand on the formation of MIL-88B(Fe)-NH2, 1.15 mmol FeCl3 and 1.15x (mmol) H2N-C6H3-1,4-(COOH)2 (wherein, x = 1.0; 1.2; 1.5 and 2.0, respectively) were mixed into 25 mL of DMF solvent using a magnetic stirrer until homogeneous solutions were obtained. The solutions were added into autoclaves, and then the reactions were performed hydrothermally at 150 °C. The obtained powder products were separately washed by DMF, methanol and distilled water, and were subsequently dispersed into distilled water overnight. The MIL-88B(Fe)-NH2(x) materials were obtained by centrifuging and vacuum-drying at 170 °C within 12 hours. The same experiments were carried out to study the effect of the hydrothermal time on the crystalline phase formation of MIL-88B(Fe)-NH2 at different periods, including 8, 12, 18, and 24 hours.2.3. MIL-88B(Fe)-NH2 modification of a glassy carbon electrode
Firstly, glassy carbon electrodes (GCE) were polished by 1 μm Al2O3 slurry on polishing cloth, and then washed with water and ethanol. A total of 3.0 mg of MIL-88B(Fe)-NH2 and 3.0 mg of PEG-2000 were dispersed into 1 mL of deionized water using ultrasonication for 10 minutes. Then, 5 μL of this solution was dropped onto a freshly polished GCE, and dried in air to obtain the MIL-88B(Fe)-NH2 modified GCE (GCE/MIL-88B(Fe)-NH2).2.4. Electrochemical measurements and electrochemical sensing of Cd2+, Pb2+, and Cu2+ ions
The three-electrode configuration consists of the GCE/MIL-88B(Fe)-NH2 as the working electrode (WE), a Pt wire as the counter electrode (CE), and Ag/AgCl as the reference electrode (RE). Cyclic voltammetry (CV) and electrochemical impedance spectroscopy (EIS) measurements of the GCE and the GCE/MOFs in a solution containing 0.005 M K3[Fe(CN)6], 0.005 M K4[Fe(CN)6], and 0.1 M KCl were performed. CVs were studied at a scan rate of 25 mV s−1. EIS spectra were recorded in a frequency range from 100 kHz to 0.1 Hz, EAC = 5 mV, and EDC = 160 mV. The fabricated GCE/MOFs sensor was used to detect cadmium, lead and copper ions (in ABS) using DPV measurements with a deposition potential of −1.2 V, a deposition time of 120 seconds, a pulse amplitude of 50 mV, a pulse width of 50 ms, a desorption potential of 0.4 V, and a desorption time of 60 seconds.3. Results and discussion
3.1. Characterization of MIL-88B(Fe)-NH2
 | (1) |
![[double bond, length as m-dash]](https://www.rsc.org/images/entities/char_e001.gif) O), but the peak is not clear due to the strong intensity of the C–O peak. The peaks at 1254 cm−1 and 769 cm−1 correspond to the bending vibration of the C sp2–N and C sp2–H bonds, respectively. The above features are observed in the spectra of the TPA-NH2 ligand and synthesized materials. Specially, the characteristic peak at 554 cm−1 (FeO) appears in the MOF's patterns, which represents the coordination bond between Fe3+ and the ligand. As such, FT-IR spectroscopy contributes to confirming the formation of the bond between Fe(III) and the ligand via the oxygen atom in the synthesized MOFs.
O), but the peak is not clear due to the strong intensity of the C–O peak. The peaks at 1254 cm−1 and 769 cm−1 correspond to the bending vibration of the C sp2–N and C sp2–H bonds, respectively. The above features are observed in the spectra of the TPA-NH2 ligand and synthesized materials. Specially, the characteristic peak at 554 cm−1 (FeO) appears in the MOF's patterns, which represents the coordination bond between Fe3+ and the ligand. As such, FT-IR spectroscopy contributes to confirming the formation of the bond between Fe(III) and the ligand via the oxygen atom in the synthesized MOFs.3.2. Electrochemical characteristics of the fabricated MIL-88B(Fe)-NH2
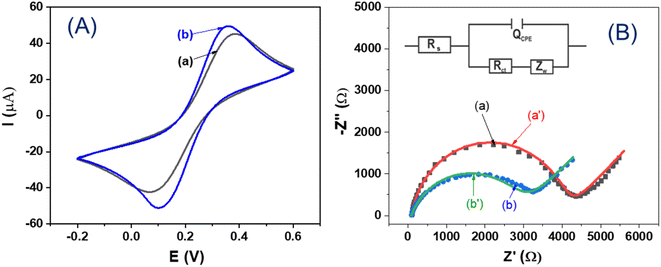
Fig. 4 gives the CV (Fig. 4A) curves and the EIS spectra (Fig. 4B) recorded in a solution containing 0.005 M K3Fe(CN)6, 0.005 M K4Fe(CN)6, and 0.1 M KCl of the GCE (curve a) and the GCE/MIL-88B(Fe)-NH2 (curve b), respectively. It can be seen in Fig. 4A that in the case of the GCE/MIL-88B(Fe)-NH2 (curve b), the anodic and cathodic peak currents are higher than that of the GCE (curve a), indicating an increase in the electroactive area due to the modification of the GCE with MIL-88B(Fe)-NH2. As shown in Fig. 4B, the EIS spectra of the two electrodes have a semicircle characterizing a charge transfer process and a linear region characterizing a diffusion process. An equivalent circuit (Fig. 4B, inset), which includes a solution resistance (Rs), a charge transfer resistance (Rct), a constant phase element (QCPE), and a Warburg diffusion coefficient (W), can be used to simulate the EIS spectra, and the corresponding fitted plots are shown in Fig. 4B (curve (a′) and curve (b′)). The fitted Rct results of the GCE and the GCE/MIL-88B(Fe)-NH2 are 4377 Ω and 3440 Ω, respectively. Thus, the electrochemical performances demonstrate that the MIL-88B(Fe)-NH2 layer drop-casted on GCE is able to remarkably enhance the electrochemical signal of GCE/MIL-88B(Fe)-NH2.3.3. Electrochemical detection of Cd2+, Pb2+, and Cu2+ ions using GCE/MIL-88B(Fe)-NH2
DPV measurements of the GCE and the GCE/MIL-88B(Fe)-NH2 were performed in a solution containing 20 μM Cd2+, 20 μM Pb2+, 20 μM Cu2+ and 0.1 M ABS (pH = 6.0), in order to investigate the ability of using the GCE/MIL-88B(Fe)-NH2 as an electrochemical sensor for the detection of Cd2+, Pb2+, and Cu2+ ions in aqueous solutions, and the obtained results are described in Fig. 5. It can be clearly seen in Fig. 5 (curve a) that with regards to GCE, there are no peaks. In contrast, in Fig. 5 (curve b), with regards to GCE/MIL-88B(Fe)-NH2, there are three peaks at −0.79 V, −0.52 V, and −0.02 V, which are associated with the presence of Cd2+, Pb2+, and Cu2+ ions, respectively.49 The results indicate that the GCE modified with MIL-88B(Fe)-NH2 can be used as an electrochemical sensor for the determination of Cd2+, Pb2+, and Cu2+ ions in aqueous solutions.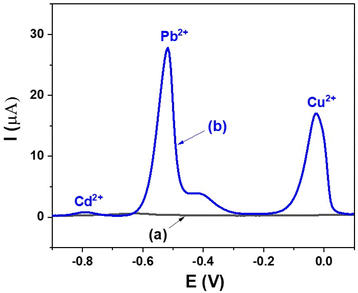 | ||
| Fig. 5 DPV results of (a) GCE and (b) GCE/MIL-88B(Fe)-NH2 measured in a solution containing 20 μM Cd2+, 20 μM Pb2+, 20 μM Cu2+ and 0.1 M ABS (pH = 6.0). | ||
DPV measurements of the GCE/MIL-88B(Fe)-NH2 electrodes were performed in 0.1 M ABS (pH = 6.0) solutions containing 10 μM Cd2+, 10 μM Pb2+, and 10 μM Cu2+ with differential measuring conditions, including potential step, pulse width, and pulse amplitude, in order to investigate the optimization studies for DPV, and the obtained results are described in Fig. 1S (A, B, and C, respectively).† As can be seen in Fig. 1S(A, B, and C),† when the potential step is 5 mV, the pulse width is 50 ms, and the pulse amplitude is 50 mV, the obtained DPV signal is the best for Cd2+, Pb2+, and Cu2+. Therefore, in this work, these measuring conditions were selected for DPV measurements.
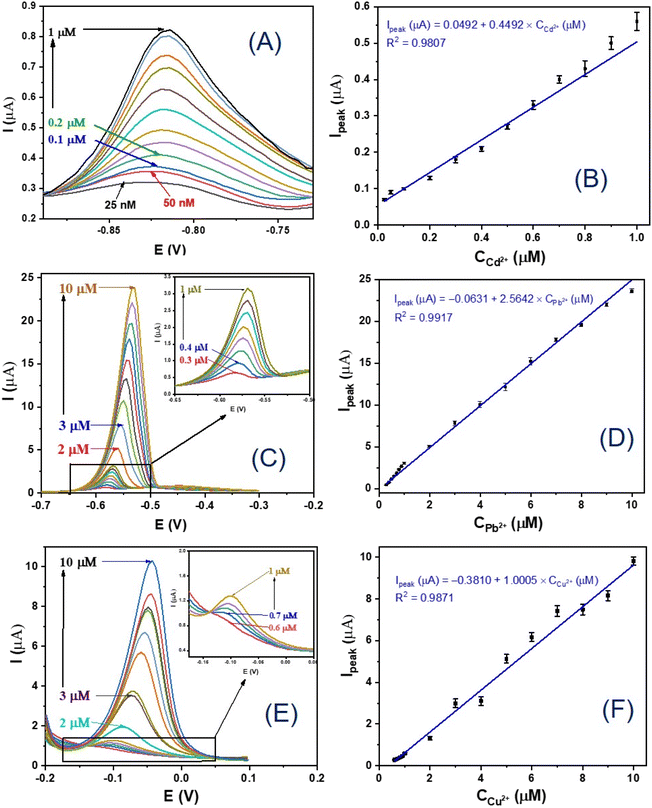
Fig. 6A provides the DPV results of the GCE/MIL-88B(Fe)-NH2 electrodes, which were measured in solutions with different Cd2+ concentrations ranging from 25 nM to 1 μM. It can be observed from Fig. 6A that the peak current of the sensor increases when the Cd2+ concentration increases. Especially, the electrochemical signal is clearly observed even at a low Cd2+ concentration (25 nM). The increase in the Cd2+ concentration leads to an increase in the amount of Cd2+ ions accumulated on the electrode surface and an increase in the peak current. Fig. 6B gives a linear relationship between the peak current (Ipeak) and the Cd2+ concentration (C2+Cd) in the range from 25 nM to 1 μM, which is Ipeak (μA) = 0.0492 + 0.4492 × C2+Cd (μM) with a correlation coefficient of R2 = 0.9807. Similarly, Fig. 6C shows DPV results performed in solutions with different Pb2+ concentrations ranging from 0.3 μM to 10 μM of the GCE/MIL-88B(Fe)-NH2 electrodes. Fig. 6D depicts a linear relationship between the peak current (Ipeak) and the Pb2+ concentration (C2+Pb) in the above range, which is Ipeak (μA) = −0.0631 + 2.5642 × C2+Pb (μM) with a correlation coefficient of R2 = 0.9917. Next, DPV results conducted in solutions with different Cu2+ concentrations ranging from 0.6 μM to 10 μM of the GCE/MIL-88B(Fe)-NH2 electrodes are shown in Fig. 6E. A linear relationship between the peak current (Ipeak) and the Cu2+ concentration (C2+Cu) in the above range, which is Ipeak (μA) = −0.3810 + 1.0005 × C2+Cu (μM) with a correlation coefficient of R2 = 0.9871, is given in Fig. 6F. The detection limit (LoD) of the developed electrochemical sensor for the Cd2+, Pb2+ and Cu2+ ion detections were estimated at S/N > 3.58,59 The obtained results revealed that using the GCE/MIL-88B(Fe)-NH2 electrochemical sensors, the LoD can be obtained at 2.0 × 10⁻¹⁰ M for Cd2+, 1.92 × 10⁻⁷ M for Pb2+ and 3.81 × 10⁻⁷ M for Cu2+, respectively.
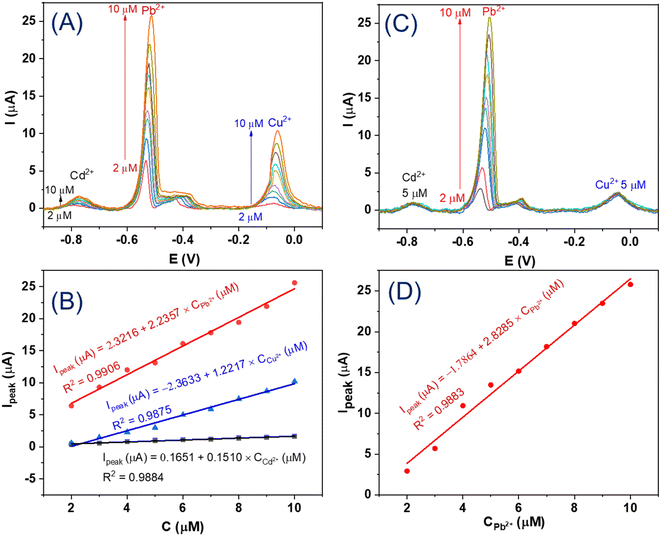
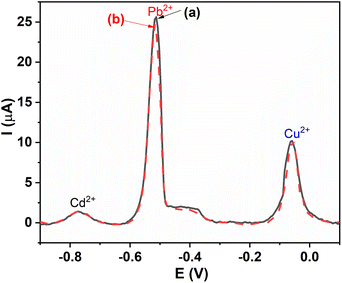
DPV results of the GCE/MIL-88B(Fe)-NH2 electrode in solutions with simultaneous increments in all three ion concentrations (Cd2+, Pb2+, Cu2+: from 2 μM to 10 μM) and their corresponding calibration plots are shown in Fig. 7A and B, respectively. These obtained results indicate that the fabricated sensor has a high reliability of developed chemical sensor. Moreover, the DPV results of the GCE/MIL-88B(Fe)-NH2 electrodes in different solutions containing 5 μM Cd2+ + 5 μM Cu2+, and Pb2+ with concentrations increasing from 2 μM to 10 μM, and the corresponding calibration plot of Pb2+ are depicted in Fig. 7C and D, in the order. Similarly, the DPV responses of the GCE/MIL-88B(Fe)-NH2 electrodes in different solutions containing 5 μM Pb2+ + 5 μM Cu2+, and Cd2+ with concentrations increasing from 2 μM to 10 μM, and the corresponding calibration plot of Cd2+ are exhibited in Fig. 2SA and B,† respectively. The DPV signals shown in Fig. 7C, D, 2SA and B† clearly demonstrate the ability of the obtained sensor to detect the ions in the desired ranges of detection. However, a point which is different from the single metal ion detection (Fig. 6A, C and E) is that a satellite peak appears on the right side of Pb2+ when three heavy metal ions are simultaneously detected (Fig. 7A and C). This satellite peak was demonstrated to be involved in the Pb–Cu interaction.60,61 Moreover, the DPV results of GCE/MIL-88B(Fe)-NH2 electrodes in solutions containing 10 μM Cd2+, 10 μM Pb2+, 10 μM Cu2+, without and with other interfering ions, including Co2+, Ni2+, Zn2+, Cr2O72− (10 μM), and K+, Cl− (20 μM), which are provided in Fig. 8 (curve a and curve b, respectively), show that our electrochemical sensor has good selectivity.
When the fabricated sensor is used to detect the three heavy metal ions using the DPV method, firstly, Cd2+, Pb2+ and Cu2+ ions are adsorbed on the electrode surface and are reduced to form Cd, Pb, and Cu metals, respectively, during the deposition process with a constant negative potential applied (−1.2 V, 120 seconds, in this work); then, through the positive scan from a lower potential to a higher potential (from −0.9 to 0.1 V, in this study), these metals are oxidized, and the peak currents corresponding to their oxidation are recorded. The increase in the concentration of the heavy metal ions leads to the increase in the amount of the heavy metal ions adsorbed on the electrode surface, and the increase in the peak currents recorded after DPV measurements. The MIL-88B(Fe)-NH2 layer with a large surface area has good adsorption capacity for Cd2+, Pb2+, and Cu2+ ions, so ion enrichments on the electrode surface are enhanced, and these ions can still be detected despite the low concentrations. Moreover, the electrocatalytic activity of the MIL-88B(Fe)-NH2 material for the reduction of the metal ions is also an important reason for increasing the electrochemical signals. However, the adsorption capacity and electrocatalytic activity of MIL-88B(Fe)-NH2 are different for different heavy metal ions, leading to the different limits of detection (2.0 × 10⁻¹⁰ M for Cd2+, 1.92 × 10⁻⁷ M for Pb2+ and 3.81 × 10⁻⁷ M for Cu2+, in this work). Moreover, an interesting characteristic is that Cd, Pb, and Cu metals are oxidized at the different potentials which characterize them (−0.79 V for Cd, −0.52 V for Pb, and −0.02 V for Cu, in our work). Therefore, the designed electrochemical sensor can be used to simultaneously detect the three heavy metal ions with high selectivity using DPV method.
As shown in Table 2, the fabricated GCE/MIL-88B(Fe)-NH2 electrochemical sensor in this work is comparable to others summarized in previous works. In general, the MIL-88B(Fe)-NH2-modified GCE possesses high sensitivity (especially in terms of Cd2+ detection), high reliability, and good selectivity. MIL-88B(Fe)-NH2 is a promising MOF in the field of electrochemical sensors for detecting heavy metal ions, such as Cd2+, Pb2+, Cu2+, and others.
| Electrode | Detection | Linear range (μM) | LOD (M) | Reference |
|---|---|---|---|---|
| GCE/NH2-Fe3O4@C | Cd2+ | 0.6–9.0 | 2.31 × 10⁻⁸ | 50 |
| Pb2+ | 1.2–10.0 | 2.85 × 10⁻⁸ | ||
| Cu2+ | 0.4–4.0 | 3.84 × 10⁻⁸ | ||
| GCE/MIL-53(Fe) | Cd2+ | 0.15–0.45 | 1.6 × 10⁻⁸ | 20 |
| GCE/MIL-100(Cr) | Cd2+ | 0–10 | 4.4 × 10⁻⁸ | 51 |
| Pb2+ | 0–10 | 4.8 × 10⁻⁸ | ||
| Cu2+ | 0–10 | 1.1 × 10⁻⁸ | ||
| GCE/Fe-OSA | Cd2+ | 0.02–10.71 | 1.92 × 10⁻⁸ | 52 |
| Pb2+ | 0.04–13.40 | 3.6 × 10⁻⁸ | ||
| Cu2+ | 0.15–15.45 | 8.78 × 10⁻⁸ | ||
| GCE/BiONPs | Cd2+ | 0.8–5.6 | 5 × 10⁻⁸ | 53 |
| Pb2+ | 0.4–2.8 | 1.5 × 10⁻⁷ | ||
| GCE/Pd/PAC | Cd2+ | 0.5–12.8 | 3.8 × 10⁻⁸ | 54 |
| Pb2+ | 0.5–22.4 | 2.5 × 10⁻⁸ | ||
| Cu2+ | 0.5–11.8 | 1.3 × 10⁻⁷ | ||
| GCE/CuNPs/rGO | Cd2+ | 0.05–2.00 | 2.03 × 10⁻⁷ | 55 |
| Pb2+ | 0.05–3.00 | 1.86 × 10⁻⁷ | ||
| Cu2+ | 0.05–2.50 | 1.11 × 10⁻⁷ | ||
| GCE/Chitosan | Cd2+ | 15.9–62.3 | 2.35 × 10⁻⁶ | 56 |
| Pb2+ | 1.99–15.80 | 3.09 × 10⁻⁷ | ||
| Cu2+ | 3.99–39.10 | 8.99 × 10⁻⁷ | ||
| GCE/Ni-MOF | Pb2+ | 0.5–6.0 | 5.08 × 10⁻⁷ | 57 |
| GCE/MIL-88B(Fe)-NH2 | Cd2+ | 0.025–1.000 | 2.0 × 10⁻¹⁰ | This study |
| Pb2+ | 0.3–10.0 | 1.92 × 10⁻⁷ | ||
| Cu2+ | 0.6–10.0 | 3.81 × 10⁻⁷ |
4. Conclusion
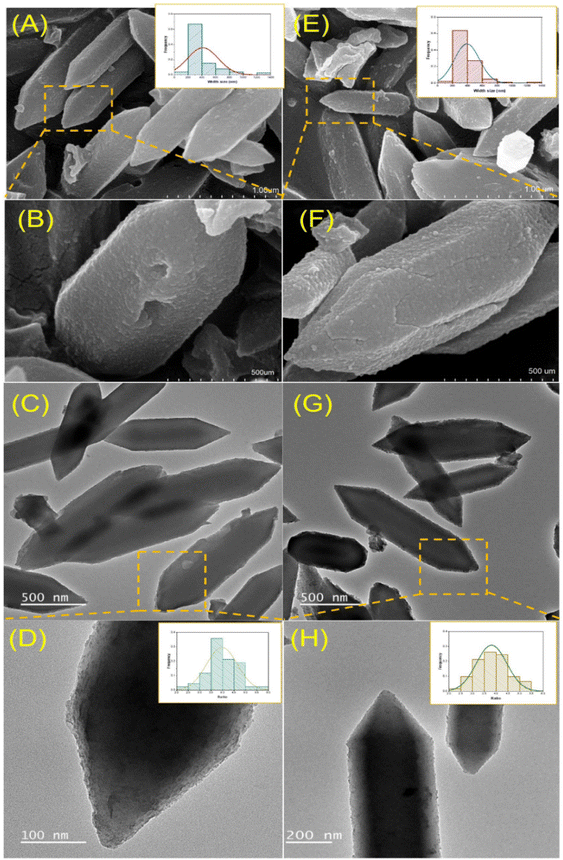
The metal–organic framework MIL-88B(Fe)-NH2 was synthesized via solvothermal method, and characterized by XRD, SEM, TEM, and FT-IR measurements. The impact of parameters on the material formation, including the molar ratio of H2NC6H3-1,4-(COOH)2/Fe(III) and the time reaction, was investigated in detail. Under the optimized experimental conditions, the sharpness and uniformity of the MIL-88B(Fe)-NH2 crystals were obtained. The electrochemical sensor relying on the as-synthesized MIL-88B(Fe)-NH2 indicates the brilliant result for the determination of Cd2+, Pb2+ and Cu2+ with the low limit of detection, the wide linear detection range of concentrations, the high reliability, and the good selectivity. In addition, the fabrication method is simple and it can be extended for screen printing method for electrochemical sensor application in the disposal of heavy metal ions. Combining these above outcomes imply that MIL-88B(Fe)-NH2 is capable of becoming a potential candidate applied as an electrochemical sensor for the detection of heavy metal ions in practice.Conflicts of interest
There are no conflicts to declare.Acknowledgements
This research was funded by the Vietnam Ministry of Education and Training (MOET) under grant number CT 2022.04.BKA.03.References
- S. Li and F. Huo, Metal-organic framework composites: from fundamentals to applications, Nanoscale, 2015, 7, 7482–7501 RSC.
- O. K. Farha, I. Eryazici, N. C. Jeong, B. G. Hauser, C. E. Wilmer and A. A. Sarjeant, et al., Metal–Organic Framework Materials with Ultrahigh Surface Areas: Is the Sky the Limit?, J. Am. Chem. Soc., 2012, 134, 15016–15021 CrossRef CAS PubMed.
- X. Fang, B. Zong and S. Mao, Metal-Organic Framework-Based Sensors for Environmental Contaminant Sensing, Nanomicro Lett., 2018, 10, 64 Search PubMed.
- Y. Peng, V. Krungleviciute, I. Eryazici, J. T. Hupp, O. K. Farha and T. Yildirim, Methane Storage in Metal–Organic Frameworks: Current Records, Surprise Findings, and Challenges, J. Am. Chem. Soc., 2013, 135, 11887–11894 CrossRef CAS PubMed.
- T. M. McDonald, J. A. Mason, X. Kong, E. D. Bloch, D. Gygi and A. Dani, et al., Cooperative insertion of CO2 in diamine-appended metal-organic frameworks, Nature, 2015, 519, 303–308 CrossRef CAS.
- P. Horcajada, C. Serre, M. Vallet-Regí, M. Sebban, F. Taulelle and G. Férey, Metal–Organic Frameworks as Efficient Materials for Drug Delivery, Angew. Chem., Int. Ed., 2006, 45, 5974–5978 CrossRef CAS PubMed.
- A. R. Chowdhuri, D. Laha, S. Chandra, P. Karmakar and S. K. Sahu, Synthesis of multifunctional upconversion NMOFs for targeted antitumor drug delivery and imaging in triple negative breast cancer cells, Chem. Eng. J., 2017, 319, 200–211 CrossRef CAS.
- X. Cui, K. Chen, H. Xing, Q. Yang, R. Krishna and Z. Bao, et al., Pore chemistry and size control in hybrid porous materials for acetylene capture from ethylene, Science, 2016, 353, 141–144 CrossRef CAS PubMed.
- L. Meng, Q. Cheng, C. Kim, W.-Y. Gao, L. Wojtas and Y.-S. Chen, et al., Crystal Engineering of a Microporous, Catalytically Active fcu Topology MOF Using a Custom-Designed Metalloporphyrin Linker, Angew. Chem., Int. Ed., 2012, 51, 10082–10085 CrossRef CAS PubMed.
- K. M. Park, H. Kim, J. Murray, J. Koo and K. Kim, A facile preparation method for nanosized MOFs as a multifunctional material for cellular imaging and drug delivery, Supramol. Chem., 2017, 29, 441–445 CrossRef CAS.
- Z. Hu, B. J. Deibert and J. Li, Luminescent metal–organic frameworks for chemical sensing and explosive detection, Chem. Soc. Rev., 2014, 43, 5815–5840 RSC.
- X. Lian and B. Yan, Phosphonate MOFs Composite as Off–On Fluorescent Sensor for Detecting Purine Metabolite Uric Acid and Diagnosing Hyperuricuria, Inorg. Chem., 2017, 56, 6802–6808 CrossRef CAS PubMed.
- L. Cui, J. Wu, J. Li and H. Ju, Electrochemical Sensor for Lead Cation Sensitized with a DNA Functionalized Porphyrinic Metal–Organic Framework, Anal. Chem., 2015, 87, 10635–10641 CrossRef CAS PubMed.
- D. Duan, J. Ye, X. Cai and K. Li, Cobalt (II)-ion-exchanged Zn-bio-MOF-1 derived CoS/ZnS composites modified electrochemical sensor for chloroneb detection by differential pulse voltammetry, Microchim. Acta, 2021, 188, 1–10 CrossRef PubMed.
- P. Kumar, K.-H. Kim, P. K. Mehta, L. Ge and G. Lisak, Progress and challenges in electrochemical sensing of volatile organic compounds using metal-organic frameworks, Crit. Rev. Environ. Sci. Technol., 2019, 49, 2016–2048 CrossRef CAS.
- H. He, S.-Q. Wang, Z.-Y. Han, X.-H. Tian, W.-W. Zhang and C.-P. Li, et al., Construction of electrochemical aptasensors with Ag (I) metal–organic frameworks toward high-efficient detection of ultra-trace penicillin, Appl. Surf. Sci., 2020, 531, 147342 CrossRef CAS.
- M. Chen, N. Gan, Y. Zhou, T. Li, Q. Xu and Y. Cao, et al., An electrochemical aptasensor for multiplex antibiotics detection based on metal ions doped nanoscale MOFs as signal tracers and RecJf exonuclease-assisted targets recycling amplification, Talanta, 2016, 161, 867–874 CrossRef CAS PubMed.
- J. Song, M. Huang, X. Lin, S. F. Y. Li, N. Jiang and Y. Liu, et al., Novel Fe-based metal–organic framework (MOF) modified carbon nanofiber as a highly selective and sensitive electrochemical sensor for tetracycline detection, Chem. Eng. J., 2022, 427, 130913 CrossRef CAS.
- X. Fang, X. Chen, Y. Liu, Q. Li, Z. Zeng and T. Maiyalagan, et al., Nanocomposites of Zr (IV)-based metal–organic frameworks and reduced graphene oxide for electrochemically sensing ciprofloxacin in water, ACS Appl. Nano Mater., 2019, 2, 2367–2376 CrossRef CAS.
- H. V. Tran, H. T. M. Dang, L. T. Tran, C. Van Tran and C. D. Huynh, Metal-Organic Framework MIL-53 (Fe): Synthesis, Electrochemical Characterization, and Application in Development of a Novel and Sensitive Electrochemical Sensor for Detection of Cadmium Ions in Aqueous Solutions, Adv. Polym. Technol., 2020, 2020, 6279278 CrossRef.
- M. Ding, X. Cai and H.-L. Jiang, Improving MOF stability: approaches and applications, Chem. Sci., 2019, 10, 10209–10230 RSC.
- S. Bauer, C. Serre, T. Devic, P. Horcajada, J. Marrot and G. Ferey, et al., High-throughput assisted rationalization of the formation of metal organic frameworks in the iron (iii) aminoterephthalate solvothermal system, Inorg. Chem., 2008, 47, 7568–7576 CrossRef CAS PubMed.
- S. Yuan, L. Feng, K. Wang, J. Pang, M. Bosch and C. Lollar, et al., Stable Metal-Organic Frameworks: Design, Synthesis, and Applications, Adv. Mater., 2018, 30, 1704303 CrossRef.
- L. Paseta, B. Seoane, D. Julve, V. Sebastián, C. Téllez and J. Coronas, Accelerating the Controlled Synthesis of Metal–Organic Frameworks by a Microfluidic Approach: A Nanoliter Continuous Reactor, ACS Appl. Mater. Interfaces, 2013, 5, 9405–9410 CrossRef CAS.
- T. Van Tran, D. T. C. Nguyen, H. T. Le, L. G. Bach, D.-V. N. Vo and T.-U. T. Dao, et al., Effect of thermolysis condition on characteristics and nonsteroidal anti-inflammatory drugs (NSAIDs) absorbability of Fe-MIL-88B-derived mesoporous carbons, J. Environ. Chem. Eng., 2019, 7, 103356 CrossRef.
- M. A. Yanuar and J. Kim, FeOF nanoparticles wrapped by graphitic carbon layers prepared from Fe-MIL-88B as a cathode material for sodium-ion batteries, Carbon, 2019, 149, 483–491 CrossRef CAS.
- H. Zhang, S. Chen, H. Zhang, X. Fan, C. Gao and H. Yu, et al., Carbon nanotubes-incorporated MIL-88B-Fe as highly efficient Fenton-like catalyst for degradation of organic pollutants, Front. Environ. Sci. Eng., 2019, 13, 18 CrossRef.
- Y. Wang, Z. Zhong, Y. Muhammad, H. He, Z. Zhao and S. Nie, et al., Defect engineering of NH2-MIL-88B (Fe) using different monodentate ligands for enhancement of photo-Fenton catalytic performance of acetamiprid degradation, Chem. Eng. J., 2020, 398, 125684 CrossRef CAS.
- X. Liao, F. Wang, Y. Wang, W. Wei, Z. Xiao and H. Liu, et al., Functionalized g-C3N4 sheets assisted synthesis of growth-oriented MIL-88B-Fe with rod-like structure: Upgrading framework photo-catalytic performance and stability, Appl. Surf. Sci., 2020, 503, 144089 CrossRef CAS.
- M. P. Waalkes, Cadmium carcinogenesis in review, J. Inorg. Biochem., 2000, 79, 241–244 CrossRef CAS.
- M. Boskabady, N. Marefati, T. Farkhondeh, F. Shakeri, A. Farshbaf and M. H. Boskabady, The effect of environmental lead exposure on human health and the contribution of inflammatory mechanisms, a review, Environ. Int., 2018, 120, 404–420 CrossRef CAS PubMed.
- M. Angelova, S. Asenova, V. Nedkova and R. Koleva-Kolarova, Copper in the human organism, Trakia J. Sci., 2011, 9, 88–98 Search PubMed.
- X. Y. Xu and B. Yan, Intelligent molecular searcher from logic computing network based on Eu(III) functionalized UMOFs for environmental monitoring, Adv. Funct. Mater., 2017, 27, 1700247 CrossRef.
- J. Hao, F. Liu, N. Liu, M. Zeng, Y. Song and L. Wang, Ratiometric fluorescent detection of Cu2+ with carbon dots chelated Eu-based metal-organic frameworks, Sens. Actuators, B, 2017, 245, 641–647 CrossRef CAS.
- Y. Wang, Y. Wu, J. Xie and X. Hu, Metal–organic framework modified carbon paste electrode for lead sensor, Sens. Actuators, B, 2013, 177, 1161–1166 CrossRef CAS.
- J.-C. Jin, J. Wu, G.-P. Yang, Y.-L. Wu and Y.-Y. Wang, A microporous anionic metal–organic framework for a highly selective and sensitive electrochemical sensor of Cu 2+ ions, Chem. Commun., 2016, 52, 8475–8478 RSC.
- S. E. A. Elashery, N. F. Attia and H. Oh, Design and fabrication of novel flexible sensor based on 2D Ni-MOF nanosheets as a preliminary step toward wearable sensor for onsite Ni (II) ions detection in biological and environmental samples, Anal. Chim. Acta, 2022, 1197, 339518 CrossRef CAS PubMed.
- S. E. A. Elashery and H. Oh, Exploitation of 2D Cu-MOF nanosheets as a unique electroactive material for ultrasensitive Cu(II) ion estimation in various real samples, Anal. Chim. Acta, 2021, 1181, 338924 CrossRef CAS PubMed.
- M. E. B. Mohamed, N. F. Attia and S. E. A. Elashery, Greener and facile synthesis of hybrid nanocomposite for ultrasensitive iron (II) detection using carbon sensor, Microporous Mesoporous Mater., 2021, 313, 110832 CrossRef CAS.
- E. Y. Frag, N. M. Mohamed and S. E. A. Elashery, Exploitation of o-benzoyl benzoic acid as an efficient electroactive material for selective determination of Cr (III) ions in pharmaceutical samples and industrial waste water using carbon sensor, Anal. Chim. Acta, 2021, 1154, 338322 CrossRef CAS PubMed.
- E. Aghaei and M. Haghighi, Effect of crystallization time on properties and catalytic performance of nanostructured SAPO-34 molecular sieve synthesized at high temperatures for conversion of methanol to light olefins, Powder Technol., 2015, 269, 358–370 CrossRef CAS.
- N. Al-Janabi, P. Hill, L. Torrente-Murciano, A. Garforth, P. Gorgojo and F. Siperstein, et al., Mapping the Cu-BTC metal–organic framework (HKUST-1) stability envelope in the presence of water vapour for CO2 adsorption from flue gases, Chem. Eng. J., 2015, 281, 669–677 CrossRef CAS.
- X. Li, J. Zhang, W. Shen and S. Xu, Rapid synthesis of metal-organic frameworks MIL-53 (Cr), Mater. Lett., 2019, 255, 126519 CrossRef CAS.
- X. Li, W. Guo, Z. Liu, R. Wang and H. Liu, Fe-based MOFs for efficient adsorption and degradation of acid orange 7 in aqueous solution via persulfate activation, Appl. Surf. Sci., 2016, 369, 130–136 CrossRef CAS.
- L. Wang, S. Duan, M. Fang, J. Liu, J. He and J. Li, et al., Surface modification route to prepare novel polyamide@NH2 MIL-88B nanocomposite membranes for water treatment, RSC Adv., 2016, 6, 71250–71261 RSC.
- Y. L. Liu, X. J. Zhao, X. X. Yang and Y. F. Li, A nanosized metal–organic framework of Fe-MIL-88NH2 as a novel peroxidase mimic used for colorimetric detection of glucos, Analyst, 2013, 138, 4526–4531 RSC.
- M.-H. Pham, G.-T. Vuong, A.-T. Vu and T.-O. Do, Novel Route to Size-Controlled Fe–MIL-88B–NH2 Metal–Organic Framework Nanocrystals, Langmuir, 2011, 27, 15261–15267 CrossRef CAS PubMed.
- Y. Li, J. Jiang, Y. Fang, Z. Cao, D. Chen and N. Li, et al., TiO2 Nanoparticles Anchored onto the Metal-Organic Framework NH2-MIL-88B(Fe) as an Adsorptive Photocatalyst with Enhanced Fenton-like Degradation of Organic Pollutants under Visible Light Irradiation, ACS Sustainable Chem. Eng., 2018, 6, 16186–16197 CrossRef CAS.
- H. Sun, C. Wang, Y. Xu, D. Dai, X. Deng and H. Gao, A Novel Electrochemical Sensor Based on A Glassy Carbon Electrode Modified with GO/MnO for Simultaneous Determination of Trace Cu(II) and Pb(II) in Environmental Water, ChemistrySelect, 2019, 4, 11862–11871 CrossRef CAS.
- F. Bai, X. Zhang, X. Hou, H. Liu, J. Chen and T. Yang, Individual and simultaneous voltammetric determination of Cd (II), Cu (II) and Pb (II) applying amino functionalized Fe3O4@ carbon microspheres modified electrode, Electroanalysis, 2019, 31, 1448–1457 CrossRef.
- D. Wang, Y. Ke, D. Guo, H. Guo, J. Chen and W. Weng, Facile fabrication of cauliflower-like MIL-100(Cr) and its simultaneous determination of Cd2+, Pb2+, Cu2+ and Hg2+ from aqueous solution, Sens. Actuators, B, 2015, 216, 504–510 CrossRef CAS.
- H. Sha, Y. Wu and Y. Fan, A Fe-OSA/Nafion composite film-decorated glassy carbon electrode as a sensor for detection of Pb (II), Cd (II) and Cu (II), Anal. Methods, 2017, 9, 5618–5631 RSC.
- C. Hao, Y. Shen, J. Shen, K. Xu, X. Wang and Y. Zhao, et al., A glassy carbon electrode modified with bismuth oxide nanoparticles and chitosan as a sensor for Pb (II) and Cd (II), Microchim. Acta, 2016, 183, 1823–1830 CrossRef CAS.
- P. Veerakumar, V. Veeramani, S. M. Chen, R. Madhu and S. B. Liu, Palladium nanoparticle incorporated porous activated carbon: electrochemical detection of toxic metal ions, ACS Appl. Mater. Interfaces, 2016, 8, 1319–1326 CrossRef CAS.
- D. Li, C. Wang, H. Zhang, Y. Sun, Q. Duan and J. Ji, et al., A highly effective copper nanoparticle coupled with RGO for electrochemical detection of heavy metal ions, Int. J. Electrochem. Sci., 2017, 12, 10933–10945 CrossRef CAS.
- C. Martínez-Huitle, N. S. Fernandes, M. Cerro-Lopez and M. Quiroz, Determination of trace metals by differential pulse voltammetry at chitosan modified electrodes, Port. Electrochim. Acta, 2010, 28, 39–49 CrossRef.
- H. Guo, Z. Zheng, Y. Zhang, H. Lin and Q. Xu, Highly selective detection of Pb2+ by a nanoscale Ni-based metal–organic framework fabricated through one-pot hydrothermal reaction, Sens. Actuators, B, 2017, 248, 430–436 CrossRef CAS.
- H. V. Tran, B. Piro, S. Reisberg, L. D. Tran, H. T. Duc and M. C. Pham, Label-free and reagentless electrochemical detection of microRNAs using a conducting polymer nanostructured by carbon nanotubes: application to prostate cancer biomarker miR-141, Biosens. Bioelectron., 2013, 49, 164–169 CrossRef CAS PubMed.
- H. V. Tran, C. D. Huynh, T. D. Le and H. S. Hoang, Hydroxyapatite Nano-Rods/Chitosan Modified Glassy Carbon Electrode for Cu(II) Ions Determination, Electron. Mater. Lett., 2020, 16, 396–403 CrossRef CAS.
- Z. Tan, W. Wu, C. Feng, H. Wu and Z. Zhang, Simultaneous determination of heavy metals by an electrochemical method based on a nanocomposite consisting of fluorinated graphene and gold nanocage, Mikrochim. Acta, 2020, 187, 414 CrossRef CAS.
- Z. Zhai, N. Huang, H. Zhuang, L. Liu, B. Yang and C. Wang, et al., A diamond/graphite nanoplatelets electrode for anodic stripping voltammetric trace determination of Zn(II), Cd(II), Pb(II) and Cu(II), Appl. Surf. Sci., 2018, 457, 1192–1201 CrossRef CAS.
Footnote |
| † Electronic supplementary information (ESI) available. See DOI: https://doi.org/10.1039/d3ra02828c |
| This journal is © The Royal Society of Chemistry 2023 |

