 Open Access Article
Guava-fruit based synthesis of carbon quantum dots for spectrofluorometric quantitative analysis of risperidone in spiked human plasma and pharmaceutical dosage forms
Saleh I. Alaqela,
Omeima Abdullahb,
Adnan Alharbic,
Yusuf S. Althobaiti de,
Mansour S. Alturkif,
Sherif Ramzy
 *g and
Atiah H. Almalkidh
aDepartment of Pharmaceutical Chemistry, Faculty of Pharmacy, Northern Border University, Rafha 91911, Saudi Arabia
bPharmaceutical Chemistry Department, College of Pharmacy, Umm Al-Qura University, Makkah, Saudi Arabia
cClinical Pharmacy Department, College of Pharmacy, Umm Al-Qura University, Makkah, Saudi Arabia. E-mail: assharbi@uqu.edu.sa
dAddiction and Neuroscience Research Unit, Health Science Campus, Taif University, P.O. Box 11099, Taif 21944, Saudi Arabia
eDepartment of Pharmacology and Toxicology, Taif University, P.O. Box 11099, Taif 21944, Saudi Arabia
fDepartment of Pharmaceutical Chemistry, College of Clinical Pharmacy, Imam Abdulrahman Bin Faisal University, 34212 Dammam, Saudi Arabia
gPharmaceutical Analytical Chemistry Department, Faculty of Pharmacy, Al-Azhar University, 11751 Nasr City, Cairo, Egypt. E-mail: ssherif14@azhar.edu.eg
hDepartment of Pharmaceutical Chemistry, College of Pharmacy, Taif University, P.O. Box 11099, Taif 21944, Saudi Arabia
First published on 13th June 2023
Abstract
Autism is one of the most pressing issues facing the international community in recent years, particularly in Middle Eastern countries. Risperidone is a selective serotonin type 2 and dopamine type 2 receptor antagonist. It is the most administered antipsychotic medication in children with autism-related behavioral disorders. Therapeutic monitoring of risperidone may improve safety and efficacy in autistic individuals. The main objective of this work was to develop a highly sensitive green fitted method for the determination of risperidone in the plasma matrix and pharmaceutical dosage forms. Novel water-soluble N–carbon quantum dots were synthesized from guava fruit, a natural green precursor, and used for determination of risperidone based on quenching fluorescence spectroscopy phenomena. The synthesized dots were characterized by transmission electron microscopy and Fourier transform infrared spectroscopy. The synthesized N–carbon quantum dots exhibited aquantum yield of 26.12% and showed a strong emission fluorescence peak at 475 nm when excited at 380 nm. The fluorescence intensity of the N–carbon quantum dots decreased with increasing risperidone concentration, indicating that the fluorescence quenching was concentration dependent. The presented method was carefully optimized and validated according to the guidelines of ICH, and it demonstrated good linearity in a concentration range of 5–150 ng mL−1. With a LOD of 1.379 ng mL−1 and a LOQ of 4.108 ng mL−1, the technique was extremely sensitive. Due to the high sensitivity of the proposed method, it could be effectively used for the determination of risperidone in the plasma matrix. The proposed method was compared with the previously reported HPLC method in terms of sensitivity and green chemistry metrics. The proposed method proved to be more sensitive and compatible with the principles of green analytical chemistry.
1. Introduction
Autism, commonly known as autism spectrum disorder (ASD), is one of the most pressing issues facing the international community in recent years, particularly in Middle Eastern countries where prevalence rates have skyrocketed.1–3 According to WHO, one in 100 children worldwide has autism, and prevalence has increased by 178% since 2000. The increase could be attributed more to increased awareness and screening than to the fact that autism has become more common.3 Autism prevalence has increased significantly in the Middle East in recent years, owing to increased societal awareness campaigns, stigma reduction, and the availability of qualified medical specialists.4–8 Qatar, the United Arab Emirates, Oman, Bahrain, and Saudi Arabia are now the five countries with the highest autism prevalence in the world, with rates over 100 per 10![[thin space (1/6-em)]](https://www.rsc.org/images/entities/char_2009.gif) 000 people. Kuwait, Jordan, Syria, Palestine, Libya, Yemen, Sudan, Lebanon, Egypt, and Iraq are among the top twenty countries.3 Autism is a neurodevelopmental disorder characterized by difficulties in social communication and repetitive and restrictive interests. Reportedly, there is no single cause and no specific medication to address the underlying symptoms.9–11 Evidence suggests that genetics, having older parents, premature birth, and consanguineous marriages may increase a child's risk for autism.11 Treatment approaches are often collaborative, tailored to the individual, and aim to alleviate symptoms that interfere with daily functioning. These approaches include behavioral, educational, social, psychological, and pharmacological treatments.10,11 Risperidone and aripiprazole, atypical antipsychotics, are FDA-approved medications for autism-related irritability.12
000 people. Kuwait, Jordan, Syria, Palestine, Libya, Yemen, Sudan, Lebanon, Egypt, and Iraq are among the top twenty countries.3 Autism is a neurodevelopmental disorder characterized by difficulties in social communication and repetitive and restrictive interests. Reportedly, there is no single cause and no specific medication to address the underlying symptoms.9–11 Evidence suggests that genetics, having older parents, premature birth, and consanguineous marriages may increase a child's risk for autism.11 Treatment approaches are often collaborative, tailored to the individual, and aim to alleviate symptoms that interfere with daily functioning. These approaches include behavioral, educational, social, psychological, and pharmacological treatments.10,11 Risperidone and aripiprazole, atypical antipsychotics, are FDA-approved medications for autism-related irritability.12
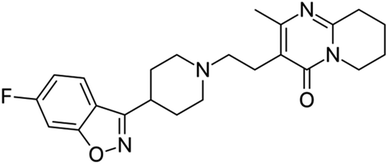
Risperidone (RPD), Fig. 1, is a selective serotonin type 2 and dopamine type 2 receptor antagonist. It is the most commonly administered antipsychotic medication in children and adolescents for the treatment of schizophrenia symptoms as well as to manage irritability, tantrums, aggression, and self-injury in autistic patients.13,14 Its treatment has been associated with significant adverse effects such as weight gain, sedation, extrapyramidal symptoms, and prolactin increase. Clinical studies have shown that higher RPD plasma concentrations are associated with more side effects and increased efficacy in autistic patients. It has been suggested that therapeutic monitoring of RPD can improve safety and efficacy in autistic individuals by assessing compliance and identifying the drug levels that may be low, resulting in therapeutic failure, or high, resulting in adverse effects.15
Analytical techniques for the detection of drugs in biological samples require certain characteristics in terms of detection limits of the equipment used and ease of use in small laboratories with limited facilities. Along with adhering to green analytical chemistry concepts to aid the global trend in achieving sustainable development goals and addressing climate changes.
Several techniques for determining ARP in various matrices have been published in the literature, including chromatographic,16–30 electrochemical,31–38 and spectroscopic39–44 methods. These techniques have significant drawbacks, such as being time-consuming, requiring sample pretreatment before measurement, being costly and unavailable in small laboratories, providing poor sensitivity, and not adhering to green analytical chemistry principles. The spectrofluorimetric approach, on the other hand, offers the advantages of being easy, time saving, very sensitive, and environmentally friendly.
Carbon quantum dots (CQDs) are fluorescent semiconductor nanoparticles that have recently been used in pharmaceutical and biomedical analysis by measuring the enhancement or quenching of the fluorescent signal from the CQDs as a result of an interaction of the CQDs with the compound of interest.45–50 Originally, CQDs were prepared from primary chemical precursors such as citric acid, polyethyleneimine, zinc oxide, phenolic resins, and ethylene glycol, which were incompatible with concepts of green analytical chemistry.51–54 Therefore, scientists have recently focused on finding environmentally friendly precursors from nature as substitutes, such as biomass wastes and plant-derived pharmaceuticals, because they are environmentally friendly, widely available, biocompatible, and rich in low-cost renewable raw materials (rich in C, H, N, and O atoms) such as polysaccharides, proteins, nucleic acids, and phospholipids.55–59
The main objective of this work is to develop simple green fitted method for the analysis of RPD in biological fluids and pharmaceutical dosage forms with higher sensitive detection limits. To achieve this goal, novel water-soluble N-CQDs were synthesized from guava fruit, a natural green precursor, and used for RPD determination based on quenching fluorescence spectroscopy phenomena. The synthesized N-CQDs showed a strong emission fluorescence peak at 475 nm when excited at 380 nm. The fluorescence intensity of the prepared dots was decreased dynamically with increasing RPD concentration. The proposed method was efficiently used for the estimation of RPD up to nano-gram levels in the plasma matrix and the pharmaceutical dosage forms. The suitability of the method for the analysis of RPD was verified using ICH guideline for validation of analytical procedures Q2(R1).60 Linearity, limits of detection (LOD) and quantitation (LOQ), accuracy, precision, robustness, and specificity were all investigated as validation characteristics.
Furthermore, the green fitness of the described method was measured using the analytical eco-scale and the analytical greenness metric (AGREE). The described method exhibited an agreement with the green analytical chemistry principles in terms of the common green metric values.
2. Experimental
2.1. Materials and chemicals
RPD powder was supplied by Apex pharma (Egypt). Apexidone® tablets (0.5 mg RPD per tablet) and Apexidone® syrup (1 mg RPD per 1 mL) were obtained from a local pharmacy. All chemicals used during the analysis were of high analytical purity and were provided by El Nasr Company (Egypt). The water used for the procedure was fresh double distilled. The guava fruits were purchased from the Egyptian market. Several buffer solutions with different pH values were prepared in accordance with the US Pharmacopoeia.2.2. Instrumentation
Fluorescence measurements were performed using a Jasco FP-6200 spectrofluorometer (Japan). UV-visible measurements were performed using a Shimadzu UV-visible 1800 spectrophotometer (Japan). Transmission electron microscopy (TEM) images were acquired using a JEOL JEM-M2100 transmission electron microscope (USA). Fourier transform infrared (FTIR) spectrum was acquired using a PerkinElmer FTIR spectrophotometer (USA).2.3. Standard solutions
A standard stock solution (100 μg mL−1) of RPD was prepared by transferring 10 mg of drug powder with 10 mL ethanol and 40 mL water into a 100 mL volumetric flask, shaking till dissolved, and then filling the flasks to the mark with water. A working solution (1 μg mL−1) was prepared from their stock solution by further dilution with water.2.4. Synthesis of N-CQDs
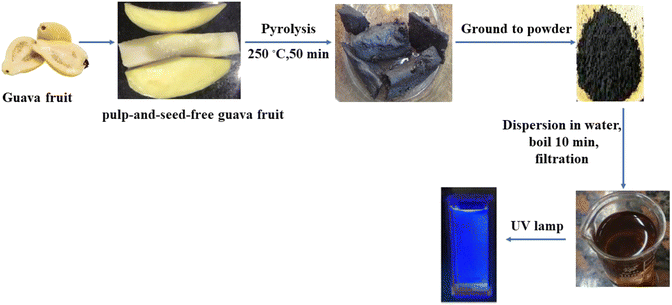
The guava fruit flesh (pulp-and-seed-free) was cut into slices and carbonized in an electric oven at 250 °C for 50 minutes. The obtained product was allowed to cool before being ground into a fine powder. A weight equivalent to 200 mg of the product powder was dissolved in 60 mL double-distilled water and boiled for 10 minutes before being centrifuged for 20 minutes. The obtained yellow solution was then filtered into a 100 mL volumetric flask, which was then filled with double-distilled water to the desired volume (Fig. 2).2.5. Procedures
2.5.3.1. Apexidone® tablets. Ten Apexidone® tablets, each containing 0.5 mg RPD, were weighed and ground finely. An exact weight of powder corresponding to one tablet was added to a 100 mL volumetric flask with 10 mL ethanol and 40 mL water. The flask was vigorously shaken for 20 minutes, filtered, and adjusted to 100 mL with water. After further dilution with water, five samples of varying concentrations were prepared, and the procedure described above was followed.
2.5.3.2. Apexidone® syrup. 5 mL of Apexidone® syrup containing 5 mg RPD were transferred into a 100 mL volumetric flask and made to the volume with water. After further dilution with water, five samples of varying concentrations were prepared, and the procedure described above was followed.
3. Results & discussion
3.1. Characterization of N-CQDs
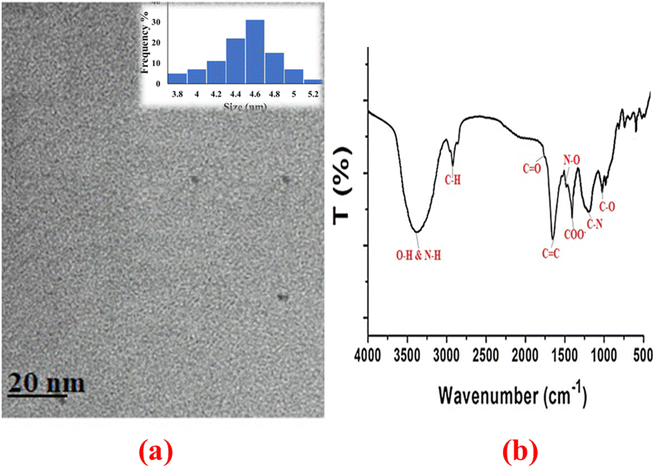
The size diameter of N-CQDs was determined using TEM. The particle size distribution was in the range 3.8 to 5.2 nm with an average diameter of 4.5 (Fig. 3a).58,59The functional groups on N-CQDs were studied using Fourier transformed infrared (FT-IR) spectroscopy. Peaks at 2919 cm−1, 1728 cm−1, 1630 cm−1, 1512 cm−1, 1378 cm−1, 1265 cm−1, and 1022 cm−1 were associated to C–H, C![[double bond, length as m-dash]](https://www.rsc.org/images/entities/char_e001.gif) O, C
O, C![[double bond, length as m-dash]](https://www.rsc.org/images/entities/char_e001.gif) C, N–O, COO–, C–N, and C–O groups, whereas broad peak at 3376 cm−1 was related to O–H and N–H groups (Fig. 3b).59,61
C, N–O, COO–, C–N, and C–O groups, whereas broad peak at 3376 cm−1 was related to O–H and N–H groups (Fig. 3b).59,61
3.2. Spectral properties of N-CQDs
UV-vis and fluorescence spectroscopy were used to study the spectral properties of N-CQDs. The UV-vis absorption spectra of the N-CQDs showed a maximum peak at 283 nm and a tail that extended into the visible region. This corresponds to the π–π* electronic transition of the C![[double bond, length as m-dash]](https://www.rsc.org/images/entities/char_e001.gif) C band and the n–π* transition of the C
C band and the n–π* transition of the C![[double bond, length as m-dash]](https://www.rsc.org/images/entities/char_e001.gif) O band (Fig. 4a).58 Moreover, N-CQDs emit a strong emission fluorescence peak at 475 nm when excited at 380 nm (Fig. 4b). An excitation-dependent character of N-CQDs was also investigated by shifting the excitation wavelength from 380 to 450 nm. Shifting the excitation to higher wavelengths resulted in a red shift of the emission fluorescence peak from 475 to 515 nm with a significant decrease in fluorescence intensity, confirming the excitation-dependent emission of N-CQDs, which is a characteristic property of CQDs (Fig. 4c).58,61
O band (Fig. 4a).58 Moreover, N-CQDs emit a strong emission fluorescence peak at 475 nm when excited at 380 nm (Fig. 4b). An excitation-dependent character of N-CQDs was also investigated by shifting the excitation wavelength from 380 to 450 nm. Shifting the excitation to higher wavelengths resulted in a red shift of the emission fluorescence peak from 475 to 515 nm with a significant decrease in fluorescence intensity, confirming the excitation-dependent emission of N-CQDs, which is a characteristic property of CQDs (Fig. 4c).58,61
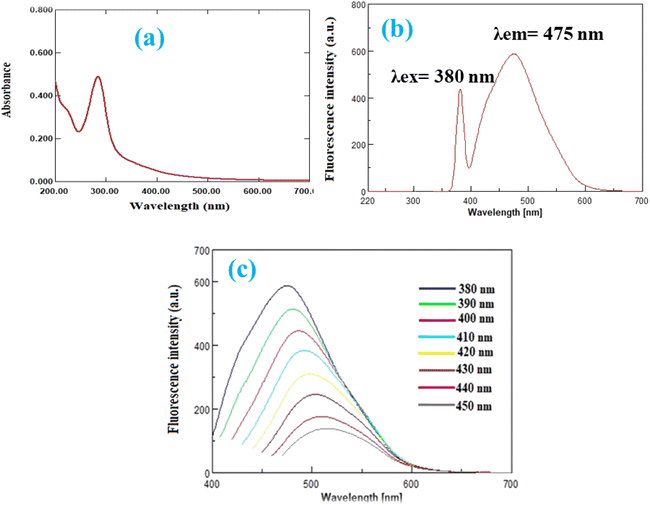 | ||
| Fig. 4 (a) UV-vis absorption spectra of N-CQDs, (b) fluorescence spectra of N-CQDs, and (c) excitation dependent emission spectra of N-CQDs. | ||
The quantum yield of N-CQDs was calculated using a comparative single-point method with quinine sulfate as a fluorescence reference standard in 0.01 M H2SO4 at an excitation wavelength of 380 nm according to the following equation62,63
3.3. Reaction of RPD with N-CQDs
The fluorescence intensity of N-CQDs gradually decreases with increasing RPD concentration, as shown in Fig. 5a, indicating that fluorescence quenching is concentration dependent.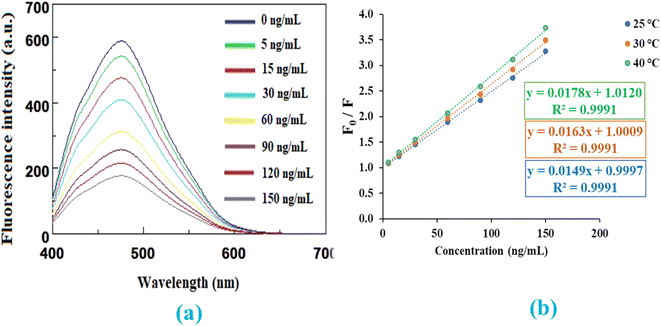 | ||
| Fig. 5 (a) Quenching reaction of N-CQDs with different concentrations of RPD, and (b) Stern–Volmer plot at different temperature. | ||
To determine whether the quenching mechanism of RPD-NCQD interaction is dynamic or static, the calibration curve was plotted (between F0/F and Q) at different temperatures (25 °C, 30 °C, and 40 °C) using the Stern–Volmer equation64,65
In dynamic quenching, the slope (Stern–Volmer quenching constant) increases with increasing temperature, whereas in static quenching, the slope decreases with increasing temperature. As shown in Fig. 5b, the slope value increased as temperature increased, implying that the quenching mechanism of RPD-NCQD interaction is dynamic.
Dynamic quenching of N-CQDs fluorescence by RPD could be developed through collisional interaction between the excited state of the N-CQDs and the quencher RPD. The excited state energy of the N-CQDs is transferred to RPD, leading to a decrease in the fluorescence intensity, which is typically governed by the Förster resonance energy transfer mechanism.
3.4. Method optimization
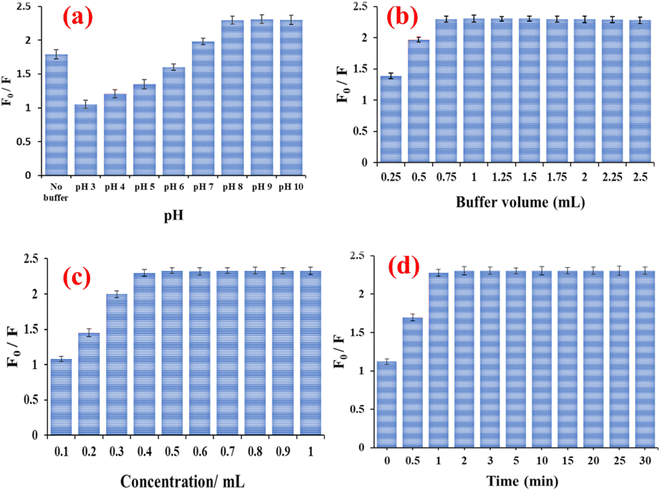
The factors affecting the stability of fluorescence quenching of N-CQDs by RPD were investigated and optimized. These variables include pH and volume of buffer, volume of N-CQDs, and incubation time. Fluorescence quenching was studied with and without the addition of buffer solutions with different pH values (3–10). As shown in Fig. 6a, uniform quenching was achieved with a borate buffer solution with a pH of 9. The quenching response decreased significantly as the acidity of the solution increased. Different volumes of the buffer solution were tested, and it was found that 1 mL was the best solution (Fig. 6b). Fluorescence quenching was also studied with different volumes of N-CQDs solution. It was found that 0.5 mL of the N-CQDs solution (containing 100 μg mL−1 N-CQDs) caused the greatest fluorescence quenching with RPD (Fig. 6c). At different time intervals from 0 to 30 minutes, the efficacy of fluorescence quenching in the presence of RPD was investigated. Maximum fluorescence quenching of N-CQDs was achieved in 2 minutes, and no additional quenching was observed when the reaction time was prolonged (Fig. 6d).3.5. Method validation
The method was validated in accordance with ICH standards.60 The method demonstrated good linearity in a concentration range of 5−150 ng mL−1, according to the Stern–Volmer equation, with a linear equation of y = 0.0149x + 0.997 and a correlation coefficient of 0.9991. Table 1 shows the data for the regression parameters. The limits of detection (LOD) and quantitation (LOQ) were calculated using the standard deviation of response and the slope of the calibration curve, as follows: LOD = 3.3 SD/slope and LOQ = 10 SD/slope. The LOD and LOQ values were determined to be 1.379 and 4.180 ng mL−1, respectively (Table 1). The method's accuracy was calculated as mean percent recovery after triplicate determination of three concentration levels (10, 60, and 120 ng mL−1). The method was found to be accurate, with a mean percent recovery of 99.13%, as listed in Table 1. The method's precision, calculated as the relative standard deviation (RSD), was evaluated by determining the same concentration levels three times in one day for repeatability and three times in three days for intermediate precision. The method was found to be precise, with a % RSD less than 2 (Table 1). The robustness of the method was ensured by its ability to withstand minor changes in the parameters that could affect the results. No significant effect was observed when minor changes to the buffer pH (9 ± 0.5), buffer volume (1 ± 0.25 mL), N-CQD volume (0.5 ± 0.1 mL), and incubation time (2 ± 1 min) were made, as shown in Table 1. The specificity of the method was ensured by its capacity to quantitatively determine RPD accurately and specifically in spiked plasma samples as well as pharmaceutical dosage forms without interference from plasma endogenous components or pharmaceutical excipients. Table 2 shows that the plasma endogenous components had no effect, whereas Table 3 shows that the pharmaceutical excipients had no effect, confirming the excellent specificity of the applied approach. The specificity was also ensured using the standard addition technique, which involved adding known amounts of pure RPD (20, 40, and 80 ng mL−1) to a pharmaceutical sample containing 10 ng mL−1 RPD and then calculating the percent recovery of the pure added concentrations. The results were displayed in Table 4.| Parameters | RPD |
|---|---|
| a Average of nine determinations (three concentrations repeated three times).b RSD of nine determinations (three concentrations repeated three times). | |
| Excitation wavelength (nm) | 380 |
| Emission wavelength (nm) | 475 |
| Linearity range (ng mL−1) | 5−150 |
| LOD (ng mL−1) | 1.379 |
| LOQ (ng mL−1) | 4.180 |
| Slope | 0.0149 |
| Intercept | 0.9997 |
| Coefficient of determination (r2) | 0.9991 |
| Accuracy (% R)a | 99.13 |
| Repeatability precision (RSD)b | 0.429 |
| Intermediate precision (RSD)b | 0.745 |
![[thin space (1/6-em)]](https://www.rsc.org/images/entities/char_2009.gif) |
|
| Robustness (% R ± RSD) | |
| Buffer pH (±0.5) | 100.62 ± 0.868 |
| Buffer volume (±0.25 mL) | 99.47 ± 1.030 |
| N-CQDs volume (±0.1 mL) | 99.93 ± 0.784 |
| Incubation time (±1 min) | 100.76 ± 0.887 |
| Added (ng mL−1) | Found (ng mL−1) | Recovery (%) |
|---|---|---|
| 10 | 9.30 | 92.95 |
| 20 | 18.70 | 93.49 |
| 40 | 38.21 | 95.52 |
| 80 | 76.66 | 95.83 |
| 120 | 116.26 | 96.88 |
| Mean ± RSD | 94.94 ± 1.744 | |
| Apexidone® tablets | Apexidone® syrup | ||||
|---|---|---|---|---|---|
| Added (ng mL−1) | Found (ng mL−1) | Recovery (%) | Added (ng mL−1) | Found (ng mL−1) | Recovery (%) |
| 10 | 9.97 | 99.66 | 10 | 9.85 | 98.52 |
| 20 | 20.04 | 100.20 | 20 | 19.74 | 98.72 |
| 40 | 40.22 | 100.55 | 40 | 39.75 | 99.38 |
| 80 | 78.41 | 98.01 | 80 | 80.69 | 100.86 |
| 120 | 120.76 | 100.63 | 120 | 120.96 | 100.80 |
| Mean ± RSD | 99.81 ± 1.079 | Mean ± RSD | 94.66 ± 1.121 | ||
| Drug | Amount of drug (ng mL−1) | Amount of pure added (ng mL−1) | Found (ng mL−1) | Recovery (%) |
|---|---|---|---|---|
| Apexidone® tablets | 10 | 20 | 20.29 | 101.44 |
| 40 | 39.62 | 99.04 | ||
| 80 | 80.02 | 100.03 | ||
| Mean ± RSD | 100.17 ± 1.204 | |||
| Apexidone® syrup | 10 | 20 | 19.89 | 99.43 |
| 40 | 40.42 | 101.06 | ||
| 80 | 80.76 | 100.95 | ||
| Mean ± RSD | 100.48 ± 0.905 | |||
3.6. Application to spiked plasma samples
Due to the high sensitivity of the proposed method, it could be effectively used for the analysis of RPD in spiked human plasma. The mean maximum plasma concentration for RPD was 15.90 ng mL−1, is within the linearity range.66 Table 2 shows that the method was successfully applied for the determination of RPD in spiked plasma samples without the influence of endogenous plasma components.3.7. Application to pharmaceutical dosage form
The described method was effectively utilized to determine RPD in two different pharmaceutical dosage forms, tablet and syrup, without influence from excipients (Table 3), as evidenced by the standard addition technique results (Table 4). Using the Student's t-test and F-test, the obtained results were compared to the reported method.23 The results revealed no statistically significant difference between the two methods (Table 5).| Parameters | Proposed method | Reported method23 |
|---|---|---|
| a Number of experiments.b The values in parenthesis are tabulated values of “t” and “F” at (P = 0.05). | ||
| Linearity range | 5−150 ng mL−1 | 10−60 μg mL−1 |
| LOD | 1.379 ng mL−1 | 1.79 μg mL−1 |
| Mean recovery % ±RSD | 99.81 ± 1.079 | 100.16 ± 0.850 |
| Na | 5 | 5 |
| t-test (2.306)b | 0.572 | |
| F-test (6.388)b | 1.598 | |
3.8. Comparison with the reported method
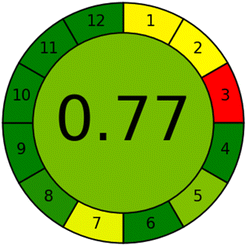
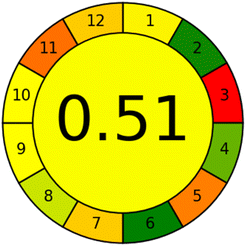
In terms of sensitivity and greenness, the suggested method was compared to the reported HPLC method,23 which used methanol and acetonitrile as mobile phases and UV detection of the RPD at 280 nm. The suggested method is more sensitive than the reported method, with LOD and linearity ranges of 1.379 ng mL−1 and 5–150 ng mL−1, respectively, compared to 1.79 μg mL−1 and 10–60 μg mL−1 for the reported method, as illustrated in Table 5. The analytical eco-scale67 and the analytical greenness metric (AGREE)68 were used to assess and compare the suggested and reported methods' adherence to green analytical chemistry concepts. Using the analytical eco-scale metric, the suggested method is greener than the reported HPLC method, with a total score of 95 compared to 83 for the reported method, which is based on adding up all penalty points for reagents and instruments used in the analytical procedures and subtracting them from a base of 100. The results were illustrated in Table 6. Furthermore, the suggested method greenness was confirmed over the reported HPLC using the analytical greenness metric (AGREE), which is based on scoring the twelve-significance principle of green analytical chemistry as an input criterion from 0 to 1 and mirrored them on the intuitive red-yellow-green colour scale. The outcome is a clock-like pictogram with the average score and colour representation in the center. The excellent analysis is highlighted by a dark green colour and has a score of one. The AGREE pictograms illustrated in Table 6 demonstrate that the suggested method is greener than the reported HPLC method, with a light green highlighted 0.77 score compared to a yellow highlighted 0.51 score for the reported method.| The proposed method | The reported method23 | ||
|---|---|---|---|
| Parameters | Penalty points | Parameters | Penalty points |
| Analytical eco-scale | |||
| Reagents | Reagents | ||
| Water | 0 | Methanol | 6 |
| Borate buffer pH 9 | 2 | Acetonitrile | 4 |
| Instrument spectrofluorometer | Instrument HPLC | ||
| Energy: <0.1 kW h per sample | 0 | Energy: ≤1.5 kW h per sample | 1 |
| Occupational hazards | 0 | Occupational hazards | 3 |
| Waste (1–10 mL) | 3 | Waste (1–10 mL) | 3 |
| ∑penalty points | 5 | ∑penalty points | 17 |
| Total scores | 100 − 5 = 95 | Total scores | 100 − 17 = 83 |
![[thin space (1/6-em)]](https://www.rsc.org/images/entities/char_2009.gif) |
|||
| AGREE tool | |||
 |
 |
||
4. Conclusion
In this work, N–carbon quantum dots based on guava fruit were synthesized and used for the determination of risperidone based on quenching fluorescence spectroscopy phenomena. The synthesized N–carbon quantum dots showed a strong emission fluorescence peak at 475 nm when excited at 380 nm, and their fluorescence intensity decreased dynamically with increasing risperidone concentration. The described method was effectively used for the determination of risperidone in pharmaceutical dosage forms, tablets and syrup, as well as in spiked human plasma. The described method was found to be more sensitive, nanoscale determination, and more consistent with the principles of green analytical chemistry compared with previously reported HPLC methods.Conflicts of interest
There are no conflicts to declare.Acknowledgements
The authors extend their appreciation to the Deputyship for Research &Innovation, Ministry of Education in Saudi Arabia for funding this research work through the project number: IFP22UQU4310457DSR154.References
- J. Zeidan, E. Fombonne, J. Scorah, A. Ibrahim, M. S. Durkin, S. Saxena, A. Yusuf, A. Shih and M. Elsabbagh, Autism Res., 2022, 15, 778–790, DOI:10.1002/aur.2696
.
- M. Elsabbagh, A. Yusuf, J. Zeidan, J. Scorah, E. Fombonne, M. S. Durkin, S. Saxena and A. Shih, Autism Res., 2022, 15, 1187–1188, DOI:10.1002/aur.2739
.
- World population review, Autism rates by country, 2022, https://worldpopulationreview.com/country-rankings/autism-rates-by-country Search PubMed.
- H. M. Alzahrani and M. M. Shakuri, Front. Educ., 2023, 8, 377, DOI:10.3389/feduc.2023.1150531
.
- M. P. Kelly, I. Alireza, H. E. Busch, S. Northrop, M. Al-Attrash, S. Ainsleigh and N. Bhuptani, Rev. J. Autism. Dev. Disord., 2016, 3, 154–164, DOI:10.1007/s40489-016-0073-1
.
- G. R. Taha and H. Hussein, Comprehensive Guide to Autism, 2014, pp. 2509–2531. DOI:10.1007/978-1-4614-4788-7_98
.
- A. Mostafa, Nat. Middle East, 2011, 147 DOI:10.1038/nmiddleeast.2011.147
.
- M. W. Qoronflesh, M. M. Essa, S. T. Alharahsheh, Y. M. Al-Farsi and S. Al-Adawi, Autism in the GULF states: a regional overview, Front. Biosci. Landmark Ed., 2019, 24, 334–346, DOI:10.2741/4721
.
- C. Lord, S. Risi, P. S. DiLavore, C. Shulman, A. Thurm and A. Pickles, Arch. Gen. Psychiatry, 2006, 63, 694–701, DOI:10.1001/archpsyc.63.6.694
.
- S. L. Hyman, S. E. Levy, S. M. Myers, D. Z. Kuo, S. Apkon, L. F. Davidson, K. A. Ellerbeck, J. E. Foster, G. H. Noritz, M. O. C. Leppert and B. S. Saunders, Pediatrics, 2020, 145, e20193447, DOI:10.1542/peds.2019-3447
.
- Centers for disease control and prevention, autism spectrum disorder (ASD), https://www.cdc.gov/ncbddd/autism/facts.html#:%7E:text=Autism%20spectrum%20disorder%20(ASD)%20is,most%20common%20ways%20people%20develop, accessed March 2022 Search PubMed.
- H. A. Alsayouf, H. Talo, M. L. Biddappa and E. De Los Reyes, Children, 2021, 8, 318, DOI:10.3390/children8050318
.
- A. A. Bhat, G. Gupta, O. Afzal, I. Kazmi, F. A. Al-Abbasi, A. S. A. Altamimi, W. H. Almalki, S. I. Alzarea, S. K. Singh and K. Dua, Chem.-Biol. Interact., 2023, 369, 110296, DOI:10.1016/j.cbi.2022.110296
.
- B. Chavez, M. Chavez-Brown and J. A. Rey, Ann. Pharmacother., 2006, 40, 909–916, DOI:10.1345/aph.1G389
.
- S. M. Kloosterboer, B. C. de Winter, C. G. Reichart, M. E. Kouijzer, M. M. de Kroon, E. van Daalen, W. A. Ester, R. Rieken, G. C. Dieleman, D. van Altena and B. Bartelds, Br. J. Clin. Pharmacol., 2021, 87, 1069–1081, DOI:10.1111/bcp.14465
.
- B. Čabovska, S. L. Cox and A. A. Vinks, J. Chromatogr. B: Anal. Technol. Biomed. Life Sci., 2007, 852, 497–504, DOI:10.1016/j.jchromb.2007.02.007
.
- M. De Meulder, B. M. Remmerie, R. de Vries, L. L. Sips, S. Boom, E. W. Hooijschuur, N. C. van de Merbel and P. M. Timmerman, J. Chromatogr. B: Anal. Technol. Biomed. Life Sci., 2008, 870, 8–16, DOI:10.1016/j.jchromb.2008.04.041
.
- S. Schneider, E. Sibille, M. Yegles, H. Neels, R. Wennig and A. Mühe, J. Chromatogr. B: Anal. Technol. Biomed. Life Sci., 2009, 877, 2589–2592, DOI:10.1016/j.jchromb.2009.06.035
.
- M. Z. Huang, J. Z. Shentu, J. C. Chen, J. Liu and H. L. Zhou, J. Zhejiang Univ. Sci. B, 2008, 9, 114–120, DOI:10.1631/jzus.B0710439
.
- A. Avenoso, G. Facciolà, M. Salemi and E. Spina, J. Chromatogr. B: Biomed. Sci. Appl., 2000, 746, 173–181, DOI:10.1016/S0378-4347(00)00323-6
.
- O. V. Olesen and K. Linnet, J. Chromatogr. B: Biomed. Sci. Appl., 1997, 698, 209–216, DOI:10.1016/S0378-4347(97)00302-2
.
- R. Mandrioli, L. Mercolini, D. Lateana, G. Boncompagni and M. A. Raggi, J. Chromatogr. B: Anal. Technol. Biomed. Life Sci., 2011, 879, 167–173, DOI:10.1016/j.jchromb.2010.11.033
.
- Z. R. Dedania, R. R. Dedania, N. R. Sheth, J. B. Patel and B. Patel, Int. J. Anal. Chem., 2011 DOI:10.1155/2011/124917
.
- I. Locatelli, A. Mrhar and I. Grabnar, J. Pharm. Biomed. Anal., 2009, 50, 905–910, DOI:10.1016/j.jpba.2009.06.013
.
- M. Aravagiri, S. R. Marder, D. Wirshing and W. C. Wirshing, Pharmacopsychiatry, 1998, 31, 102–109, DOI:10.1055/s-2007-979308
.
- W. Bader, D. Melchner, T. Nonenmacher and E. Haen, Pharmacopsychiatry, 2005, 38, 4, DOI:10.1055/s-2005-862617
.
- Z. A. El-Sherif, B. El-Zeany and O. M. El-Houssini, J. Pharm. Biomed. Anal., 2005, 36, 975–981, DOI:10.1016/j.jpba.2004.07.014
.
- A. Maślanka, J. Krzek and A. Patrzałek, Acta Pol. Pharm., 2009, 66, 461–470 Search PubMed
.
- R. B. Patel, B. G. Patel, M. R. Patel and K. K. Bhatt, Acta Chromatogr, 2010, 22, 549–567, DOI:10.1556/achrom.22.2010.4.5
.
- S. K. Patel and N. J. Patel, Chromatographia, 2009, 69, 393–396, DOI:10.1365/s10337-008-0870-5
.
- A. Afkhami and H. Ghaedi, Anal. Methods, 2012, 4, 1415–1420, 10.1039/C2AY05688G
.
- M. Arvand and A. Pourhabib, J. Chin. Chem. Soc., 2013, 60, 63–72, DOI:10.1002/jccs.201200161
.
- I. H. Taşdemir, O. Çakirer, N. Erk and E. Kiliç, Collect. Czech. Chem. Commun., 2011, 76, 159–176, DOI:10.1135/cccc2010156
.
- D. Kul, Curr. Anal. Chem., 2019, 15, 240–248, DOI:10.2174/1573411014666180426170022
.
- O. Isildak and A. Birinci, Farmacia, 2018, 66, 977–983, DOI:10.31925/FaARMACIA.2018.6.8
.
- H. Ahmadi and M. Rahimi-Nasrabadi, Anal. Bioanal. Electrochem., 2018, 10, 1467–1478 CAS
.
- M. E. Hassouna, G. A. Zaki and E. Khaled, Int. J. Electrochem. Sci., 2015, 10, 162–174 Search PubMed
.
- N. I. Abdulla and H. M. Yaseen, Iraqi J. Pharm. Sci., 2015, 24, 30–40, DOI:10.31351/vol24iss2pp30-40
.
- S. Kathirvel, G. D. Rao and S. V. Satyanarayana, Asian J. Res. Chem., 2010, 3, 151–153 CAS
.
- B. K. Jayanna, T. D. Devaraj, K. P. Roopa, G. Nagendrappa, H. A. Kumar and N. Gowda, Indian J. Pharm. Sci., 2014, 76, 452 CAS
.
- A. Y. Idris, M.
A. Usman, A. Musa and R. B. Oloyede, Niger. J. Sci. Res., 2015, 1, 41–46 Search PubMed
.
- H. N. Deepakumari, S. M. Mallegowda, K. B. Vinay and H. D. Revanasiddappa, Ind. Chem. Eng. Q., 2013, 19, 121–128, DOI:10.2298/CICEQ110824046D
.
- S. V. Kutty, S. Greeshma, P. M. Vidhya and D. K. Sunith, Res. J. Pharm. Technol., 2013, 6, VIII Search PubMed
.
- K. A. M. Attia, A. A. Mohamad and M. S. Emara, Eur. J. Biomed. Pharm. Sci., 2015, 2, 17–27 CAS
.
- S. Y. Lim, W. Shen and Z. Gao, Chem. Soc. Rev., 2015, 44, 362–381, 10.1039/C4CS00269E
.
- A. U. Khan, N. Malik, B. Singh, N. H. Ansari, M. Rehman and A. Yadav, J. Umm Al-Qura Univ. Appl. Sci., 2023, 9, 1–8, DOI:10.1007/s43994-023-00038-5
.
- S. S. Iqubal, J. Umm Al-Qura Univ. Appl. Sci., 2022, 8, 33–36, DOI:10.1007/s43994-022-00007-4
.
- H. Zhang, S. Wu, Z. Xing and H. B. Wang, Analyst, 2021, 146, 7250–7256, 10.1039/D1AN01582F
.
- H. Zhang, S. Wu, Z. Xing, M. Gao, M. Sun, J. Wang and H. B. Wang, Appl. Phys. A, 2022, 128, 356, DOI:10.1007/s00339-022-05485-1
.
- N. Dubey, S. Dhiman and A. L. Koner, ACS Appl. Nano Mater., 2023, 6, 4078–4096, DOI:10.1021/acsanm.2c05407
.
- L. Wang, J. Jana, J. S. Chung, W. M. Choi and S. H. Hur, Spectrochim. Acta Part A, 2022, 268, 120657, DOI:10.1016/j.saa.2021.120657
.
- P. Nehra, P. S. Rana and S. Singh, Environ. Sci. Pollut. Res., 2023, 1–15, DOI:10.1007/s11356-023-27280-y
.
- N. A. Alarfaj, M. F. El-Tohamy and H. F. Oraby, Nanoscale Res. Lett., 2020, 15, 1–14, DOI:10.1186/s11671-020-3247-9
.
- R. S. Juang, C. C. Fu, C. T. Hsieh, S. Gu, Y. A. Gandomi and S. H. Liu, J. Mater. Chem. C, 2020, 8, 16569–16576, 10.1039/D0TC04007J
.
- R. Das, R. Bandyopadhyay and P. Pramanik, Mater. Today Chem., 2018, 8, 96–109, DOI:10.1016/j.mtchem.2018.03.003
.
- W. K. Luo, L. L. Zhang, Z. Y. Yang, X. H. Guo, Y. Wu, W. Zhang, J. K. Luo, T. Tang and Y. Wang, J. Nanobiotechnol., 2021, 19, 1–30, DOI:10.1186/s12951-021-01072-3
.
- C. Kang, Y. Huang, H. Yang, X. F. Yan and Z. P. Chen, Nanomaterials, 2020, 10, 2316, DOI:10.3390/nano10112316
.
- N. Dubey, S. Ramteke, N. K. Jain, T. Dutta and A. Lal Koner, ChemistrySelect, 2022, 7, 202201604, DOI:10.1002/slct.202201604
.
- M. Xue, Z. Zhan, M. Zou, L. Zhang and S. Zhao, New J. Chem., 2016, 40, 1698–1703, 10.1039/C5NJ02181B
.
- S. K. Branch, J. Pharm. Biomed. Anal., 2005, 38, 798–805, DOI:10.1016/j.jpba.2005.02.037
.
- J. Wei, X. Zhang, Y. Sheng, J. Shen, P. Huang, S. Guo, J. Pan, B. Liu and B. Feng, New J. Chem., 2014, 38, 906–909, 10.1039/C3NJ01325A
.
- M. Grabolle, M. Spieles, V. Lesnyak, N. Gaponik, A. Eychmüller and U. Resch-Genger, Anal. Chem., 2009, 81, 6285–6294, DOI:10.1021/ac900308v
.
- K. Rurack, Fluorescence quantum yields: methods of determination and standards, in Standardization and quality assurance in fluorescence measurements I, Springer, Berlin, Heidelberg, 2018, pp. 101–145, DOI:10.1007/4243_2008_019
.
- A. Sekar, R. Yadav and N. Basavaraj, New J. Chem., 2021, 45, 2326–2360, 10.1039/D0NJ04878J
.
- J. R. Albani, Structure and Dynamics of Macromolecules: Absorption and Fluorescence Studies, Elsevier, 2011 Search PubMed
.
- M. G. Aman, A. A. Vinks, B. Remmerie, E. Mannaert, Y. Ramadan, J. Masty, R. L. Lindsay and K. Malone, Clin. Ther., 2007, 29, 1476–1486, DOI:10.1016/j.clinthera.2007.07.026
.
- A. Gałuszka, Z. M. Migaszewski, P. Konieczka and J. Namieśnik, TrAC, Trends Anal. Chem., 2012, 37, 61–72, DOI:10.1016/j.trac.2012.03.013
.
- A. H. Abdelazim, M. A. Abourehab, L. M. Abd Elhalim, A. A. Almrasy and S. Ramzy, Spectrochim. Acta, Part A, 2023, 285, 121911, DOI:10.1016/j.saa.2022.121911
.
| This journal is © The Royal Society of Chemistry 2023 |

