 Open Access Article
Electrolytic reduction of CrF3 and Cr2O3 in molten fluoride salt
Nan Jia,
Fangling Jiang*b and
Hao Peng *a
*a
aShanghai Institute of Applied Physics, Chinese Academy of Sciences, Shanghai 201800, PR China. E-mail: penghao@sinap.ac.cn; Fax: +86 021 39194053; Tel: +86 021 39194053
bShanghai Institute of Optics and Fine Mechanics, Chinese Academy of Sciences, Shanghai 201800, PR China. E-mail: jiangfangling@siom.ac.cn; Fax: +86 021 69918204; Tel: +86 021 69918204
First published on 6th June 2023
Abstract
The electrochemical behavior of Cr3+ in molten LiF–NaF–KF (46.5![[thin space (1/6-em)]](https://www.rsc.org/images/entities/char_2009.gif) :
:![[thin space (1/6-em)]](https://www.rsc.org/images/entities/char_2009.gif) 11.5
11.5![[thin space (1/6-em)]](https://www.rsc.org/images/entities/char_2009.gif) :
:![[thin space (1/6-em)]](https://www.rsc.org/images/entities/char_2009.gif) 42 mol%) (FLiNaK) was studied by cyclic voltammetry (CV) at 600 °C. With an acceptable solubility and a relatively positive reduction potential of solute Cr3+, the electrolytic reduction of chromium in FLiNaK-CrF3 melt was performed on a tungsten electrode by potentiostatic electrolysis. After electrolysis for 21.5 h, the Cr3+ in the melt was effectively removed as confirmed by ICP-OES and CV. Then, the solubility of Cr2O3 in FLiNaK with ZrF4 additive was analyzed by CV. The results showed that the solubility of Cr2O3 was greatly promoted by ZrF4 and the reduction potential of zirconium is far more negative than that of chromium, which makes the electrolysis of chromium from Cr2O3 material possible. Thus, the electrolytic reduction of Cr in a FLiNaK-Cr2O3-ZrF4 system was further performed by potentiostatic electrolysis on a nickel electrode. After electrolysis for 5 h, a thin layer of chromium metal (with a thickness of c.a. 20 μm) was deposited on the electrode, as confirmed by SEM-EDS and XRD techniques. This study verified the feasibility of electroextraction of Cr from the FLiNaK-CrF3 and FLiNaK-Cr2O3-ZrF4 molten salt systems.
42 mol%) (FLiNaK) was studied by cyclic voltammetry (CV) at 600 °C. With an acceptable solubility and a relatively positive reduction potential of solute Cr3+, the electrolytic reduction of chromium in FLiNaK-CrF3 melt was performed on a tungsten electrode by potentiostatic electrolysis. After electrolysis for 21.5 h, the Cr3+ in the melt was effectively removed as confirmed by ICP-OES and CV. Then, the solubility of Cr2O3 in FLiNaK with ZrF4 additive was analyzed by CV. The results showed that the solubility of Cr2O3 was greatly promoted by ZrF4 and the reduction potential of zirconium is far more negative than that of chromium, which makes the electrolysis of chromium from Cr2O3 material possible. Thus, the electrolytic reduction of Cr in a FLiNaK-Cr2O3-ZrF4 system was further performed by potentiostatic electrolysis on a nickel electrode. After electrolysis for 5 h, a thin layer of chromium metal (with a thickness of c.a. 20 μm) was deposited on the electrode, as confirmed by SEM-EDS and XRD techniques. This study verified the feasibility of electroextraction of Cr from the FLiNaK-CrF3 and FLiNaK-Cr2O3-ZrF4 molten salt systems.
1. Introduction
Molten fluorides are particularly appropriate as the coolant of molten salt reactors (MSR) because of their excellent heat transfer properties.1–3 However, the oxidizing impurities contained in fluoride salts,4 including adsorbed H2O, dissolved HF, and metal impurity ions (Fe2+, Ni2+) are corrosive to structural materials,5–8 particularly to the most vulnerable element Cr in those materials [eqn (1)–(4)].9–11 The corrosion reactions lead to dissolution of Cr into the molten salt. Despite this problem, high temperature Cr-bearing alloys, such as Hastelloy, still have been used in molten fluorides because of their acceptable, time-tested, and overall high temperature properties.12,13| H2O + 2F− → 2HF + O2− | (1) |
| 2Cr + 6HF → 2CrF3 + 3H2 | (2) |
| 2Cr + 3Fe2+ → 2Cr3+ + 3Fe | (3) |
| 2Cr + 3Ni2+→ 2Cr3+ + 3Ni | (4) |
However, due to the hygrometric nature of fluorine salt and the pyro-hydrolysis of adsorbed water (eqn (1)), the oxide impurity (O2−) in molten salt is unavoidable.18–22 The Cr3+ exhibits a high sensitivity towards O2− ions and the interaction between the two would probably produce solid oxide compound (e.g. Cr2O3) with high melting point and low solubility. Therefore, the Cr3+ impurity in molten fluorides should generally exist in two forms: chromium(III) fluoride (e.g. CrF3) and chromium(III) oxide (e.g. Cr2O3).
With the purpose of Cr3+ removal, electrolysis of chromium from both the CrF3 and Cr2O3 raw materials should be performed. The reported high solubility of CrF34,15–17 in molten FLiNaK makes its electrolysis feasible. However, with respect to the FLiNaK-Cr2O3 system, the solubility of Cr2O3 in FLiNaK is a key factor affecting chromium electroextraction. Our previous investigation and related reports23–25 pointed out that the Cr2O3 solubility in molten fluorides was relatively low. For example, the solubility of Cr2O3 in molten FLiNaK and FLiBe at 600 °C was as low as 122 ppm and 183 ppm, respectively,23 which makes the electrolysis difficult and challenging. Therefore, it is necessary to find suitable additives to increase Cr2O3 solubility in molten fluorides. ZrF4 might be a good choice, which has a strong affinity towards oxide. Peng and Shen et al.19,21,26 found that Zr(IV) could readily combine with O2− to produce zirconium oxide (e.g. ZrO2) or zirconium oxy-fluoride species (e.g. ZrOF2 and Zr2OF104−) in FLiNaK and FLiBe molten fluoride systems.16,17 Besides, Gibilaro et al.27 also found the interactions between Zr4+ and O2− in LiF–CaF2 would lead to the formation of ZrO2 and ZrO1.3F1.4. These studies confirmed that ZrF4 is a good oxide collector that can easily capture O2− in molten fluorides.
Therefore, it is reasonably supposed that ZrF4 can improve the solubility of solid oxides in melt through the reaction of Zr(IV) and oxygen in these oxides. Song et al.23 studied the dissolution behavior of Cr2O3 in various molten fluorides by combining electrochemical and chemical methods (including CV, ICP-OES, Raman, and XRD techniques), and found that the ZrF4 additive significantly increased the solubility of Cr2O3 by 19 and 2 times in FLiNaK and FLiBe molten fluoride salts, respectively, with yielding the dissolution product of Cr3+ and [ZrOxFy]4−2x−y complex species through the dissolution mechanism of Cr2O3 + ZrF4 + F− → CrF3 + ZrOxFy4−2x−y. Specifically, the solubility of Cr2O3 increased from 122 ppm to 2300 ppm in FLiNaK and increased from 183 ppm to 320 ppm in FLiBe by ZrF4 at 600 °C. Besides, Peng et al.18–21 studied the dissolution–precipitation behaviors of UO2 in FLiNaK and FLiBe with ZrF4 additive, and found that ZrF4 can greatly improve the solubility of UO2 in both systems. Particularly, their results showed that the maximum solubility of UO2 in FLiNaK was increased by a factor of 5.76 when the added ZrF4 concentration was up to 2.91 wt%, and UO2 was dissolved as UOF2 and ZrOF2 species.19 These studies demonstrated that ZrF4 can effectively improve the solubility of oxides in molten fluorides. Moreover, ZrF4 has a low neutron-absorption cross-section, which allows it to be used in the carrier media of MSR. Meanwhile, the theoretical decomposition potential difference between zirconium and chromium is significant. From the above, ZrF4 is probably an ideal additive for improving the solubility of Cr2O3 in molten fluorides, which make the electrolysis of chromium from Cr2O3 material possible.
In this paper, with analysis of the reduction potentials of solute Cr3+ by cyclic voltammetry (CV), the feasibility of electrolyzing chromium from the FLiNaK-CrF3 melt was verified. Then, the solubility of Cr2O3 in FLiNaK with ZrF4 additive was analyzed by CV. The results showed that the solubility of Cr2O3 was greatly facilitated by ZrF4, which make the electrolysis of chromium from this system possible. Furthermore, the electrolytic reduction of Cr in the FLiNaK-CrF3 and FLiNaK-Cr2O3-ZrF4 systems were performed by potentiostatic electrolysis on W and Ni electrodes, respectively. The removal rate of Cr3+ was examined by ICP-OES and CV, and the electrolytic product was characterized by SEM-EDS and XRD. The results showed that the Cr3+ in the melt was effectively removed after electrolysis of both systems. This study successfully verified the feasibility of electrolytic extraction of Cr from the FLiNaK-CrF3 and FLiNaK-Cr2O3-ZrF4 molten salt systems.
2. Experimental
2.1 Chemicals and molten salt systems
Before use, the highly-purified FLiNaK [LiF–NaF–KF (46.5![[thin space (1/6-em)]](https://www.rsc.org/images/entities/char_2009.gif) :
:![[thin space (1/6-em)]](https://www.rsc.org/images/entities/char_2009.gif) 11.5
11.5![[thin space (1/6-em)]](https://www.rsc.org/images/entities/char_2009.gif) :
:![[thin space (1/6-em)]](https://www.rsc.org/images/entities/char_2009.gif) 42 mol%)] eutectic salt was dehydrated by heating under vacuum from ambient temperature up to its melting point for 72 h. The main impurities contained in FLiNaK salt were analyzed by ICP-OES and shown in Table 1. Then, 300 g of dehydrated FLiNaK salt was weighed and loaded into a vitreous carbon crucible (Φ70×H100 mm). During the electrolysis experiment of FLiNaK-CrF3 system, a certain amount of Cr3+ solute was introduced into FLiNaK salt in the form of CrF3 (Sigma-Aldrich, 99.99%), and the electrolysis of Cr3+ was then conducted in this prepared FLiNaK-CrF3 electrolyte, as shown in Fig. 1(a). While in the electrolysis of FLiNaK-Cr2O3-ZrF4 system, an excess of Cr2O3 powder (ca. 10 g, Sigma-Aldrich, 99.9%) was added into FLiNaK salt, and the Cr2O3 (ρ = 5.21 g cm−3) would deposited at the bottom of the molten bath (ρ ≈ 2 g cm−3) when balanced. Then a known amount of ZrF4 (Sigma-Aldrich, 99.99%) was gradually introduced into the FLiNaK-Cr2O3 melt to promote the solubility of Cr2O3, and the electrolysis of Cr3+ by Cr2O3 dissolution was then conducted in this prepared FLiNaK-Cr2O3-ZrF4 electrolyte, as shown in Fig. 1(b).
42 mol%)] eutectic salt was dehydrated by heating under vacuum from ambient temperature up to its melting point for 72 h. The main impurities contained in FLiNaK salt were analyzed by ICP-OES and shown in Table 1. Then, 300 g of dehydrated FLiNaK salt was weighed and loaded into a vitreous carbon crucible (Φ70×H100 mm). During the electrolysis experiment of FLiNaK-CrF3 system, a certain amount of Cr3+ solute was introduced into FLiNaK salt in the form of CrF3 (Sigma-Aldrich, 99.99%), and the electrolysis of Cr3+ was then conducted in this prepared FLiNaK-CrF3 electrolyte, as shown in Fig. 1(a). While in the electrolysis of FLiNaK-Cr2O3-ZrF4 system, an excess of Cr2O3 powder (ca. 10 g, Sigma-Aldrich, 99.9%) was added into FLiNaK salt, and the Cr2O3 (ρ = 5.21 g cm−3) would deposited at the bottom of the molten bath (ρ ≈ 2 g cm−3) when balanced. Then a known amount of ZrF4 (Sigma-Aldrich, 99.99%) was gradually introduced into the FLiNaK-Cr2O3 melt to promote the solubility of Cr2O3, and the electrolysis of Cr3+ by Cr2O3 dissolution was then conducted in this prepared FLiNaK-Cr2O3-ZrF4 electrolyte, as shown in Fig. 1(b).
| Impurities | Content/ppm |
|---|---|
| Fe | 78 |
| Cr | 38 |
| Ni | 8 |
| Ca | 20 |
| Mg | 9 |
| W | 15 |
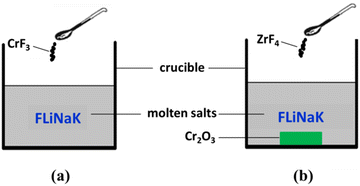 | ||
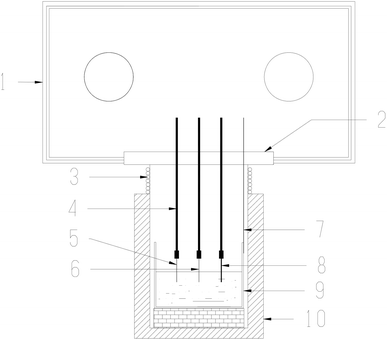
| Fig. 1 Schematic diagram of the experimental systems for (a) FLiNaK-CrF3 electrolysis and (b) FLiNaK-ZrF4-Cr2O3 electrolysis. | ||
2.2 Chemical analysis
Concentrations of the solute chromium in molten fluoride electrolytes were determined by Inductively Coupled Plasma-Optical Emission Spectroscopy (ICP-OES) technique. Firstly, samples of the melt were siphoned by dipping a nickel tube (Φ6 mm) into the supernatant of the melt without touching the bottom precipitates. 0.1 g of finely pulverized sample was weighed-in a glove box. Then, the sample was dissolved in diluted 20% (v![[thin space (1/6-em)]](https://www.rsc.org/images/entities/char_2009.gif) :
:![[thin space (1/6-em)]](https://www.rsc.org/images/entities/char_2009.gif) v) HNO3 and heated at 80 °C for ca. 30 min until the sample was completely dissolved. After cooling, the sample solution was transferred to a 50 ml flask and further diluted with deionized water. For each sample, duplicate decomposition tests of the sample were made. Chromium in the dissolved sample was then determined by Inductively Coupled Plasma-Optical Emission Spectroscopy (ICP-OES, Arcos, Spectro Co., Ltd). With the obtained results, we can compare the chromium content in the bath before and after electrolysis, and the removal efficiency of Cr is thus evaluated.
v) HNO3 and heated at 80 °C for ca. 30 min until the sample was completely dissolved. After cooling, the sample solution was transferred to a 50 ml flask and further diluted with deionized water. For each sample, duplicate decomposition tests of the sample were made. Chromium in the dissolved sample was then determined by Inductively Coupled Plasma-Optical Emission Spectroscopy (ICP-OES, Arcos, Spectro Co., Ltd). With the obtained results, we can compare the chromium content in the bath before and after electrolysis, and the removal efficiency of Cr is thus evaluated.
2.3 Electrochemical measurements
The electrochemical behaviors of CrF3 and dissolved chromium species caused by Cr2O3 dissolution in molten fluorides with ZrF4 additive were investigated by cyclic voltammetry (CV). The schematic diagram of the electrochemical set-up used in this study is shown in Fig. 2. The electrochemical cyclic voltammetry (CV) measurements were carried out with a three-electrode system connected to an electrochemical analyzer. A tungsten or nickel wire (1.0 mm diameter) was used as the working electrode; the surface area of this wire was determined by measuring the immersion depth in the melts after completion of the experiment. The auxiliary electrode was a graphite rod (6.0 mm diameter) with a large surface area (2.5 cm2). The reference electrode was a platinum wire (1.0 mm diameter), which was proved to act as a quasi-reference electrode Pt/PtOx/O2−.28,29 All potentials in this paper were measured with respect to this reference electrode and then transferred to vs. K/K+ reference electrode according to literature.30,31 An electrochemical analyzer, AUTOLAB (Ecochemie, NL), was used as the source of signal and for storage of data.
During FLiNaK-ZrF4-Cr2O3 electrolysis experiment, Cr2O3 was the active component and electrolysis raw material. A potentiostatic mode was used for electrolysis. The cathode and anode were Ni plate (1.5 cm × 2.0 cm) and graphite rod (spectral pure; 6.0 mm diameter), respectively. And the reference electrode was a platinum wire (1.0 mm diameter) as well. A constant potential of 1.0 V vs. K/K+ was used in the potentiostatic mode.
After electrolysis, the cathodic deposits were characterized by the techniques of X-ray diffraction (XRD; DY3614, PANzlytical Co., Ltd) and scanning electron microscopy (SEM; Merlin compact-60-83) equipped with an energy dispersive X-ray spectroscope (EDS).
3. Results and discussion
3.1 Electrochemical behavior of Cr3+ in FLiNaK melt
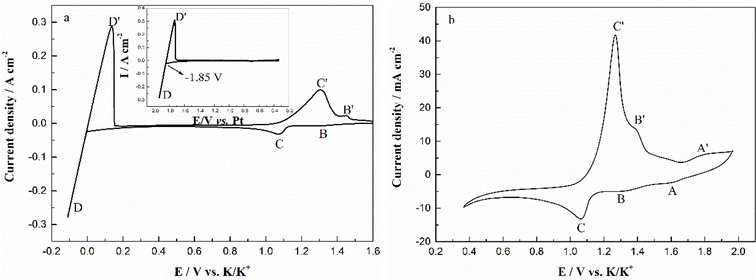
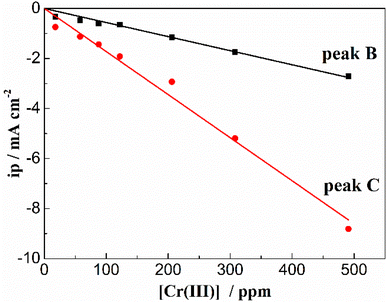
The typical cyclic voltammograms obtained on a W electrode in FLiNaK melt at 600 °C after addition of 345.30 ppm Cr3+ is shown in Fig. 3(a). Evidently, one couple of cathodic/anodic signals D and D′ corresponding to the deposition and dissolution of one of the melt components can be observed. According to heats of formation data for fluorides given by Baes32 and the investigation of Gabriela,31 it can be presumed that the signal D corresponds to the electrodeposition of potassium, while the oxidation signal D′ is attributed to the dissolution of potassium (KF → K, 4.97 V vs. F2/F−; NaF → Na 5.03 V vs. F2/F−; LiF → Li, 5.52 V vs. F2/F− at 600 °C). The reduction signal D at −1.85 V vs. Pt is shown in inset from Fig. 3(a). Thus, all potentials referenced to a platinum wire can be converted to vs. K/K+. Besides the couple of D and D′, two reduction peaks B and C at 1.27 V and 1.07 V vs. K/K+ in the cathodic run and two anodic counter-peaks B′ and C′ at 1.45 V and 1.31 V vs. K/K+ can be observed.In order to exhibit the details of the redox signals, Fig. 3(b) shows the cyclic voltammogram of the same FLiNaK-Cr3+ (345.30 ppm) melt on a W electrode in a relatively narrow potential range (from 1.90 V to 0.40 V vs. K/K+) also at 600 °C and scan rate of 0.1 V s−1. In this figure, the two reduction peaks B (1.27 V vs. K/K+) and C (1.07 V vs. K/K+), as well as their counter-oxidation peaks B′ (1.45 V vs. K/K+) and C′ (1.31 V vs. K/K+) also can be clearly observed. Since the deposition potential of Cr is more positive than that of alkali metal in a fluoride system and the peak current density for B and C linearly increases with the Cr3+ concentration (see Fig. 4), the observed peaks B and C should be attributed to the reduction of Cr3+. According to our previous studies and other relevant reports, the reduction of Cr3+ in molten fluorides proceeds in two steps: the first reduction of Cr3+ to Cr2+ and the subsequent reduction of Cr2+ to metal Cr, denoted as B and C shown in eqn (5) and (6), respectively. What is worth mentioning, except for B/B′ and C/C′ couples, a new weak reduction signal A at around 1.60 V vs. K/K+ associated with its counter-anodic signal A′ (1.80 V vs. K/K+) can be observed in Fig. 3(b). Its peak current density is constant even if the concentration of Cr3+ increases. Thus, it is probably linked to the impurity Fe contained in the original FLiNaK eutectics (see Table 1). The attribution of the redox couple A/A′ will be discussed later.
| Peak B: Cr3++ e− → Cr2+ | (5) |
| Peak C: Cr2+ + 2e− → Cr | (6) |
3.2 Electrolysis removal of Cr3+ from FLiNaK-CrF3 melt
According to the theory of A. J. Bard,33 the minimum potential difference for successful quantitative separation was considered to be 200 mV. From above analysis, the potential difference between Cr3+ and alkaline ions is approximately equal to 1.3 V, indicating that the Cr3+ can be theoretically removed from FLiNaK melt by potentiostatic electrolysis. Thus, potentiostatic electrolysis of the FLiNaK-CrF3 system was carried out. After electrolysis, the system was on-line sampled at 600 °C and the concentration of Cr3+ remaining in melt was analyzed by ICP-OES.| Samples | Before electrolysis | Electrolysis for 6 h | Electrolysis for 21.5 h |
|---|---|---|---|
| Electrolysis potential (V) | — | 1.0 vs. K/K+ | 1.0 vs. K/K+ |
| Cr concentration in melt analyzed by ICP-OES (ppm) | 345.30 | 108.61 | 13.12 |
| Cr practical removal content analyzed by ICP-OES (ppm) | — | 236.69 | 332.18 |
| Fe concentration analyzed by ICP-OES (ppm) | 78.19 | 7.43 | <−0.04 |
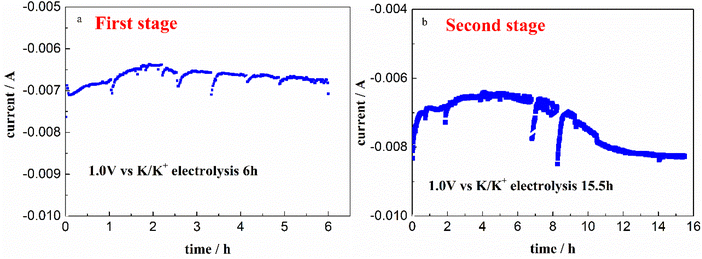
Therefore, after the whole electrolysis of 21.5 h, the Cr3+ in melt successfully decreased from the initial 345.30 ppm to a sufficiently low concentration level of 13.12 ppm, with the practical removal content of 332.18 ppm (Table 2). This result confirmed that the Cr3+ in melt can be almost removed through electrolysis method. Besides, it should be noted that the impurity Fe ions in molten FLiNaK analyzed by ICP-OES also continuously decreased from 78.19 ppm to below the detection limit after the overall electrolysis duration for 21.5 h. This result indicates that a certain amount of charges were used for Fe deposition. The current fluctuation in electrolytic process may be caused by the absorption and desorption of the electrodeposited products, resulting in a change in the electrode surface area.
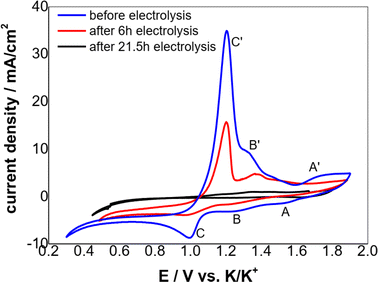
According to the CV theory, the peak current density of the electroactive solute (in this case the Cr3+) is fundamentally proportional to its concentration for an electrode process controlled by diffusion (Fig. 5). Thus, the variation of the Cr3+ concentration remaining in the melts can be monitored by CV measurements throughout the electrolysis process. Fig. 6 shows the cyclic voltammograms of FLiNaK-Cr3+ melts before electrolysis, after 6 h and 21.5 h electrolysis on W cathode at 1.0 V vs. K/K+. Obviously, the reduction peak current density of Cr3+ (Cr3+/Cr2+ reduction for peak B and Cr2+/Cr reduction for peak C) gradually decreased as the electrolysis progressed, and eventually no reduction peak current density can be detected on cyclic voltammogram after electrolysis for 21.5 h. This result indicates a decreasing Cr3+ concentration during electrolysis and until it drops to below the detection limit of CV, which agreed well with the result obtained from ICP-OES. It should be noted that the cathodic peak A attributed to Fe reduction also decreased after electrolysis, indicating the trace impurity of Fe ions was electrochemically removed as well. Therefore, the reduction peak A corresponds to the reduction of Fe2+ to iron metal (Fe2+ + 2e− → Fe), and the oxidation peak A′ corresponds to the oxidation of Fe metal to iron ions (Fe − 2e− → Fe2+).
3.3 Solubility of Cr2O3 in molten FLiNaK with ZrF4 additive
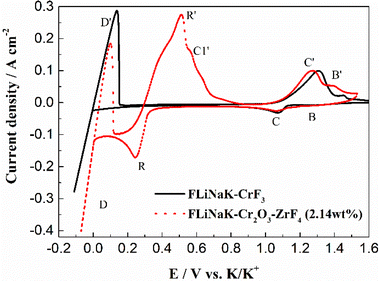 | ||
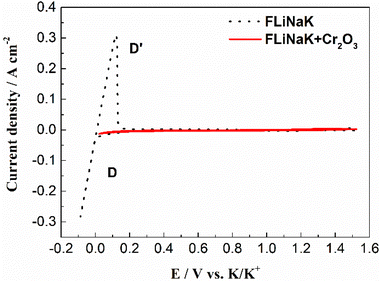
| Fig. 8 The CVs of FLiNaK-CrF3 and FLiNaK-ZrF4-Cr2O3 melt at 600 °C and scan rate of 0.1 V s−1. Working El.: W (S = 1.13 cm2); auxiliary El.: graphite; reference El.: Pt. | ||
It should be noted that, although Song et al.23 also studied the electrochemical behavior of the FLiNaK-ZrF4-Cr2O3 system, they only focused on the attribution of peaks at a single concentration, and did not systematically study the electrochemical law at different ZrF4 concentrations. Meanwhile, ref. 23 did not focus on the electrolytic removal of chromium. Therefore, the electrochemical measurement of FLiNaK-Cr2O3 under different ZrF4 conditions and the further electrolytic extraction of chromium will be studied subsequently.
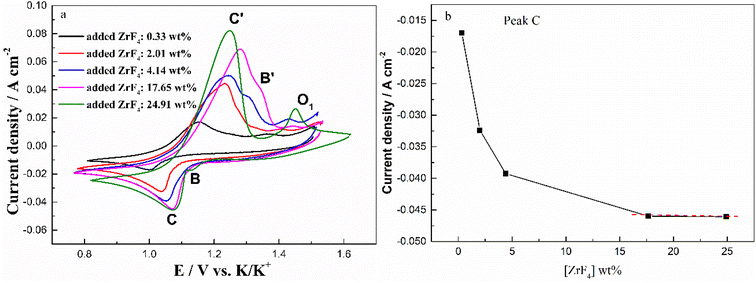
To further investigate the effect of ZrF4 concentration on the solubility of Cr2O3, the cyclic voltammograms of FLiNaK-Cr2O3 melt with different concentrations of ZrF4 were recorded and the results were shown in Fig. 10(a). As can be seen in Fig. 10(a), the current densities of reduction peaks B (Cr3+/Cr2+) and C (Cr2+/Cr) both gradually increased with ZrF4 additions. When the concentration of ZrF4 increased from 0.33 to 4.14 wt%, the reduction current density of peak C assigned to the reduction of Cr2+ to Cr distinctively increased from 0.016 to 0.044 A cm−2, while the reduction current density of B for Cr3+ to Cr2+ increased from 0.004 to 0.009 A cm−2. This result implied that the dissolved chromium ions caused by Cr2O3 dissolution gradually increased with ZrF4 additions, since the peak current density is proportional to the concentration of the electroactive species.
In addition to the redox peaks B/B′ and C/C′, a new oxidation peak O1 appeared (within the potential range 1.35–1.50 V vs. K/K+). The formation of oxidation peak O1 may be related to the formation of zirconium oxy-fluoride species in the FLiNaK-ZrF4-Cr2O3 melt. Previous studies19,21,23,26 also confirmed the existence of stable Zr(IV) oxy-fluoride species in molten fluoride media. The reasons for the formation of zirconium oxy-fluoride have been described in detail in previous text. Moreover, it was found that as the concentration of ZrF4 increased, the oxidation peak O1 current gradually increased, indicating that the concentration of the formed zirconium oxy-fluoride species also gradually increased.
Fig. 10(b) shows the relationship between the added ZrF4 concentration and peak current density (peak C). It can be clearly observed that the peak current density of Cr2+ to Cr gradually increases with the addition of ZrF4. When ZrF4 increases to 17.65 wt% and 24.91 wt%, the curve approaches the plateau as shown in Fig. 10(b). These observations indicate that ZrF4 can promote solubility of Cr2O3 in FLiNaK to a certain extent, and its maximum solubility can be achieved when the added concentration of ZrF4 corresponded to 17.65 wt%.
It should be noted that the solubility of Cr2O3 in molten FLiNaK with ZrF4 additive has already been determined by ICP-OES, as reported by Song et al.23 Actually, they found that the specific value of Cr2O3 solubility in FLiNaK can greatly increase from 122 ppm to 2300 ppm level (by 19 times) through ZrF4 additive, which agreed well with the results obtained by electrochemical analysis in case of present study. Besides, the theoretical decomposition voltage of zirconium is far more negative than that of chromium, and in this case the potential difference between Cr2+/Cr and Zr4+/Zr reductions is 0.83 V vs. K/K+, which is much larger than the minimum value of 200 mV required for electrolytic separation. Therefore, it is feasible to electrolyze chromium with Cr2O3 raw material from FLiNaK-ZrF4 melt.
3.4 Electrolysis of chromium from molten FLiNaK-ZrF4-Cr2O3 system
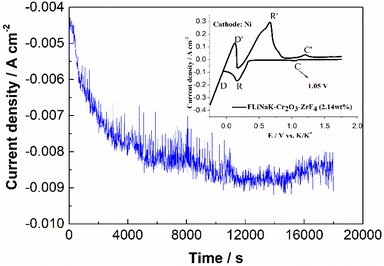
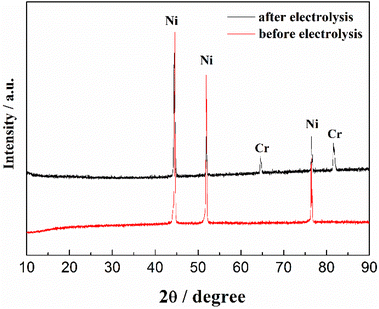
The CV of FLiNaK-Cr2O3-ZrF4 (2.14 wt%) was measured on Ni electrode at 600 °C, as shown in inset from Fig. 11. Compared with the W electrode, the signal of Cr2+ reduction to metallic Cr can still be observed on the Ni electrode, and the potential is basically consistent at 1.05 V vs. K/K+. Based on the analysis results in Fig. 8, 10 and inset (from Fig. 11), the potentiostatic electrolysis of FLiNaK-Cr2O3-ZrF4 (17.65 wt%) system was further performed on a Ni plate at the constant potential of 1.0 V (vs. K/K+) for 5 h. The current density varied in the range of 4–9 mA cm−2 in the whole electrolysis duration, as shown in Fig. 11. The time–current density curve fluctuates significantly, which possibly due to the continuous deposition of electrolytic products on the cathode Ni plate during the electrolysis process and a coating of uneven thickness is formed. After electrolysis, the electrode was cleaned, cut, embedded, polished, and the electro-deposits on Ni electrode were analyzed by SEM-EDS (Fig. 12(a–d)). The results showed that a chromium layer with the thickness of ca. 20 μm was formed and coated on the surface of Ni electrode, as shown in Fig. 12(c). XRD analysis further confirmed this layer corresponded to Cr metal (Fig. 13).Potentiostatic electrolysis in FLiNaK-Cr2O3-ZrF4 system can successfully produce Cr metal as the form of electro-deposited coating. These results prove the feasibility of electrolyzing chromium from Cr2O3 raw materials in molten fluorides containing ZrF4, and thus achieving the goal of chromium extraction.
4. Conclusion
The electrochemical behavior of Cr3+ was studied in the FLiNaK melts using W electrode at 600 °C by cyclic voltammetry. For a W electrode, the reduction of CrF3 in FLiNaK melts is two steps reaction: Cr3+ + e− → Cr2+ and Cr2+ + 2e− → Cr. Then, potentiostatic electrolysis of Cr in the FLiNaK-CrF3 melt was performed on W electrode for 21.5 h. The ICP-OES results showed that Cr3+ in melt decreased from the initial 345.30 ppm to 13.12 ppm, indicating an effective removal of Cr3+ with the practical removal content of 332.18 ppm. Moreover, the CV results showed a gradual decrease of reduction peak current for Cr3+ during electrolysis, and the reduction peaks B (Cr3+/Cr2+) and C (Cr2+/Cr) almost could not be detected by cyclic voltammetry after electrolysis. This result indicates a decreasing Cr3+ concentration and until to below the detection limit of CV.The CV of FLiNaK-Cr2O3 system was similar with that of blank FLiNaK, indicating that the solubility of Cr2O3 is quite low in FLiNaK melt. The electrochemical behavior of Cr2O3 after adding ZrF4 was studied in FLiNaK molten salt system on W electrode at 600 °C by cyclic voltammetry. The reduction peak current of Cr3+ obviously increases with ZrF4 addition, indicating that the solubility of Cr2O3 in FLiNaK can be greatly promoted by ZrF4 additive. When the concentration of ZrF4 added reaches 17.65 wt%, the solubility of Cr2O3 in FLiNaK salt reaches its maximum value. These results make the electroextraction of Cr with Cr2O3 from ZrF4-containing molten fluorides possible. Therefore, the potentiostatic electrolysis of FLiNaK-Cr2O3-ZrF4 (17.65 wt%) system was further performed on a Ni plate at the constant potential of 1.0 V (vs. K/K+) for 5 h. Characterization of the electrolytic product by SEM-EDS and XRD revealed that metallic Cr can be successfully obtained on the surface of Ni plate. This study verified the feasibility of electroextraction of Cr from CrF3 and Cr2O3 in molten fluorides.
Conflicts of interest
There are no conflicts to declare.Acknowledgements
This work was supported by the National Natural Science Foundation of China (Grant No. 22006150), Youth Innovation Promotion Association CAS (Grant No. 2023271), Shanghai Sailing Program (Grant No. 19YF1458200), and Natural Science Foundation of Shanghai (Grant No. 20ZR1464900).References
- M. Salanne, C. Simon, P. Turq and P. A. Madden, J. Fluorine Chem., 2009, 130, 38 CrossRef CAS.
- J. P. M. van der Meer and R. J. M. Konings, J. Nucl. Mater., 2007, 360, 16 CrossRef CAS.
- J. Krepel, B. Hombourger, C. Fiorina, K. Mikityuk, U. Rohde, S. Kliem and A. Pautz, Ann. Nucl. Energy, 2014, 64, 380 CrossRef CAS.
- H. Peng, M. Shen, C. Y. Wang, T. Su, Y. Zuo and L. D. Xie, RSC Adv., 2015, 5, 76689 RSC.
- S. Delpech, C. Cabet, C. Slim and G. S. Picard, Mater. Today, 2010, 13, 34 CrossRef CAS.
- T. Nagasaka, M. Kondo, T. Muroga, N. Noda, A. Sagara, O. Motojima, A. Suzuki and T. Terai, J. Nucl. Mater., 2009, 716, 386 Search PubMed.
- M. Kondo, T. Nagasaka, A. Sagara, N. Noda, T. Muroga, Q. Xu, M. Nagura, A. Suzuki and T. Terai, J. Nucl. Mater., 2009, 685, 386 Search PubMed.
- M. Kondo, T. Nagasaka, Q. Xu, T. Muroga, A. Sagara, N. Noda, D. Ninomiya, M. Nagura, A. Suzuki, T. Terai and N. Fujii, Fusion Eng. Des., 2009, 84, 1081 CrossRef CAS.
- L. C. Olson, J. W. Ambrosek, K. Sridharan, M. H. Anderson and T. R. Allen, J. Fluorine Chem., 2009, 130, 67 CrossRef CAS.
- J. Qiu, Y. Zou, G. Yu, H. Liu, Y. Jia, Z. Li, P. Huai, X. Zhou and H. Xu, J. Fluorine Chem., 2014, 168, 69 CrossRef CAS.
- D. Williams, L. Toth and K. Clarno, in ORNL/TM-2006/12, 2006 Search PubMed.
- D. Williams, D. Wilson, J. Keiser, L. Toth and J. Caja, Research on Molten Fluorides as High Temperature Heat Transfer Agents, American Nuclear Society Winter Meeting, 2003 Search PubMed.
- H. E. McCoy, R. L. Beatty, W. H. Cook, R. E. Gehlbach, C. R. Kennedy, J. W. Koger, A. P. Litman, C. E. Sessions and J. R. Weir, Nucl. Technol., 1970, 8, 156 CAS.
- ORNL, Chemical aspect of MSRE operations, 1971, http://www.energyfromthorium.com/pdf/ORNL-4658.pdf Search PubMed.
- T. Yoko and R. A. Bailey, J. Electrochem. Soc., 1984, 131, 2590 CrossRef CAS.
- R. A. Bailey, J. Appl. Electrochem., 1986, 16, 737 CrossRef CAS.
- D. Ludwig, L. Olson, K. Sridharan, M. Anderson and T. Allen, Corrosion Eng. Sci. Technol., 2011, 46, 360 CrossRef CAS.
- H. Peng, M. Shen, Y. Zuo, X. X. Tang, R. Tang and L. D. Xie, Electrochim. Acta, 2016, 222, 1528 CrossRef CAS.
- H. Peng, M. Shen, Y. Zuo, H. Y. Fu and L. D. Xie, J. Nucl. Mater., 2018, 510, 256 CrossRef CAS.
- H. Peng, W. Huang, L. D. Xie and Q. N. Li, J. Nucl. Mater., 2020, 531, 152004 CrossRef CAS.
- H. Peng, Y. L. Song, N. Ji, L. D. Xie, W. Huang and Y. Gong, RSC Adv., 2021, 11, 18708 RSC.
- H. Peng, N. Ji, W. Huang and Y. Gong, Int. J. Energy Res., 2023, 2023, 4447405 CrossRef.
- Y. L. Song, M. Shen, H. Peng, C. Y. Wang, S. F. Zhao, Y. Zuo and L. L. Xie, J. Electrochem. Soc., 2020, 167, 023501 CrossRef CAS.
- V. Danielik, P. Fellner, D. Sulekova and J. Thonstad, J. Electrochem. Soc., 2012, 159, C86 CrossRef CAS.
- D. Sulekova, V. Danielik, P. Fellner and J. Thonstad, Metall. Mater. Trans. B, 2013, 328, 44B Search PubMed.
- M. Shen, H. Peng, M. Ge, C. Y. Wang, Y. Zuo and L. D. Xie, RSC Adv., 2015, 5, 40708 RSC.
- M. Gibilaro, L. Massot, P. Chamelot, L. Cassayre and P. Taxil, Electrochim. Acta, 2013, 95, 185 CrossRef CAS.
- Y. Berghoute, A. Salmi and F. Lantelme, J. Electroanal. Chem., 1994, 365, 171 CrossRef CAS.
- A. D. Graves and D. Inman, Nature, 1965, 20, 481 CrossRef.
- H. Qiao, T. Nohira and Y. Ito, Electrochim. Acta, 2002, 47, 4543 CrossRef CAS.
- G. Durán-Klie, D. Rodrigues and S. Delpech, Electrochim. Acta, 2016, 195, 19 CrossRef.
- C. F. Baes Jr., J. Nucl. Mater., 1974, 51, 149 CrossRef.
- A. J. Bard and L. R. Faulkner, Electrochemical Methods: Fundamentals and Applications, Wiley, New York, 1980 Search PubMed.
| This journal is © The Royal Society of Chemistry 2023 |

