 Open Access Article
Atomic insights into the mechanisms of Al3+ or Cr3+ affecting ferrihydrite nucleation†
Wei Liab,
Yan Wangb,
Fan Liub,
Haijiao Xiec,
Hui Yin *b and
Tian Yi*a
aInstitute of Agricultural Quality Standards and Testing Technology Research, Hubei Academy of Agricultural Sciences, Wuhan, Hubei 430064, China. E-mail: yitian_16@163.com
bKey Laboratory of Arable Land Conservation (Middle and Lower Reaches of Yangtse River) Ministry of Agriculture, College of Resources and Environment, Huazhong Agricultural University, Wuhan 430070, PR China. E-mail: yinhui666@mail.hzau.edu.cn
cHangzhou Yanqu Information Technology Co., Ltd, Y2, 2nd Floor, Building 2, Xixi Legu Creative Pioneering Park, No. 712 Wen'er West Road, Xihu District, Hangzhou, Zhejiang 310003, P.R. China
First published on 7th September 2023
Abstract
Various exotic metal cations commonly coexist with ferrihydrite nanoparticles in natural environments. Lack of knowledge about the metal cations effects on ferrihydrite nucleation and growth greatly blights the deep understanding of ferrihydrite mineralogical properties and reactivities, and thus the fates of associated nutrients, heavy metals/metalloids, and organic pollutants. Here, the nucleation processes and mechanisms of ferrihydrite nanoparticles in the presence of Al3+ or Cr3+ were studied by combining visible spectroscopy, in situ quick X-ray absorption fine structure spectroscopy and quantum chemical calculations. The formation of ferrihydrite can be divided into three stages. In stage 1, Fe(H2O)63+ forms μ-oxo Fe dimers, with the gradual increase of Fe–O bond length (dFe–O) and disappearance of Fe–O multiple scattering. In stage 2, ferrihydrite particles begin to form and grow slowly, during which dFe–O continues to increase and edge- and corner-sharing Fe–Fe bonds appear. In stage 3, ferrihydrite growth rate increases significantly and continues to the end of the reaction, with the decreases of dFe–O. The presence of metal cations at a molar ratio of 0.1 to Fe hinders the formation of μ-oxo dimers by affecting the Fe3+ hydrolysis and polymerization at stage 1 and stage 2, but promotes the conversion of the μ-oxo dimer to the dihydroxo dimer with lower energy barrier and the creation of crystal growth sites and thus enhances the ferrihydrite nucleation and growth at stage 3.
1. Introduction
Ferrihydrite, a short-range-ordered Fe(III) oxyhydroxide with large specific surface area (SSA, up to ∼500 m2 g−1) and high surface activity, is widely found in various terrestrial environments.1–3 It occurs in many soils as the precursor to other crystalline Fe oxyhydroxides, such as goethite, hematite, and lepidocrocite.4 Because of its high density of reactive surface sites, ferrihydrite plays crucial roles as an important scavenger of heavy metals/metalloids, organic pollutants and nutrients in various geochemical processes.3,5 It is therefore important to understand in natural environments the ferrihydrite nanoparticles nucleation mechanisms and growth processes, which will greatly affect the mineral structural features and reactivities.Metal cations, anions, and natural organic matters widely exist in natural environments during the ferrihydrite nucleation, growth and transformation. Thus, ferrihydrite nanoparticles commonly contain various impurities (e.g., Al3+, Cr3+, Mn2+, SiO44−, humic acid) through incorporation, coprecipitation and/or adsorption.5–9 The existence of some anions (SiO44−) will favor the ferrihydrite formation, while other anions (SO42−) can inhibit the formation by restricting the formation of Fe dimer species as well as double corner bonding of octahedral/tetrahedral FeIII.10,11 Organic matters can bridge ferrihydrite particles to form aggregates with reduced SSA.6,12,13 Unlike anions and organic matters, cations can not only affect ferrihydrite formation process, but also substitute for Fe and thus affect structure and chemical compositions of ferrihydrite, as well as its reactivity with respect to metal sequestration, mineral stability and dissolution.7,14–16 However, the fundamental knowledge about the effects of coexisting cations on ferrihydrite formation is much less understood.17,18
Though many previous studies have studied the formation processes of ferrihydrite under various conditions, there is no consensus on the ferrihydrite nucleation mechanisms and growth processes, due to extremely small particles of and various structural defects in ferrihydrite nanoparticles.10 Most disagreement centers on the formation or not of Fe(III) oligomers larger than dimers.19 The classic model for ferrihydrite formation from Fe(III) salt solution is based on successive polymerization processes: (i) the Fe cations form hexacoordinated aquo complexes, Fe(H2O)63+; (ii) Fe monomers are self-coupled to form dimers; (iii) larger oligomers (trimers, tetramers, etc.) and/or polymers (Fe13 α-Keggin) form from the further addition of monomer and/or the aggregation of dimers; (iv) larger oligomers and/or polymers interact via olation and oxolation to form primary nuclei.5,19–22 However, other studies have argued that μ-oxo Fe(III) dimer is the dominant species in ferrihydrite formation without the appearance of larger Fe(III) oligomers, based on the results of extended X-ray adsorption fine structure (EXAFS) or Möessbauer spectroscopy.11,18 Further, although the inhibition effects of different cations (Al3+, Cr3+, Pb2+, Cu2+) on ferrihydrite growth formation was observed with small-angle X-ray scattering, due to quartz surface charge changing from negative to positive by cations adsorption and/or precipitation on nuclei surface,23,24 whether and how the coexisting cations can affect the formation of μ-oxo Fe(III) dimer or larger oligomers during ferrihydrite nucleation and growth processes are not clear.
Thus, in the present study, the effect of coexisting cations on ferrihydrite formation was studied by combining visible spectroscopy, in situ quick X-ray absorption fine structure spectroscopy (Q-XAFS) and quantum chemical calculations. Al3+ and Cr3+, two typical substituted cations in iron (hydr)oxides,8,25–27 were chosen, because they are highly hydrolysable cations, and their hydrolysis processes have been well identified.28,29 Exploring the atomic-level interactions among impurity cations and Fe species can help understand the formation processes and mechanisms of natural ferrihydrite nanoparticles.
2. Materials and methods
2.1 In situ Q-XAFS measurements
The Q-XAFS experiments were carried out at room temperature on the 1W1B beamline at the Beijing Synchrotron Radiation Facility (BSRF). A special reaction cell was made in the laboratory by polytetrafluoroethylene with a window covered by Kapton. The reaction was initiated by titrating 0.5 M KOH at 0.2 mL min−1 through an automatic potentiometric titrator (Metrohm 907 Titrando) with a remote-controlling computer outside the station into a 10 mL solutions (Fe system: 10 mL of 0.5 M Fe(NO3)3 solution; Al + Fe system: 9 mL 0.5 M Fe(NO3)3 solution mixed with 1 mL 0.5 M Al(NO3)3 solution; Cr + Fe system: 9 mL 0.5 M Fe(NO3)3 solution mixed with 1 mL 0.5 M Cr(NO3)3 solution).4 The initial reactants were mixed rapidly with a magnetic stirrer, and the reaction ended when pH was stabilized at 7.00 ± 0.05. The Fe K-edge XAFS spectra collection started after the addition of first drop KOH solution. Each spectrum was recorded over the energy range of 6915–7709 eV in fluorescence mode, which took about 3 min. An averaged spectrum of three continuous scans was proceeded to improve counting statistics for data processing.At the end of the reaction, the derived solids were characterized by powder X-ray diffraction on a Bruker D8 Advance diffractometer equipped with a LynxEye detector using Ni-filtered Cu Kα radiation (λ = 0.15418 nm). The diffractometer was operated at a tube voltage of 40 kV and a current of 40 mA a step of 0.02° and a scan rate of 1° min−1 over a range of 15–80° 2θ Cu kα.
2.2 Visible spectroscopy
The ferrihydrite synthesis was the same as that described above. After the initiation of the reaction by adding KOH solution, about 2 mL suspensions were taken out at predetermined intervals, and immediately transferred to a quartz cuvette (1 mm path length) and measured with a PerkinElmer UV-vis spectrophotometer (Lambda 650S) to obtain the spectra in the range of 400–850 nm. The increasement was 1 nm per step.2.3 Preparation of Fe oxyhydroxide references
Goethite was synthesized by adding KOH solution at a certain rate into Fe(NO3)3 solution (pH > 13), then aging at room temperature for 12 days.30 Hematite was synthesized by adding pre-heated KOH solution and NaHCO3 solution into Fe(NO3)3 solution (pH ∼7), then aging at 90 °C for 4 days.31 Lepidocrocite was synthesized with precipitating FeCl2 solution to pH 7 with NaOH and then oxidizing with air.4 Akaganéite was synthesized by holding FeCl3 solution in a closed vessel at 70 °C for 2 days.4,322.4 XAFS data processing and fitting
The extended X-ray absorption fine structure (EXAFS) spectra of reference Fe oxyhydroxides were measured at room temperature on the 1W1B beamline at BSRF. Fe K-edge EXAFS data were collected over the energy range of 6953–7884 eV in transmission mode.Processing of all the XAFS data was performed using the standard features of ATHENA.33 Spectra were background-subtracted using the following parameters: E0 = 7127 eV, Rbkg = 1, and k-weight = 2. In order to identify and quantify the various aqueous and solid Fe species during Fe3+ hydrolysis and ferrihydrite formation, linear combination fitting analysis (LCF) of Fe K-edge EXAFS spectra was performed using a pool of EXAFS spectra of reference Fe hydroxides (ferrihydrite, goethite, hematite, akaganéite, lepidocrocite) and aqueous Fe species (FeNitr02MHNO3, FeNitr02h and FeNitr05h) (S.I. 1, ESI;† obtained from ref. 18). These aqueous Fe species were composed of known proportions of μ-oxo dimer, Fe(H2O)63+, Fe(OH)(H2O)62+ and Fe(OH)3(H2O)3 species (S.I. 2, ESI†).
Shell by shell EXAFS fitting was also conducted. Structural parameters (bond length (R), coordination number (CN), and Debye-Waller factor (σ2)) were obtained by fitting the experimental k3-weighted EXAFS spectra to the standard EXAFS equation with ARTEMIS.34 Phase and amplitude functions for scattering paths were calculated using FEFF7 (ref. 35) based on the ferrihydrite structure adopted from ref. 2. The fittings were conducted over a K range of 2–11 Å−1 and an R range of 1–3.6 Å, with an amplitude reduction factor (S02) of 0.80 adopted from our previous study.36 To remove the confounding effects of the rising edge to the apparent absorption intensity of the pre-edge features, difference X-ray absorption near-edge spectra (ΔXANES) was conducted over an energy range of 7110–7136 eV.
2.5 Quantum chemical calculations
DFT calculations were carried out employing the hybrid Becke, three-parameter, Lee–Yang–Parr exchange–correlation functional (B3LYP) with the 6-31G(d) basis set using the Gaussian 09 program. In addition, the relationship between the transition states and the reactants/products was established by using intrinsic reaction coordinate (IRC) analyses.37 All the energies were corrected by the zero-point vibrational energy.3. Results and discussion
3.1 Visible spectrum analysis
Time-resolved visible spectra of the immediate products during the ferrihydrite formation in three different systems were depicted in Fig. 1 and S.I. 3, ESI.† Second-order derivative of a typical spectrum distinguishes two characteristic absorption peaks at 447 nm and 488 nm respectively (Fig. 1). Similar trends of visible spectra features are observed for the three systems with time. The intensity of the absorbance at 447 nm gradually increases at first, and then decreases till to the end. Concurrently, the absorbance at 488 nm gradually increases till to the end (Fig. 1).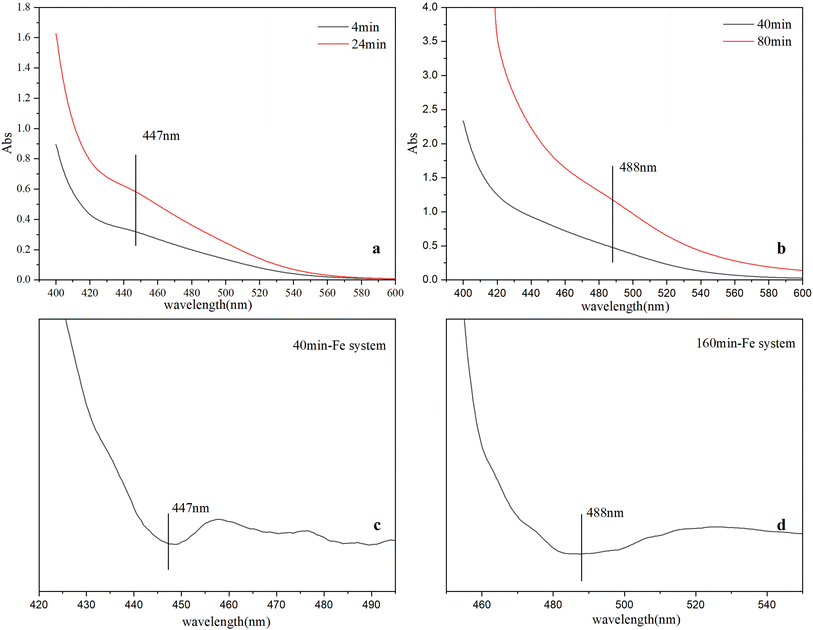 | ||
| Fig. 1 Visible spectra at different time in Fe system (a and b), second-order derivative of spectra at different time in Fe system (c and d). | ||
Since different Fe species have different optical excitation features, visible spectra can be used to identify Fe species (e.g., monomers, polymers, cluster and particles)18,38 during ferrihydrite nucleation and growth. The visible spectra of Fe species consist of several types of electronic transitions: (1) FeIII crystal or ligand field transitions; (2) interactions between magnetically coupled FeIII ions, and (3) the ligand (oxygen) to metal charge transfer transitions, excitations from the O (2p) valence band orbitals to the Fe (3d) crystal field type orbitals. The ligand field transition or d → d transition in Fe monomers is weak due to the spin forbidden, while these ligand field transitions are high in Fe polymers, clusters and particles owing to magnetic coupling to nearest neighboring Fe atoms.4 The d → d electron pair transition (EPT), a characteristic absorption found in Fe particles, is active due to super-exchange of electrons (magnetic coupling) between two neighboring FeIII ions separated by bridging O anions with geometrical arrangement, which can be used to identify the occurrence of Fe particles.39 The 447 nm peak indicates the existence of μ-oxo Fe dimer, while the absorbance at 488 nm is caused by EPT of Fe particles.4,18,39 The evolution of the spectra features indicate that with reactions going on, μ-oxo Fe dimers form first and then decreases while Fe nanoparticles gradually form, which is consistent with previous studies;11,18 and the formation of μ-oxo Fe dimers in Fe system is slowest in early period.
3.2 Q-XAFS analysis
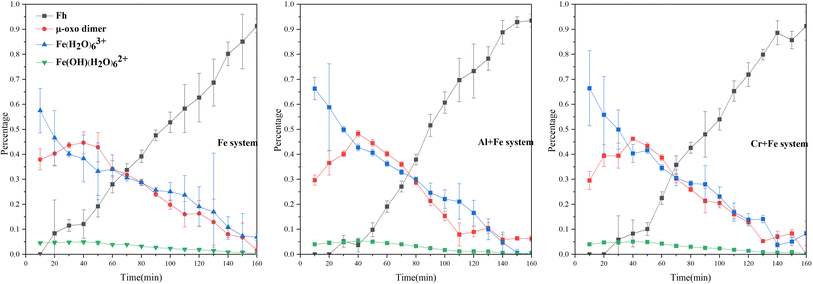
LCF analysis of EXAFS spectra for samples indicates that Fe hydrated monomer (Fe(H2O)63+) is the main species while 20–30% Fe species is μ-oxo Fe dimer and ∼4% Fe3+ as Fe(OH)(H2O)62+ in three systems when the reactions start (Fig. 3, S.I. 5–8, ESI†). The initial concentration of Fe(H2O)63+ in the three systems decreases in the order of Cr + Fe system > Al + Fe system > Fe system, while the initial concentration of μ-oxo Fe dimer increases in the order of Cr + Fe system (29.5%) < Al + Fe system (29.6%) < Fe system (37.9%). Inclusion of solid Fe oxyhydroxide standards, e.g., ferrihydrite, goethite, hematite, akaganéite, lepidocrocite, in the LCF analysis only slightly improves the fitting (S.I. 8, ESI†). This indicates that the concentration of crystalline solids is very low at the initial reaction stages.
With the reactions going on, the proportion of Fe(H2O)63+ decreases, while the proportion of μ-oxo Fe dimer and Fe(OH)(H2O)62+ increase after the reaction started for 40 min. The maximum amounts of μ-oxo Fe dimer in the Fe, Cr + Fe and Al + Fe systems are almost the same. After that, the concentration of μ-oxo Fe dimer starts to decrease till to the end of reaction. In this stage, inclusion of ferrihydrite, rather than other crystalline Fe hydroxides, can dramatically improve LCF fitting (S.I. 9, ESI†). This indicates that ferrihydrite gradually forms and increases. XRD patterns of the solids obtained at the end of reaction in the three systems confirm that two-line ferrihydrite nanoparticles are formed (S.I. 10, ESI†).
3.2.2.1 XANES and differential XANES. Time-resolved Fe K edge X-ray absorption near-edge spectra (XANES) and differential XANES spectra (ΔXANES) were presented in Fig. 4 to show the evolution feature of the Fe coordination geometry during reaction. The feature marked as A is attributed to a forbidden 1s → 3d transition, of which the intensity increases because of symmetry distortion or local coordination environment change from octahedron to tetrahedron. In the first 50 min, this feature shows two peaks splitting (which is demonstrated in ΔXANES) in Fe system, which has been observed for FeIII in octahedral geometry.11 And the intensity of the higher energy peak increases more than that of the lower energy peak with time. After 50 min, the peak splitting is no longer apparent, and the peak intensity gradually increases to the end. But in the other two systems, the peaks splitting lasts longer and disappears at ∼60 min.
 | ||
| Fig. 4 Time-resolved Fe K edge ΔXANES for the intermediates in the three systems (the XANES spectrum for the 10 min intermediate in each system was used as standard for ΔXANES calculation). | ||
The edge energy monotonically decreases as a function of time with FeIII hydrolysis and precipitation, particularly in the lower ‘half’ of the edge (marked as B in Fig. 4), where a maximum downward shift of 0.6 eV is measured in the Fe system and 0.4 eV in the other two systems. A positive relationship is shown between this feature and the covalency of first coordination shell bonding in μ-oxo-bridged FeIII molecules as well as greater distortion.41 Thus, the increased disorder in the first coordination shell (S.I. 12, 14, 16, ESI†) and formation of μ-oxo Fe dimer (Fig. 3) result in the decrease in the edge energy.
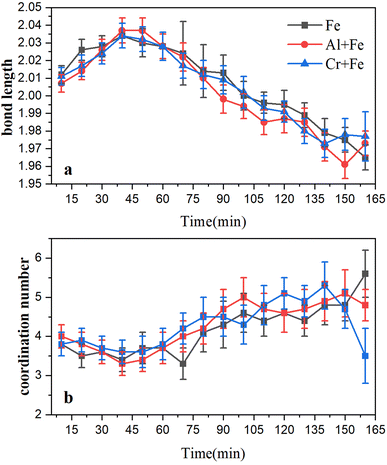
The peak of the white line, marked as C in Fig. 4, corresponding to the 1s → 4p transition, decreases in intensity at first 40–50 min, and then increases. The maximum intensity of the white line peak and its energy position can vary as a function of average bond distance within the first coordination shell, with a more intense peak at lower energy resulting from an average increase in bond distance and vice versa.42 The change of the feature C intensity suggests that the Fe–O bond length increases first and then decreases in the reaction, which is confirmed by shell by shell EXAFS fitting as following (Fig. 6).
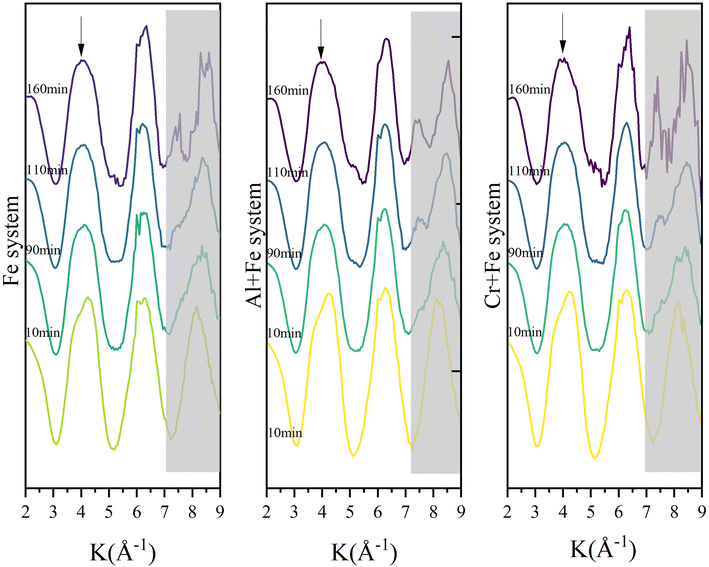
3.2.2.2 EXAFS. The Fourier transformed Fe K-edge EXAFS spectra of the reaction intermediates in the three systems are presented in Fig. 5. At the beginning, the single scattering path (∼2.01 Å) and multiple scattering paths (∼3.55 Å, ∼4.04 Å) of Fe–O first shell are the main scatterings, and the scatterings from Fe–Fe pairs is not obvious. As the reaction goes on, the intensity of Fe–O scatting decreases significantly. Especially, the multiple scattering of the Fe–O shell gradually decreases and disappears rapidly after ∼50 min. At the same time, the single scattering of Fe–Fe1 pair (edge-sharing Fe–Fe bond) with an interatomic distance of 3.06 Å appears first, followed by the appearance of the single scattering peak of Fe–Fe2 pair (corner-sharing Fe–Fe bond) with an interatomic distance of ∼3.39 Å. After then, the scattering intensities of both Fe–Fe1 and Fe–Fe2 pairs gradually increase with time.
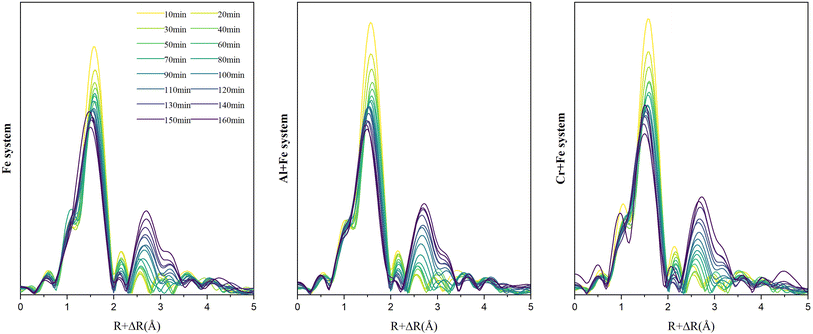 | ||
| Fig. 5 Time-resolved Fourier transformed Fe K-edge EXAFS spectra of the reaction intermediates in the three systems. | ||
To a better understanding of Fe coordination environment evolution during the ferrihydrite formation, Fe K-edge EXAFS fitting was conducted (Fig. 6; S.I. 11–16, ESI†). The fitting results demonstrate that, during the ferrihydrite formation, the Fe–O bond length in the Fe system increases firstly from ∼2.01 Å to ∼2.03 Å from 0–50 min, and then decreases to ∼1.96 Å till to the end. However, the presence of Al3+ or Cr3+ has almost no significant effect on the Fe–O bond length evolution.
3.3 DFT calculations
Though only μ-oxo Fe dimer was detected at the initial stage of FeIII hydrolysis, the long Fe–Fe bond length (∼3.6 Å), which is covered by Fe–O multiple scatting in Fourier transformed EXAFS spectra, is not structurally compatible with any known Fe oxides, which make it unlikely to be the direct precursor of ferrihydrite. Due to similar Gibbs free energies of formation, dihydroxo dimer with edge-sharing motif (one of the essential structural units of Fe hydroxides), can be reconfigured from μ-oxo Fe dimer. But dihydroxo dimers are consumed in ferrihydrite nucleation and formation too fast to be detected. One of the possible conversion pathways from the μ-oxo Fe–Fe/Fe–Al/Fe–Cr μ-oxo dimer to the dihydroxo dimer has been proposed based on a density functional theory (DFT) calculation, including the structures of the transition states (TS) and the reaction products (MIN) involved in the reaction paths, to investigate the effects of Al3+ or Cr3+ on ferrihydrite formation (S.I. 17, ESI†). The pathway consists of three steps: dehydration, protonation and ring closure.In the Fe system, the energy barriers (ΔG) of the three steps are 33.16 kJ mol−1, 83.09 kJ mol−1 and 19.37 kJ mol−1, respectively (Fig. 7). This indicates that step 2 is probably the rate-determining step, which agrees with previous studies.18 In the Fe + Al system, ΔG values of the three steps are calculated to be 35.08 kJ mol−1, 27.91 kJ mol−1 and 20.66 kJ mol−1, respectively (Fig. 7). That is, step 1 is probably the rate-determining step in the Fe + Al system. In the Cr + Fe system, ΔG values of the three steps are 24.95 kJ mol−1, 52.27 kJ mol−1 and 16.61 kJ mol−1, respectively (Fig. 7). Similar to that in the Fe system, step 2 is the rate-determining step.
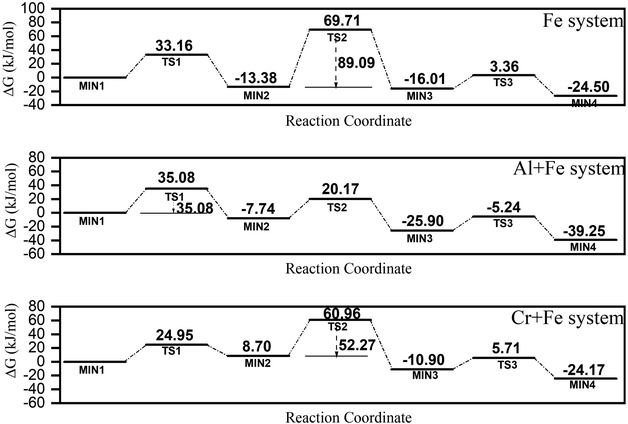 | ||
| Fig. 7 A proposed conversion pathway of μ-oxo to dihydroxo dimer in three systems predicted based on quantum chemical calculations. | ||
From the ΔG values calculated for the three systems above, it is found that the conversation paths of Fe–Cr or Fe–Al μ-oxo dimer generally have lower energy barriers compared to those of Fe–Fe μ-oxo dimer, especially in the conversation of Fe–Al μ-oxo dimer.
3.4 Effects of Al or Cr on ferrihydrite crystallization
The ferrihydrite nucleation and growth can be divided into three stages:Stage 1: the concentration of Fe hydrated monomer (Fe(H2O)63+) decreases, while the concentration of μ-oxo Fe dimer increases. Fe–O bond length gradually increases, and Fe–O multiple scattering disappears.
Stage 2: Fe hydrated monomer (Fe(H2O)63+) continues to decrease and μ-oxo Fe dimer continues to increase to its maximum. At this time, ferrihydrite particles begin to form and grow slowly. Fe–O bond length continues to increase and reach its maximum, and Fe–Fe pairs with average bond lengths of ∼3.06 Å and ∼3.39 Å appear.
Stage 3: ferrihydrite nanoparticles grow. Both the contents of Fe(H2O)63+ and μ-oxo Fe dimer continue to decrease, and the ferrihydrite growth rate in each system increases significantly and continues till to the end of the reaction. Fe–O bond length decreases.
Ferrihydrite formation begins with the aggregation of Fe(H2O)63+ hydration ions to form μ-oxo dimer. At this time, the Fe–O bond length increases from the average Fe–O bond length of Fe3+ hydration ions (2.015 ± 0.002 Å) to the average Fe–O bond length of μ-oxo dimer (2.046 ± 0.114 Å). The μ-oxo dimer is then polymerized to form ferrihydrite primary nuclei. At this point, the Fe–O bond length starts to decrease from the average Fe–O bond length of μ-oxo dimer to the average Fe–O bond length of ferrihydrite (1.997 Å).11 Though it was stated that α-Keggin Fe13 is an intermediate product during ferrihydrite formation with situ small angel X-ray scatting measurements,21 it was not detected in current study, which may be probably due to its high reactivity and short life time.
Compared with Fe3+, the cations (Cr3+ and Al3+) are highly hydrolysable cations with lower electronegativity (χ(Cr3+) = 1.6, χ(Al3+) = 1.5 and χ(Fe3+) = 1.8) and smaller ionic radii, and thus can hinder the hydrolysis and polymerization processes.43,44 At the beginning of reaction, the concentrations of Fe(OH)(H2O)62+ in the first order hydrolysate of Fe3+ in the Al + Fe system (3.8%) and the Cr + Fe system (3.7%) are lower than that in the Fe system (4.1%), owing to the influence of Al3+ and Cr3+ on the hydrolysis of Fe3+. In stage 1 and stage 2, coexisting Al3+ or Cr3+ can also affect the polymerization of Fe3+, resulting in a lower content of μ-oxo dimer in the Al + Fe or Cr + Fe system than that in the Fe system. Moreover, ferrihydrite nanoparticles occur in the Fe system earlier than that in the Al + Fe and Cr + Fe systems (Fig. 3), and the content of ferrihydrite in the Fe system (12.1%) is also higher than that in the Al + Fe (3.7%) and Cr + Fe systems (8.3%) at the end of stage 2. These results show that in stage 1 and stage 2, Al3+ or Cr3+ inhibits the formation of μ-oxo dimer by affecting the hydrolysis and polymerization of Fe3+ and thus inhibit the ferrihydrite nanoparticle growth.
In stage 3, the formation rates of ferrihydrite in the Al + Fe (0.75% ferrihydrite per min) and Cr + Fe systems (0.69% ferrihydrite per min) are larger than that in the Fe system (0.66% per min). Due to high Fe3+ concentration and low pH, the conversion of μ-oxo Fe dimer to dihydroxo dimer and then to nucleus, is the main pathway of ferrihydrite formation.18 With lower energy barrier, the conversion of Fe–Al μ-oxo dimer happens more easily than Fe–Cr μ-oxo dimer, and the conversion of Fe–Fe μ-oxo dimer is the hardest. Besides, lower coordination number (CN) of Fe–Al/Cr in the Al + Fe system or Cr + Fe system than that in the Fe system, indicates that the existence of Al3+ or Cr3+ will introduce structure defects into ferrihydrite structure, especially the former. Lower energy barrier and more crystal growth sites caused by structure defects result in faster formation of ferrihydrite nanoparticles.
4. Conclusion
Using a combination of visible spectra, Q-XAFS and quantum chemical calculations, the effects of foreign cation on ferrihydrite transformation have been studied. Only μ-oxo dimers were detected with/without the existence of Al3+ and Cr3+. The existence of Al3+ or Cr3+ inhibits the formation of μ-oxo dimer in the initial stage by affecting the hydrolysis and polymerization of Fe3+, and promotes the conversion of μ-oxo dimer to dihydroxo dimer with lower energy barrier and more crystal growth sites in the later stage. These findings will help to understand the formation processes and mechanisms of ferrihydrite nanoparticles in natural environments and the fate of metals associated with Fe hydroxides.Conflicts of interest
There are no conflicts to declare.References
- A. R. C. Grigg, L. K. ThomasArrigo, K. Schulz, K. A. Rothwell, R. Kaegi and R. Kretzschmar, Environ. Sci.: Processes Impacts, 2022, 24, 1867–1882 RSC.
- F. M. Michel, L. Ehm, S. M. Antao, P. L. Lee, P. J. Chupas, G. Liu, D. R. Strongin, M. A. Schoonen, B. L. Phillips and J. B. Parise, Science, 2007, 316, 1726–1729 CrossRef CAS PubMed.
- Y. N. Vodyanitskii and S. A. Shoba, Eurasian Soil Sci., 2016, 49, 796–806 CrossRef CAS.
- R. M. Cornell and U. Schwertmann, The Iron Oxides: Structure, Properties, Reactions, Occurences and Uses, WILEY-VCH, 2003 Search PubMed.
- S. Lee and H. Xu, ACS Earth Space Chem., 2019, 3, 503–509 CrossRef CAS.
- H. Du, C. L. Peacock, W. Chen and Q. Huang, Chemosphere, 2018, 207, 404–412 CrossRef CAS PubMed.
- C. Liang, F. Fu and B. Tang, J. Hazard. Mater., 2021, 417, 126073 CrossRef CAS PubMed.
- A. Manceau and W. P. Gates, Clay Miner., 2013, 48, 481–489 CrossRef CAS.
- Y. Tang, F. M. Michel, L. Zhang, R. Harrington, J. B. Parise and R. J. Reeder, Chem. Mater., 2010, 22, 3589–3598 CrossRef CAS.
- X. Wang, M. Zhu, S. Lan, M. Ginder-Vogel, F. Liu and X. Feng, Chem. Geol., 2015, 415, 37–46 CrossRef CAS.
- R. N. Collins, K. M. Rosso, A. L. Rose, C. J. Glover and T. David Waite, Geochim. Cosmochim. Acta, 2016, 177, 150–169 CrossRef CAS.
- L. K. ThomasArrigo, R. Kaegi and R. Kretzschmar, Environ. Sci. Technol., 2019, 53, 13636–13647 CrossRef CAS PubMed.
- H. Du, Q. Huang, M. Lei and B. Tie, ACS Earth Space Chem., 2018, 2, 556–564 CrossRef CAS.
- C. M. Hansel, D. R. Learman, C. J. Lentini and E. B. Ekstrom, Geochim. Cosmochim. Acta, 2011, 75, 4653–4666 CrossRef CAS.
- C. P. Johnston and M. Chrysochoou, Environ. Sci. Technol., 2016, 50, 3589–3596 CrossRef CAS PubMed.
- C. Tokoro, M. Kadokura and T. Kato, Adv. Powder Technol., 2020, 31, 859–866 CrossRef CAS.
- C. Dai, J. Liu and Y. Hu, Environ. Sci.: Nano, 2018, 5, 141–149 RSC.
- M. Zhu, C. Frandsen, A. F. Wallace, B. Legg, S. Khalid, H. Zhang, S. Mørup, J. F. Banfield and G. A. Waychunas, Geochim. Cosmochim. Acta, 2016, 172, 247–264 CrossRef CAS.
- A. L. Rose, M. W. Bligh, R. N. Collins and T. D. Waite, Langmuir, 2014, 30, 3548–3556 CrossRef CAS PubMed.
- J. P. Jolivet, C. Chaneac and E. Tronc, Chem. Commun., 2004, 481–487, 10.1039/b304532n.
- J. S. Weatherill, K. Morris, P. Bots, T. M. Stawski, A. Janssen, L. Abrahamsen, R. Blackham and S. Shaw, Environ. Sci. Technol., 2016, 50, 9333–9342 CrossRef CAS PubMed.
- L. Dyer, P. D. Fawell, O. M. Newman and W. R. Richmond, J. Colloid Interface Sci., 2010, 348, 65–70 CrossRef CAS PubMed.
- Y. Hu, Q. Li, B. Lee and Y. S. Jun, Environ. Sci. Technol., 2014, 48, 299–306 CrossRef CAS PubMed.
- C. Dai and Y. Hu, Environ. Sci. Technol., 2015, 49, 292–300 CrossRef CAS PubMed.
- A. C. Cismasu, F. M. Michel, J. F. Stebbins, C. Levard and G. E. Brown, Geochim. Cosmochim. Acta, 2012, 92, 275–291 CrossRef CAS.
- B. Singh and R. J. Gilkes, Eur. J. Soil Sci., 1992, 43, 77–98 CrossRef CAS.
- F. Trolard, G. Bourrie, E. Jeanroy, A. Herbillon and H. martin, Geochem. Cosmochim. Acta, 1995, 59, 1285–1297 CrossRef CAS.
- N. Torapava, A. Radkevich, D. Davydov, A. Titov and I. Persson, Inorg. Chem., 2009, 48, 10383–10388 CrossRef CAS PubMed.
- L. Allouche, C. GeÂrardin, T. Loiseau, G. FeÂrey and F. Taulelle, Angew. Chem., Int. Ed., 2000, 39, 511–514 CrossRef CAS PubMed.
- H. Yin, Y. Wu, J. Hou, X. Yan, Z. Li, C. Zhu, J. Zhang, X. Feng, W. Tan and F. Liu, Chem. Geol., 2020, 532, 119378 CrossRef CAS.
- W. Li, X. Liang, P. An, X. Feng, W. Tan, G. Qiu, H. Yin and F. Liu, Sci. Rep., 2016, 6, 35960 CrossRef CAS PubMed.
- B. Hu, X. Yan, W. Wang, Y. Li, H. Li, M. Hong, F. Liu and H. Yin, Chem. Geol., 2022, 121167 CrossRef CAS.
- B. Ravel and M. Newville, J. Synchrotron Radiat., 2005, 12, 537–541 CrossRef CAS PubMed.
- S. D. Kelly, D. Hesterberg and B. Ravel, Analysis of soils and minerals using X-ray absorption spectroscopy, in Methods of Soil Analyses, Part 5: Mineralogical Methods, SSSA Book Series, no. 5, 2008, ch. 14, pp. 387–464 Search PubMed.
- J. J. Rehr, R. C. Albers and S. Zabinsky, Phys. Rev. Lett., 1992, 69, 3397–3400 CrossRef CAS PubMed.
- H. Yin, F. Liu, X. Feng, T. Hu, L. Zheng, G. Qiu, L. K. Koopal and W. Tan, Geochim. Cosmochim. Acta, 2013, 117, 1–15 CrossRef CAS.
- G. Carlos and H. Bernhard Schlegel, J. Chem. Phys., 1989, 90, 2154–2161 CrossRef.
- D. M. Sherman, Phys. Chem. Miner., 1985, 12, 161–175 CrossRef CAS.
- L. Smoláková, T. Grygar, L. Čapek, O. Schneeweiss and R. Zbořil, J. Electroanal. Chem., 2010, 647, 8–19 CrossRef.
- A. Manceau and V. A. Drits, Clay Miner., 1993, 28, 165–184 CrossRef CAS.
- J. G. DeWitt, X-ray absorption spectroscopic studies of the dinuclear iron center in methane monooxygenase and the sulfur and chlorine centers in photographic materials, Stanford University, 1993 Search PubMed.
- J. E. Katz, X. Zhang, K. Attenkofer, K. W. Chapman, C. Frandsen, P. Zarzycki, K. M. Rosso, R. W. Falcone, G. A. Waychunas and B. Gilbert, Science, 2012, 337, 1200–1203 CrossRef CAS PubMed.
- Y. Zhang, Inorg. Chem., 1982, 21, 3886–3889 CrossRef CAS.
- B. R. D. Shannon, Acta Crystallogr., 1976, 32, 751 CrossRef.
Footnote |
| † Electronic supplementary information (ESI) available. See DOI: https://doi.org/10.1039/d3ra02945j |
| This journal is © The Royal Society of Chemistry 2023 |

