 Open Access Article
Creative Commons Attribution 3.0 Unported Licence
Efficient dye removal from industrial wastewater using sustainable activated carbon and its polyamide nanocomposite derived from agricultural and industrial wastes in column systems
Ahmed M. Zayed*a,
Bahaa S. Metwally ab,
Mostafa A. Masoud
 *a,
Mahmoud F. Mubarakc,
Hussain Shendya,
Mahmoud M. Abdelsatara,
Petros Petrouniasd,
Ahmed H. Ragabe,
Abeer A. Hassane and
Mahmoud S. M. Abdel Waheda
aApplied Mineralogy and Water Research Lab (AMWRL), Geology Department, Faculty of Science, Beni-Suef University, Beni Suef, 62521, Egypt. E-mail: ahmed.zayed@science.bsu.edu.eg; mostafa_masoud@science.bsu.edu.eg
bTextile Technology Department, Faculty of Technology and Education, Beni-Suef University, Beni-Suef, 62521, Egypt
cPetroleum Application Department, Egyptian Petroleum Research Institute, 1 Ahmed El-Zomor Street, El-Zohour Region, Nasr City, Cairo, 11765, Egypt
dChemical Process & Energy Resources Institute, Centre for Research & Technology Hellas (CERTH), 15125 Athens, Greece
eChemistry Department, College of Science, King Khalid University, P.O. Box 9004, Abha, 61413, Saudi Arabia
First published on 22nd August 2023
Abstract
Sugar beet crown (SBC) waste was employed to produce sustainable activated carbon (AC) by a thermo-chemical activation procedure using a fixed ratio of H3PO4/SBC (1![[thin space (1/6-em)]](https://www.rsc.org/images/entities/char_2009.gif) :
:![[thin space (1/6-em)]](https://www.rsc.org/images/entities/char_2009.gif) 1 w/w ratio) at 550 °C/2 h. An activated carbon/polyamide nano-composite (AC/PA) was also prepared through the polymerization of the fabricated AC (90%) with polyamide (PA, 10%) synthetic textile waste using a proper dissolving agent at a specified w/w ratio with the employed polymer (formic acid/PA = 82/18%). Both AC and its derivative AC/PA were employed in the remediation of dyes from industrial wastewater in column systems, and their efficiencies were compared at various applied experimental conditions. The adsorption of the industrial dye waste (IDW) was a pH-, flow rate-, and bed thickness-controlled process by the regarded adsorbents. Kinetic studies confirmed the suitability of the Thomas equation over the Yoon and Nelson model in predicting the dynamic adsorption process of IDW by AC and AC/PA as was assured by the close agreement among the calculated and experimental uptake capacities of both adsorbents at the same applied flow rates, suggesting the chemisorption nature of IDW adsorption. Additionally, electrostatic attraction was the leading mechanism of IDW adsorption by AC and AC/PA composite with some advantages of the former over the latter.
1 w/w ratio) at 550 °C/2 h. An activated carbon/polyamide nano-composite (AC/PA) was also prepared through the polymerization of the fabricated AC (90%) with polyamide (PA, 10%) synthetic textile waste using a proper dissolving agent at a specified w/w ratio with the employed polymer (formic acid/PA = 82/18%). Both AC and its derivative AC/PA were employed in the remediation of dyes from industrial wastewater in column systems, and their efficiencies were compared at various applied experimental conditions. The adsorption of the industrial dye waste (IDW) was a pH-, flow rate-, and bed thickness-controlled process by the regarded adsorbents. Kinetic studies confirmed the suitability of the Thomas equation over the Yoon and Nelson model in predicting the dynamic adsorption process of IDW by AC and AC/PA as was assured by the close agreement among the calculated and experimental uptake capacities of both adsorbents at the same applied flow rates, suggesting the chemisorption nature of IDW adsorption. Additionally, electrostatic attraction was the leading mechanism of IDW adsorption by AC and AC/PA composite with some advantages of the former over the latter.
1. Introduction
According to their origin, structure, and uses, dyes are categorized into several types such as azo, direct, reactive, mordant, acid, basic, disperse, and sulfide dyes1,2 and are commonly used in textile industries. Additionally, these dyes are applied in a variety of industries, such as the production of batteries, food, paper, and leather tanning, producing large amounts of colored wastewater.3 These wastes are hazardous to the environment, living species, and human health due to their high concentrations of organic pollutants that are extremely toxic, and they have disagreeable taste, odor, and color. About 7 × 10⁷ tons of synthetic dyes are produced worldwide annually, with over 10![[thin space (1/6-em)]](https://www.rsc.org/images/entities/char_2009.gif) 000 tons of such dyes used by textile industries.4 The untreated release of dyes into aquatic ecosystems, such as lakes, rivers, and streams, poses major ecotoxicological risks and has a toxic effect on living things.5 Therefore, the world will need to solve this industrial wastewater problem with different methods.
000 tons of such dyes used by textile industries.4 The untreated release of dyes into aquatic ecosystems, such as lakes, rivers, and streams, poses major ecotoxicological risks and has a toxic effect on living things.5 Therefore, the world will need to solve this industrial wastewater problem with different methods.
Precipitation, coagulation, filtration, ion exchange, advanced oxidation, bioremediation, and activated sludge mechanisms represent some of the physical, chemical, and biological technologies used for dye removal from wastewater.6–9 Comparing adsorption with other techniques, it is important to consider their specific strengths and limitations. For instance, chemical oxidation can be highly effective in removing certain organic pollutants using strong oxidizing agents. Bioremediation, on the other hand, utilizes microorganisms to degrade organic pollutants, making it suitable for certain types of wastewaters.8,10 Activated sludge mechanisms involve the use of biological processes for the treatment of wastewater, and it is particularly effective in removing organic matter. However, most of these traditional treatment procedures are undesirable because of their operational complicity and costs,11 causing system corrosion, hazardous by-product production, consumption of chemicals, pH sensitivity, sludge generation, as well as disintegration of the microorganisms and organic materials.12–14 Additionally, some of these procedures (biological ones) may raise the concentrations of biochemical oxygen demand (BOD) and chemical oxygen demand (COD) in the treated water. Regarding filtration, the filter openings are prone to clogging.15 Conversely, the adsorption process is the most recommended treatment strategy due to its high efficiency, applicability in a wide pH range, low cost, simplicity, and viability for large-scale applications.10,11,16
To carry out adsorption studies and to determine the essential parameters for controlling the removal of contaminants from wastewater, both batch and column methods are necessary.17 Fixed bed adsorption column represents one of the most popular and effective methods for removing contaminants from water. However, batch adsorption is preferred in laboratory-scale experiments as it requires less time, only a small amount of material, and is used to calculate the maximum adsorption capacity of the adsorbent.18 The column system is preferable to batch adsorption because of its simple operation, high contact time with the adsorbent, quicker adsorption process, and higher amount of adsorbate, so it can be applied at a large scale rather than a batch system.
Activated carbon (AC), also known as activated charcoal, is carbon that has been processed to have small, low-volume pores that increase the surface area available for adsorption or chemical reactions. One of the two following methods can be used to activate carbon: (1) physical activation, in which the raw material is transformed into activated carbon using hot gases. Air is then introduced to burn out the gases, creating a graded, screened, and de-dusted form of activated carbon. Generally, one or more of the following procedures are used to accomplish this: (a) biomass carbonization, which involves pyrolyzing the carbon-containing material at temperatures between 600 and 900 °C,19 often in an inert environment with gases such as argon or nitrogen. (b) Activation/oxidation, which is the second stage, aims to provide high internal porosity and surface area to enable and enhance the adsorption function. At temperatures above 250 °C, usually in the range of 600–1200 °C, raw material or carbonized material is exposed to oxidizing atmospheres (oxygen or steam). The activation is performed by heating the sample for 1 h in a muffle furnace at 450 °C in the presence of air.20 (2) Chemical activation, in which the carbon material is impregnated with certain chemicals. According to,21 the chemical is often an acid, a strong base, or a salt, such as phosphoric acid, potassium hydroxide, sodium hydroxide, potassium carbonate, calcium chloride, and zinc chloride. Then, the carbon is heated to high temperatures (between 250 and 600 °C). The temperature is believed to activate the carbon at this stage by forcing the material to open up and have more microscopic pores. Due to lower temperatures, higher quality consistency, and quicker activation times, chemical activation is preferred to physical activation.22
AC is produced from carbonaceous source materials such as bamboo, coconut husk, willow peat, wood, coir, lignite, coal, and petroleum pitch. Owing to their properties, it is also utilized in a variety of applications, including medicine, metals recovery, the food and beverage industry, acute intoxication treatment, water purification, biogas purification, and air emission purification. In water treatment, AC adsorption is now thought to be the most common and efficient physical approach,23–25 as it is composed of a microporous, homogenous structure with a high surface area and radiation stability.
Recently, there has been a global trend towards the valorization of unexploited materials and waste as a means to address the issue of environmental pollution.7,22,26–32 One such approach is the valorization of some agricultural wastes such as sugar beet to produce AC.33,34 Sugar beet is one of the most important sugar-producing plants worldwide, as the root contains a lot of sucrose. About 11 million tons of sugar beets were produced in Egypt in 2018.35 The root contains about 75% water, 20% soluble solids, 16% sucrose, and 4% nitrogenous and mineral salts. These salts, particularly sodium and potassium salts, prevent sugar from crystallizing and reduce crop quality.35 The leaves are numerous and broad, growing in a tuft from the crown of the beet, which is usually level with or just above the ground surface. SBC (sugar beet crown that includes stem & leaves) is mainly composed of cellulose, hemicellulose, pectin, and lignin, which reflects the enrichment with carbohydrates, fibers, proteins, and elements, such as sodium, potassium, calcium and iron.36 Additionally, SBC has a high ratio of carbon that makes it available as a raw material for activated carbon synthesis.37 Moreover, SBC is a cost-effective raw material compared to some other carbon sources. The annual landfill dumping of SBC in huge volumes may contribute to some environmental issues since the SBC decomposition emits unpleasant odors and attracts pests, posing health risks. Additionally, the waste produces greenhouse gases like methane, contributing to climate change if not managed effectively.
Polyamide (PA), commonly known as nylon, occurs both naturally and artificially. Polyamide fiber waste is a cheap product resulting from textile factories that are characterized by high durability and strength. The incorporation of PA in the activated carbon composites can enhance their durability and strength. Additionally, the availability of PA wastes for low costs can reduce the overall production expenses of the activated carbon composites. However, the improper disposal of PA wastes as synthetic fibers can cause environmental pollution, as these wastes are not easily biodegradable and can accumulate in ecosystems. PA wastes can also break down into microplastics, contaminating soil, water, and air, posing risks to the environment.38 Furthermore, PA wastes may contain chemical residues that can leach into the environment, causing toxic effects on organisms and disrupting hormonal systems.
Therefore, the current work aims to: (1) valorize the negative environmental impact of SBC as an agro-residue through its conversion into valuable AC via thermo-chemical activation process at 550 °C/2 h; (2) reduce the deleterious effect of PA through its incorporation in the production of the AC/PA nanocomposite via polymerization process; (3) compare the efficiency of both derivatives (AC & AC/PA) in the remediation of dyes from industrial wastewater using a column system under different experimental parameters (pH, bed thickness, flow rate).
2. Materials and methods
2.1. Raw materials
Sugar beet crown waste (SBC) samples were compiled from cultivated areas with sugar beet crops in the Deshasha area, Beni-Suef Governorate during the harvesting period (Fig. 1a). These SBC samples were required to produce valuable activated carbon. Polyamide 6 (PA6) samples, which are considered one of the most common polymer plastics and/or man-made yarn industrial wastes, were collected from Salamtext Factory, Industrial Zone of El Obour City, Egypt (Fig. 1b). The PA6 samples are important for the conversion of the prepared AC into the AC/PA composite.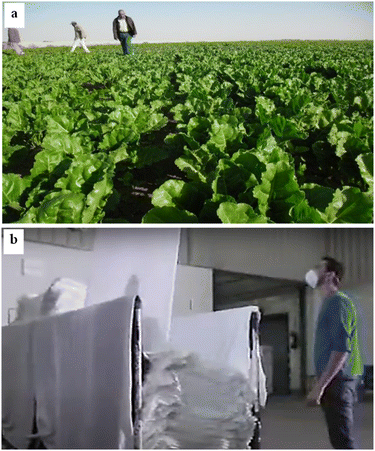 | ||
| Fig. 1 Sugar beet crown (SBC) collected from farms cultivating the sugar beet crop at Beni-Suef Governorate (a); polyamide (nylon) waste collected from the Salamtext Factory (b). | ||
2.2. Preparation of the collected raw materials
The SBC samples were washed with tap water (TW) to remove any adhered deleterious materials such as dust. The washed sample was boiled until the colored components were removed. After oven drying at 105 °C/24 h, the SBC samples were ground to obtain the required sizes (<100 μm).The PA fiber waste was washed with a 1 g l−1 nonionic detergent solution at 80 °C for 20 min, and rinsed thoroughly with distilled water to remove any surface impurities before air drying.39
2.3. Synthesis of active carbon from SBC
For AC synthesis, 50 g of the prepared SBC powder was mixed with an equal weight (50 g) of H3PO4 (85%, E. Merck, Germany), to achieve a 1![[thin space (1/6-em)]](https://www.rsc.org/images/entities/char_2009.gif) :
:![[thin space (1/6-em)]](https://www.rsc.org/images/entities/char_2009.gif) 1 (H3PO4/LSB) w/w solid-to-liquid ratio. Then, 200 ml of TW was employed to liquefy the prepared blend, which was left uninterrupted at ambient temperature overnight. The permeated sample was poured into a refractory crucible to be activated at 550 °C/2 h in a programmable muffle furnace with a heating rate of 10 °C min−1.40 The produced AC samples were thoroughly washed with 0.1 M NaOH, and then by TW numerous times to remove any trapped H3PO4 residue until the supernatant pH become neutral. After oven drying at 100 °C overnight, the AC sample was ground in mortar and pestle to <3 mm and then tightly packed for the following deployment (Fig. 2).
1 (H3PO4/LSB) w/w solid-to-liquid ratio. Then, 200 ml of TW was employed to liquefy the prepared blend, which was left uninterrupted at ambient temperature overnight. The permeated sample was poured into a refractory crucible to be activated at 550 °C/2 h in a programmable muffle furnace with a heating rate of 10 °C min−1.40 The produced AC samples were thoroughly washed with 0.1 M NaOH, and then by TW numerous times to remove any trapped H3PO4 residue until the supernatant pH become neutral. After oven drying at 100 °C overnight, the AC sample was ground in mortar and pestle to <3 mm and then tightly packed for the following deployment (Fig. 2).
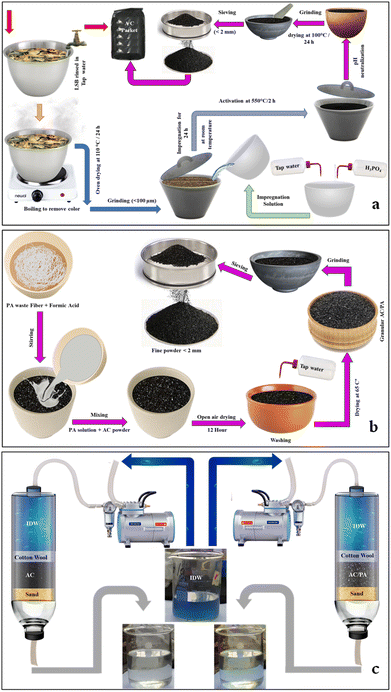 | ||
| Fig. 2 Illustration of the fabrication process of AC from SBC (a), and of the AC/PA composite from AC and PA (b). The treatment process of the IDW using both AC and AC/PA composite (c). | ||
2.4. Fabrication of the AC/PA composite
For the preparation of AC/PA, the prepared PA6-fiber waste was dissolved in formic acid (90%), with a fixed concentration (18% w/w), according to the protocol followed by.39 So, 1.8 g of PA was dissolved in 8.2 g of formic acid to maintain a previously reported ratio of 18%. This mixture was homogenized via a stirring process at ambient temperature until a homogeneous/viscous solution was obtained. Then, 16.2 g of the prepared AC was added to the previous mixture with continuous stirring also at room temperature, achieving a w/w impregnation ratio of 10![[thin space (1/6-em)]](https://www.rsc.org/images/entities/char_2009.gif) :
:![[thin space (1/6-em)]](https://www.rsc.org/images/entities/char_2009.gif) 90% (PA6
90% (PA6![[thin space (1/6-em)]](https://www.rsc.org/images/entities/char_2009.gif) :
:![[thin space (1/6-em)]](https://www.rsc.org/images/entities/char_2009.gif) AC). This PA6 ratio (10%) was selected to fulfill the minimal reduction ratio in the geometric parameters, especially surface area, and inherited porous structure. Such mixture was left in open air overnight to permit evaporation of the excess formic acid. After drying, the produced composite was washed thoroughly several times with TW until pH neutralization was achieved, and the product was oven-dried at 65 °C for 12 h. The produced AC/PA composite was re-ground using mortar and pestle to obtain fine grains (<3 mm). The collected powder was packed in an airtight container for further application. The fabrication process of the AC/PA composite is summarized in Fig. 2b.
AC). This PA6 ratio (10%) was selected to fulfill the minimal reduction ratio in the geometric parameters, especially surface area, and inherited porous structure. Such mixture was left in open air overnight to permit evaporation of the excess formic acid. After drying, the produced composite was washed thoroughly several times with TW until pH neutralization was achieved, and the product was oven-dried at 65 °C for 12 h. The produced AC/PA composite was re-ground using mortar and pestle to obtain fine grains (<3 mm). The collected powder was packed in an airtight container for further application. The fabrication process of the AC/PA composite is summarized in Fig. 2b.
2.5. Characterization of SBC, AC, and the AC/PA composite
The agricultural waste (SBC) and derivative products (AC & AC/PA composite) were characterized by XRD (APD-3720/Philips diffractometer with Cu Kα radiation/operated at 40 kV and 20 mA/scanning speed 5° per min/range of 2θ from 5° to 80°), scanning electron microscopy (SEM, JEOL/JSM-6700F/Japan/20–30 kV beam energy/11.10–12.20 mm as a working distance) supplied with energy-dispersive X-ray spectrometry (EDS), and FT-IR (FTIR-2000/Bruker spectrometer/reflection mode at 4 cm−1 resolution/scanning range from 400 to 4000 cm−1) techniques to determine their crystalline phases, morphological features, elemental composition, and the distinctive functional groups, respectively. The SBET (BET surface area), Vt (total pore volume), and Dp (average pore diameter) of SBC, AC and the AC/PA composite were determined after vacuum degassing at 100 °C for 2 h via Quantachrome Surface Area Analyzer (Nova 2000). The BJH (Barrett–Joyner–Halenda) equation41 was employed to estimate Dp and Vt, whereas SBET was calculated via BET (Brunauer–Emmet and Teller) equation.422.6. Column system experiments using industrial wastewater from Emessa Denim Ready Made Garments Factory
The prepared AC and its derivative AC/PA composite were tested on a column system using real industrial wastewater that was collected from Emessa Denim for Ready Made Garments Factory, Industrial Zone, Beni-Suef Governorate, Egypt. The most challenging contaminants that were traced in such industrial wastewater were BOD and COD, which reflect the dye concentration (Table 1). These contaminants were correlated with the bleaching process of jeans pants. However, the other traced contaminants were approximately present within acceptable limits (i.e., fragile in comparison with the dye concentration). So, this study focused only on the essential problem in Factory wastewater, which is industrial dye waste (IDW). In other words, the removal efficiency of both AC and AC/PA composite was evaluated and compared based on the IDW concentration in the effluent water only. The concentration of IDW before and after treatment process was analyzed using a UV-spectrophotometer (DR 6000, HACH LANGE, USA) in the visible region at 671 nm.43 In this consequence, the impacts of bed thickness, applied flow rate, and applied pH were investigated for both AC and AC/PA composite.| Fe (mg l−1) | 0.10 |
| Pb (mg l−1) | 0.15 |
| Cd (mg l−1) | 0.20 |
| Zn (mg l−1) | 0.25 |
| Cr (mg l−1) | 0.38 |
| NH3 (mg l−1) | 1–2 |
| BOD (mg l−1) | 850 |
| COD (mg l−1) | 1300 |
| TSS (mg l−1) | 200 |
| TDS (mg l−1) | 700 |
| pH | 7.50 |
| T (°C) | 25° |
3. Results and discussion
3.1. Characterization of SBC, AC and the AC/PA composite
The XRD of the precursor SBC in comparison with the derivatives AC and AC/PA composite is illustrated in Fig. 2. The broad diffraction background in the derivative ACs, which reflects the gained amorphicity after the precursor SBC, was preserved, but with less magnitude and slight shifting in 2θ values (from 20–30° instead of 20–25° in SBC).44 However, some signs of improved crystallinity were traced in the derivative AC through the emergence of some peaks at 2θ ≈ 17.6° & 23.5°. These latter peaks could be ascribed to the γ-phase carbon.45 Meanwhile, the strong diffraction peak at 2θ ≈ 25.01° & 26.85° in AC that was recorded as proto-peaks in the precursor SBC (2θ ≈ 24.5–26.7°)46 indicates the crystalline carbon.45 The (002) graphite reflection plane with d(002) ≈ 3.32 Å in the derivative AC was reflected by the strong peak at 2θ ≈ 26.85°. Such (002) reflection plane approximately vanished in the prepared AC/PA composite, signifying a low degree of graphitization. Therefore, the PA incorporation played a critical role in the reduction of the graphitization degree of AC (i.e., crystallinity slightly reduced). This is in accordance with the applied formic acid as a polymer dissolving agent during the polymerization process.47 Thus, the inception of PA into active carbon destroyed the lateral dimension (along the c-axis) of nanographene zones, while keeping the longitudinal dimension (along the a-axis) intact.48 This type of structural disordering has also been reported via halidation processes.48Additionally, the non-carbonaceous phases of the precursor SBC, which were assigned to the residual ash after the activation process in the form of cristobalite, were preserved in the derivatives (AC & AC/PA composite) as very minor peaks at 2θ ≈ 51.05° & 60.1° (Fig. 3). Similarly, the strong peaks in the pattern of the derivatives AC and AC/PA composite around 2θ ≈ 35.6° were correlated with silicon carbide.
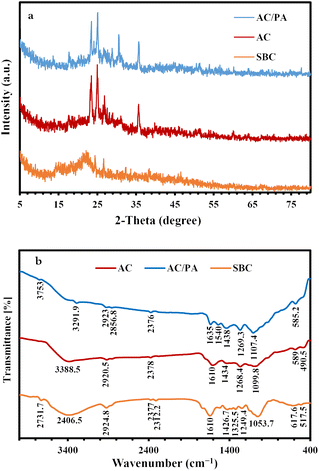 | ||
| Fig. 3 XRD patterns of the prepared AC and AC/PA composite in comparison with the precursor SBC (a). FT-IR spectra of the prepared AC and AC/PA composite in comparison with the precursor SBC (b). | ||
FT-IR spectra of the pristine SBC compared to those of the derivative AC and AC/PA composite are given in Fig. 3. The SBC prevailing functional groups were reported at frequencies of 3406.5, 2924.8, 1634.2, and 1053.7 cm−1. The broad absorbance band at 3406.5 cm−1 in the SBC spectra might be ascribed to the stretching vibrational mode of either O–H or N–H groups.49 In the derivative AC and AC/PA, the peak amplitude of the N–H and/or O–H groups was gradually diminished with progressive shifting to lower frequencies after the thermo-chemical activation and polymerization processes. The less intense band at 2924.8 cm−1 of SBC, which was ascribed to the stretching mode of the C–H (alkenes) group of lignin polysaccharides (i.e., hemicellulose and cellulose),50,51 also was noticeably decreased in intensity for AC and the AC/PA composite. Such fading indicates the disintegration of the groups expressing the oxygenated hydrocarbons.44 The feeble band around 2300 cm−1 of the precursor SBC, which was assigned to CO2 molecules in the stretching modes,52,53 decreased in intensity in the derivatives AC and AC/PA. Similarly, the C![[double bond, length as m-dash]](https://www.rsc.org/images/entities/char_e001.gif) C aromatic bond54 and/or the asymmetric stretching modes of the (–COO−) group50 around 1634.2 cm−1 in SBC also were reduced in intensity in both AC and AC/PA, with some shifting to a higher frequency in the latter. Conversely, the intensity in the C
C aromatic bond54 and/or the asymmetric stretching modes of the (–COO−) group50 around 1634.2 cm−1 in SBC also were reduced in intensity in both AC and AC/PA, with some shifting to a higher frequency in the latter. Conversely, the intensity in the C![[double bond, length as m-dash]](https://www.rsc.org/images/entities/char_e001.gif) C group stretching mode55 that emerged as a shoulder band at 1522.8 cm−1 in the precursor SBC spectra was amplified in the derivatives AC and AC/PA, and shifted up to higher frequencies (≈1540 cm−1).52 This reflects a remarkable improvement in the aromatic characteristics of the prepared AC via the aliphatic component's transformation in the pristine SBC.56 Moreover, the noticeable increase in intensity of the weak bands at 1434 and 1269 cm−1 (bending mode of the CH2 group and amide III (γ), respectively) in the derivative composite compared to SBC, indicates the success of activation and polyamide incorporation in the AC structure. The 1053.7 cm−1 intensified band in SBC, which was correlated with C–O stretching,50 was shifted to higher frequencies in the derivatives AC & AC/PA (≈1099–1107 cm−1, respectively), indicating the coupling between the stretching mode of the O–C group within the aromatic P–O–C linkages and hydrogen-bonded P
C group stretching mode55 that emerged as a shoulder band at 1522.8 cm−1 in the precursor SBC spectra was amplified in the derivatives AC and AC/PA, and shifted up to higher frequencies (≈1540 cm−1).52 This reflects a remarkable improvement in the aromatic characteristics of the prepared AC via the aliphatic component's transformation in the pristine SBC.56 Moreover, the noticeable increase in intensity of the weak bands at 1434 and 1269 cm−1 (bending mode of the CH2 group and amide III (γ), respectively) in the derivative composite compared to SBC, indicates the success of activation and polyamide incorporation in the AC structure. The 1053.7 cm−1 intensified band in SBC, which was correlated with C–O stretching,50 was shifted to higher frequencies in the derivatives AC & AC/PA (≈1099–1107 cm−1, respectively), indicating the coupling between the stretching mode of the O–C group within the aromatic P–O–C linkages and hydrogen-bonded P![[double bond, length as m-dash]](https://www.rsc.org/images/entities/char_e001.gif) OOH groups from polyphosphates/and or phosphates.57,58 Moreover, the remarkable occurrence of the bands around 589 cm−1 in AC confirms the existence of out-of-plane deformation for C–H from benzene and alkene derivatives with various grades of substitution.59,60 Similarly, the incorporation of polyamide contributed to an increase in the intensity of the 585.2 cm−1 band, signifying the presence of amide VI (α) in the prepared composite.
OOH groups from polyphosphates/and or phosphates.57,58 Moreover, the remarkable occurrence of the bands around 589 cm−1 in AC confirms the existence of out-of-plane deformation for C–H from benzene and alkene derivatives with various grades of substitution.59,60 Similarly, the incorporation of polyamide contributed to an increase in the intensity of the 585.2 cm−1 band, signifying the presence of amide VI (α) in the prepared composite.
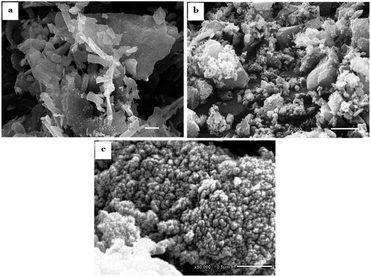
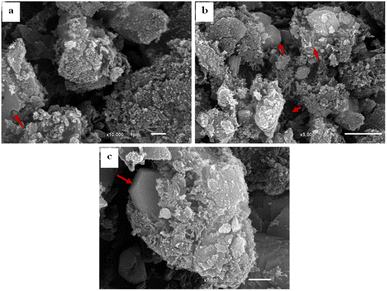
The SEM images of SBC compared to the derivatives AC & AC/PA composites are displayed in Fig. 4. The SBC revealed a rugged surface with spheroidal crenulations (Fig. 4a). The surface heterogeneity was amplified after thermos-chemical activation in the produced AC, as well as the crowding with the spheroidal crenulations (Fig. 4b and c). Such heterogeneity could be accounted for the evaporation of H3PO4 activating agent during the carbonization process.56,58 The presence of some approximately euhedral to sub-euhedral prismatic crystals reflects the attained degree of crystallinity after the carbonization process of the pristine SBC in agreement with XRD results. However, the presence of spherical-like nanoparticles, in juxtaposition with the well-developed crystals, indicates that some traces of the preserved amorphous feature in the AC was maintained. Similarly, the prepared AC/PA composite has a rough/agglomerated surface including spherical-like nanoparticles that generally agglomerate together to generate a porous structure full of grooves and cavities (Fig. 5a–c). Such rough and heterogeneous surfaces with a porous nature were inherited from the precursor AC. Furthermore, the polymerization process not only contributed to agglomeration in the prepared composite, but also maintained some signs of graphitization that reflect the degree of crystallinity of such composite, matching with the XRD data.
Table 2 illustrates the elemental composition of the three materials analyzed by EDS, including the AC/PA composite and each of its components, AC1:1 and PA. Carbon (C) and oxygen (O) represent the highest percentages in the three materials with a special preference for the former. Meanwhile, hydrogen (H) and nitrogen (N) have the lowest contribution to the composition of all analyzed materials.
| Element (%) | AC1:1 | PA | AC/PA |
|---|---|---|---|
| C | 75.80 | 74.30 | 75.53 |
| O | 21.20 | 11.80 | 20.70 |
| N | 0.24 | 8.50 | 1.07 |
| H | 2.76 | 5.40 | 2.70 |
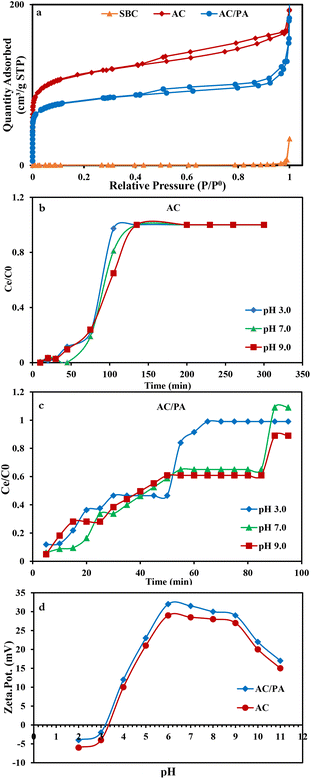
The N2 adsorption/desorption isotherms of the parental SBC and the derivatives (AC & AC/PA) are compiled in Fig. 6a. SBC is of type III isotherm consistent with IUPAC classification, whereas the isotherm of hybrid nature (i.e., II and IV) can be designated for the derivatives, AC and the AC/PA composite.56 This indicates the macroporous nature of the precursor and macro-porous/mesoporous/micro-porous nature of both derivatives. At low relative pressure (P/P0), the isotherms of the derivatives display the type II nature with remarkable N2 adsorption through the available micropores.56 Conversely, their isotherms follow the type IV isotherm with H4 hysteresis loops, indicating the monolayer–multilayer adsorption.56 However, for all of the samples under consideration, the inability to attain the equilibrium status of the N2 adsorption confirms the wide scale of the pore diameters, especially for the derivatives. In the same consequence, the geometric parameters of the regarded materials (Table 3) revealed that the carbonization through the thermo-chemical activation process resulted in an observable improvement in the SBET and Vt of the prepared AC compared to those of the precursor SBC (1.5 m2 g−1 & 0.0107 cm3 g−1, respectively). This signifies the impact of H3PO4 in enhancing the porosity of AC through the demolition of the lignin structure/cellulose of SBC.40 Additionally, with polyamide incorporation, a slight decline in N2 uptake was observed, signaling a slight reduction in the porosity of the prepared AC/PA in comparison with AC. Furthermore, the hysteresis loops were tightened due to the polymerization process and the geometric parameters of the investigated AC/PA (Table 3) witnessed a slim drop in Vt from 0.26 in AC to 0.02 cm3 g−1 in the prepared composite. This suggests the role of the polyamide in diminishing the porosity of the prepared AC/PA through the filling of the AC pores.48 Concerning Dp, the impact of polyamide incorporation also was reflected in a slight reduction of Dp to 2.414 nm instead of 2.48 (Table 3). Furthermore, the SBET was slightly reduced (from ≈416 to 400 m2 g−1).
| Sample | Surface area (m2 g−1) | Total pore volume (cm3 g−1) | Average pore diameter (nm) |
|---|---|---|---|
| (SBET) | Vt | Dp | |
| SBC | 1.50 | 0.0107 | 28.748 |
| AC(1:1) | 416.77 | 0.2584 | 2.4803 |
| AC/PA | 400.32 | 0.2013 | 2.4140 |
3.2. Column system experiments using industrial wastewater from Emessa Denim Ready Made Garments Factory using the prepared AC and AC/PA composite
3.3. Adsorption modeling for fixed bed column studies
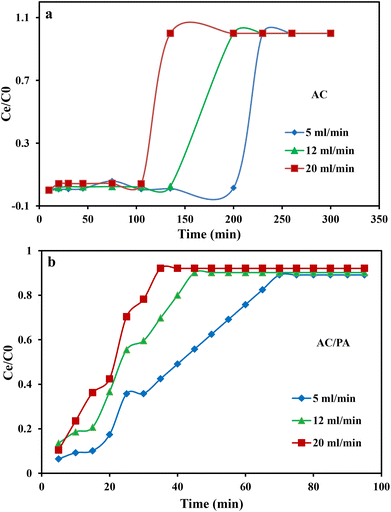
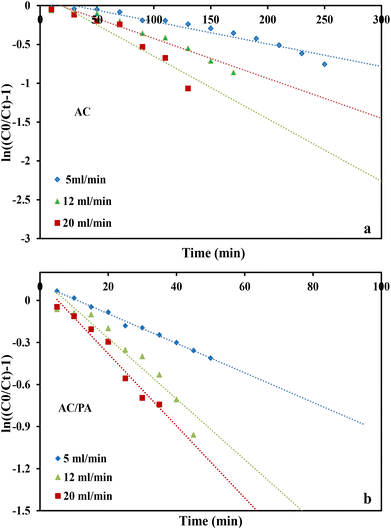
where kTh (ml min−1 mg−1) is the Thomas model constant, qTh (mg g−1) is the predicted adsorption capacity of IDW by the addressed adsorbents that was calculated via the Thomas model, and m is the utilized mass of AC and AC/PA adsorbents (g) in the column system, separately. Q is the influent flow rate (ml min−1), C0 and Ct are the IDW concentration (mg l−1) of the influent and effluent, respectively, and t is the time in (min). The values of kTh and qTh (Table 4) were obtained from the plot of ln(C0/Ct − 1) versus t (min) at various flow rates (5, 12, and 20 ml min−1), while keeping the other experimental parameters constant (bed height, IDW concentration and initial pH at 2.5 cm, 490 mg l−1 and 7.0, respectively), as shown in Fig. 9a and b. Based on the results of the linear plot of ln(C0/Ct − 1) versus t (min) at the different applied flow rates (Fig. 9a), the high correlation (R2 > 0.94) of the experimental data revealed that the adsorption process of IDW onto AC and AC/PA could be well-interpreted by the Thomas model (Table 4). Furthermore, the kTh values revealed contradictory behavior for both adsorbents. The kTh values for the AC/PA composite revealed a progressive increase upon increasing the applied flow rate from 5 to 20 ml min−1. Conversely, the kTh values were decreased with increasing applied flow rate in the case of AC. However, the kTh values of the AC/PA composite are still higher than those of their counterparts of AC at the same applied flow rates. Furthermore, the calculated adsorption capacities (qTh) revealed reversible trends at an enlarged flow rate for both adsorbents. These results might be attributed to the enhancement of mass transfer driving forces with the decrease in inflow rate in both cases.67 On the contrary, the interaction time between IDW and AC & AC/PA gradually decreased with the increase of inflow rate, eventually resulting in the decrease of the sorption amount. However, the recorded qTh values using AC are still higher than those of AC/PA at the same applied flow rate. Moreover, the small relative error between the calculated and experimental (average value for the 3 applied flow rates) uptake capacities for both adsorbents suggests the suitability of the Thomas model in predicting the dynamic adsorption process of IDW onto AC and the AC/PA composite (Table 4). These results fully proved the chemisorption process of IDW by both AC and AC/PA adsorbents.
| Flow rate (ml min−1) | qexp | Model | ||||||
|---|---|---|---|---|---|---|---|---|
| Thomson | Yoon-Nelson | |||||||
| kTh | qTh | R2 | kYN | τ | R2 | |||
| AC | 5 | 439.20 (mg l−1) | 3.1954 × 10⁻⁶ | 450.7 | 0.976 | 0.005 | 92.87 | 0.876 |
| 12 | 2.1451 × 10⁻⁶ | 401.2 | 0.976 | 0.008 | 31.84 | 0.729 | ||
| 20 | 1.3293 × 10⁻⁶ | 366.7 | 0.948 | 0.016 | 21.04 | 0.921 | ||
| AC/PA | 5 | 117.30 (mg l−1) | 1.14548 × 10⁻⁵ | 154.9 | 0.997 | 0.136 | 10.92 | 0.771 |
| 12 | 1.9314 × 10⁻⁵ | 105.0 | 0.961 | 0.179 | 5.61 | 0.845 | ||
| 20 | 2.8633 × 10⁻⁵ | 99.68 | 0.981 | 0.208 | 4.01 | 0.890 | ||
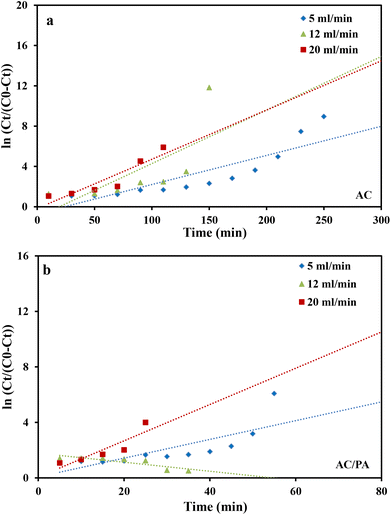
where kYN (min−1) is the Yoon and Nelson rate constant and τ (min) is the half-breakthrough time. The kYN and τ terms were calculated using the intercept and linear drawing slope of ln(Ct/C0 − Ct) versus (t). From the linear plot of ln(Ct/C0 − Ct) versus (t) at the different applied flow rates (Fig. 10a and b), the recorded determination coefficients R2 (from 0.73 to 0.92 & 0.77 to 0.89 for AC and AC/PA, respectively) indicate that the adsorption process of IDW onto AC and AC/PA could not be interpreted well using the Yoon and Nelson model compared to the Thomson one (Table 4).
4. Conclusions
Grounding upon the above-mentioned discussions, the following deduction can be formulated:• SBC waste that annually piles up after the harvesting of beet crop was converted into sustainable AC with high market value by thermo-chemical activating procedure using a fixed weight ratio of the H3PO4 acid![[thin space (1/6-em)]](https://www.rsc.org/images/entities/char_2009.gif) :
:![[thin space (1/6-em)]](https://www.rsc.org/images/entities/char_2009.gif) SBC (1
SBC (1![[thin space (1/6-em)]](https://www.rsc.org/images/entities/char_2009.gif) :
:![[thin space (1/6-em)]](https://www.rsc.org/images/entities/char_2009.gif) 1) and 550 °C for 2 h.
1) and 550 °C for 2 h.
• The polymerization process of the fabricated AC (90%) with polyamide (PA, 10%), as synthetic textile waste, using an adequate ratio of the specified dissolving agent and the employed polymer (formic acid/PA = 82%/18% w/w ratio), resulted in the production of the AC/PA nanocomposite.
• The remarkable surface chemistry and geometric parameters of both AC and AC/PA nanocomposite (e.g., SBET = 416.77 and 400.32 mg g−1, respectively) made these materials a suitable and effective choice for IDW remediation from the industrial wastewater effluent of the Emessa Denim Ready Made Garments Factory.
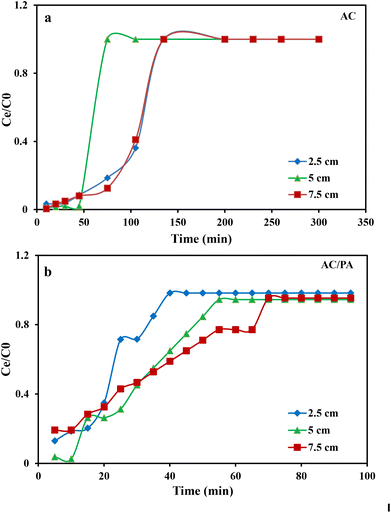
• The sorption of IDW by regarded adsorbents was a pH-flow rate and bed thickness driven procedure; the maximum removal percentage was accomplished at pH 7.0 & 9.0, matching with the zeta potential findings. Moreover, the equilibrium was reached at 60 and 15 min, respectively.
• The reduction of the retention time contributed to the improper execution of the intra-particle diffusion phenomena between IDW molecules and binding site on the surface of the regarded adsorbents, reducing the required time to attain a specific breakthrough, especially at high flow rates and low bed thicknesses as a consequence of the limited diffusivity of the IDW ions into the binding sites of the adsorbents.
• The shorter breakthrough time of AC/PA than AC may be attributed to the higher rate of mass transfer and the reduction in the available binding sites on the surface of the composite as a result of the polymerization process.
• Both experimental and calculated adsorption capacities (qTh) revealed reversible trends at enlarged flow rates for both AC and AC/PA with some superiority of the former over the latter. These results might be attributed to the enhancement of mass transfer driving forces with the decrease of inflow rate in both cases.
• The small relative error between the calculated and experimental uptake capacities for both adsorbents suggests the suitability of the Thomas model in predicting the dynamic adsorption process of IDW onto AC and the AC/PA composite.
• IDW adsorption by both AC and AC/PA adsorbents was a chemisorption process.
• Finally, AC and AC/PA can be classified as excellent/eco-friendly adsorbents for dyes from industrial wastewater with some advantages for the former.
Conflicts of interest
The authors declare no conflict of interest.Acknowledgements
The authors extend their appreciation to the Deanship of Scientific Research at King Khalid University for funding this work through the Large Group Research Project under grant number RGP2/167/44.References
- K. G. Akpomie and J. Conradie, Ecotoxicol. Environ. Saf., 2020, 201, 110825 CrossRef CAS PubMed.
- C. R. Holkar, A. J. Jadhav, D. V. Pinjari, N. M. Mahamuni and A. B. Pandit, J. Environ. Manage., 2016, 182, 351–366 CrossRef CAS PubMed.
- D. Politi and D. Sidiras, Procedia Eng., 2012, 42, 1969–1982 CrossRef.
- V. Chandanshive, S. Kadam, N. Rane, B.-H. Jeon, J. Jadhav and S. Govindwar, Chemosphere, 2020, 252, 126513 CrossRef CAS PubMed.
- S. Parmar, S. Daki, S. Bhattacharya and A. Shrivastav, in Development in Wastewater Treatment Research and Processes, ed. M. P. Shah, S. Rodriguez-Couto and R. T. Kapoor, Elsevier, 2022, pp. 175–193, DOI:10.1016/B978-0-323-85657-7.00001-8.
- T. A. Kurniawan, G. Y. S. Chan, W.-H. Lo and S. Babel, Chem. Eng. J., 2006, 118, 83–98 CrossRef CAS.
- A. H. El Maghrabi, M. M. El-Rabiee, B. S. Metwally, M. A. Masoud, M. H. Abdelaziz, P. Petrounias, N. Koukouzas and A. M. Zayed, Sustainability, 2023, 15, 7060 CrossRef CAS.
- A. I. Tagyan, M. M. Yasser, A. M. Mousa, D. H. M. Alkhalifah, W. N. Hozzein and M. A. Marzouk, Microorganisms, 2023, 11, 1135 CrossRef CAS PubMed.
- H. Weng, Y. Yang, C. Zhang, M. Cheng, W. Wang, B. Song, H. Luo, D. Qin, C. Huang, F. Qin and K. Li, Chem. Eng. J., 2023, 453, 139812 CrossRef CAS.
- A. I. Tagyan, M. M. Yasser, A. M. Mousa, D. H. M. Alkhalifah, W. N. Hozzein and M. A. Marzouk, J. Fungi, 2023, 9, 382 CrossRef CAS PubMed.
- A. Bhatnagar, M. Sillanpää and A. Witek-Krowiak, Chem. Eng. J., 2015, 270, 244–271 CrossRef CAS.
- W.-Q. Guo, S.-S. Yang, W.-S. Xiang, X.-J. Wang and N.-Q. Ren, Biotechnol. Adv., 2013, 31, 1386–1396 CrossRef CAS PubMed.
- G. Crini, E. Lichtfouse and L. Wilson, Green adsorbents for pollutant removal: fundamentals and design, Springer, 2018 Search PubMed.
- B. Koul, D. Yadav, S. Singh, M. Kumar and M. Song, Water, 2022, 14, 3542 CrossRef CAS.
- X. Zhang, P. Ye and Y. Wu, J. Environ. Manage., 2022, 321, 115938 CrossRef CAS PubMed.
- R. K. Gautam, A. Mudhoo, G. Lofrano and M. C. Chattopadhyaya, J. Environ. Chem. Eng., 2014, 2, 239–259 CrossRef CAS.
- J. Song, W. Zou, Y. Bian, F. Su and R. Han, Desalination, 2011, 265, 119–125 CrossRef CAS.
- Y. S. Al-Degs, M. A. M. Khraisheh, S. J. Allen and M. N. Ahmad, J. Hazard. Mater., 2009, 165, 944–949 CrossRef CAS PubMed.
- F. Qin, C. Zhang, G. Zeng, D. Huang, X. Tan and A. Duan, Renewable Sustainable Energy Rev., 2022, 157, 112056 CrossRef CAS.
- D. Mohan, V. K. Gupta, S. K. Srivastava and S. Chander, Colloids Surf., A, 2001, 177, 169–181 CrossRef CAS.
- J. Romanos, M. Beckner, T. Rash, L. Firlej, B. Kuchta, P. Yu, G. Suppes, C. Wexler and P. Pfeifer, Nanotechnology, 2012, 23, 015401 CrossRef CAS PubMed.
- A. M. Zayed, B. S. Metwally, M. A. Masoud, M. F. Mubarak, H. Shendy, P. Petrounias and M. S. M. Abdel Wahed, Arabian J. Chem., 2023, 16, 104900 CrossRef CAS.
- P. V. Thitame and S. R. Shukla, Int. J. Environ. Sci. Technol., 2016, 13, 561–570 CrossRef CAS.
- P. Kaur, A. P. Singh, A. K. Prince and J. P. Kushwaha, Int. J. Environ. Sci. Technol., 2015, 12, 3755–3766 CrossRef CAS.
- M. F. Alkhatib, A. A. Mamun and I. Akbar, Int. J. Environ. Sci. Technol., 2015, 12, 1295–1302 CrossRef CAS.
- M. A. Masoud, W. A. Kansouh, M. G. Shahien, K. Sakr, A. M. Rashad and A. M. Zayed, Prog. Nucl. Energy, 2020, 120, 103220 CrossRef CAS.
- A. M. Zayed, M. A. Masoud, A. M. Rashad, A. M. El-Khayatt, K. Sakr, W. A. Kansouh and M. G. Shahien, Constr. Build. Mater., 2020, 260, 120473 CrossRef CAS.
- M. A. Masoud, A. M. El-Khayatt, W. A. Kansouh, K. Sakr, M. G. Shahien and A. M. Zayed, Constr. Build. Mater., 2020, 263, 120141 CrossRef CAS.
- A. M. Zayed, M. A. Masoud, M. G. Shahien, H. S. Gökçe, K. Sakr, W. A. Kansouh and A. M. El-Khayatt, Constr. Build. Mater., 2021, 272, 121641 CrossRef CAS.
- M. A. Masoud, A. M. Rashad, K. Sakr, M. G. Shahien and A. M. Zayed, Mater. Struct., 2020, 53, 87 CrossRef CAS.
- M. A. Masoud, A. M. El-Khayatt, M. G. Shahien, B. R. Bakhit, I. I. Suliman and A. M. Zayed, Toxics, 2022, 10, 697 CrossRef CAS PubMed.
- M. A. Masoud, A. M. El-Khayatt, K. A. Mahmoud, A. M. Rashad, M. G. Shahien, B. R. Bakhit and A. M. Zayed, Cem. Concr. Compos., 2023, 141, 105120 CrossRef CAS.
- N. T. Abdel-Ghani, G. A. El-Chaghaby and E. M. Zahran, Int. J. Environ. Sci. Technol., 2015, 12, 211–222 CrossRef CAS.
- A. Y. Dursun, O. Tepe, G. Uslu, G. Dursun and Y. Saatci, Environ. Sci. Pollut. Res., 2013, 20, 2472–2483 CrossRef CAS PubMed.
- H. Elzayat, Acta sci. Agric., 2022, 17–26, DOI:10.31080/ASAG.2022.06.1090.
- P. Ninfali and D. Angelino, Fitoterapia, 2013, 89, 188–199 CrossRef CAS PubMed.
- J. Zhao, L. Yu, F. Zhou, H. Ma, K. Yang and G. Wu, RSC Adv., 2021, 11, 8025–8032 RSC.
- R. P. Singh, S. Mishra and A. P. Das, Chemosphere, 2020, 257, 127199 CrossRef CAS PubMed.
- B. S. Metwally, A. A. El-Sayed, E. K. Radwan, A. S. Hamouda, M. El-Sheikh and M. Salama, Egypt. J. Chem., 2018, 61, 867–882 Search PubMed.
- F. J. Tuli, A. Hossain, A. K. M. F. Kibria, A. R. M. Tareq, S. M. M. A. Mamun and A. K. M. A. Ullah, Environ. Nanotechnol., Monit. Manage., 2020, 14, 100354 Search PubMed.
- E. P. Barrett, L. G. Joyner and P. P. Halenda, J. Am. Chem. Soc., 1951, 73, 373–380 CrossRef CAS.
- S. Brunauer, P. H. Emmett and E. Teller, J. Am. Chem. Soc., 1938, 60, 309–319 CrossRef CAS.
- S. Charola, R. Yadav, P. Das and S. Maiti, Sustainable Environ. Res., 2018, 28, 298–308 CrossRef CAS.
- M. S. Shamsuddin, N. R. N. Yusoff and M. A. Sulaiman, Procedia Chem., 2016, 19, 558–565 CrossRef CAS.
- C. E. Burgess-Clifford, D. L. Narayanan, D. T. Van Essendelft, P. Jain, A. Sakti and A. D. Lueking, Fuel Process. Technol., 2009, 90, 1515–1523 CrossRef CAS.
- A. M. Zayed, M. Fathy, M. Sillanpää and M. S. M. Abdel Wahed, SN Appl. Sci., 2020, 2, 740 CrossRef CAS.
- X. P. Zhang, C. Zhang, P. Tan, X. Li, Q.-Y. Fang and G. Chen, Fuel Process. Technol., 2018, 172, 200–208 CrossRef.
- P. Barpanda, G. Fanchini and G. G. Amatucci, Carbon, 2011, 49, 2538–2548 CrossRef CAS.
- H. S. Altundogan, N. Bahar, B. Mujde and F. Tumen, J. Hazard. Mater., 2007, 144, 255–264 CrossRef CAS PubMed.
- M. R. Malekbala, S. Hosseini, S. Kazemi Yazdi, S. Masoudi Soltani and M. R. Malekbala, Chem. Eng. Res. Des., 2012, 90, 704–712 CrossRef CAS.
- F. Ghorbani, S. Kamari, S. Zamani, S. Akbari and M. Salehi, Surf. Interfaces, 2020, 18, 100444 CrossRef CAS.
- V. Ţucureanu, A. Matei and A. M. Avram, Crit. Rev. Anal. Chem., 2016, 46, 502–520 CrossRef PubMed.
- A. Q. Selim, E. A. Mohamed, M. K. Seliem and A. M. Zayed, J. Alloys Compd., 2018, 762, 653–667 CrossRef CAS.
- Y. Önal, C. Akmil-Başar, Ç. Sarıcı-Özdemir and S. Erdoğan, J. Hazard. Mater., 2007, 142, 138–143 CrossRef PubMed.
- S. M. Anisuzzaman, C. G. Joseph, W. M. A. B. W. Daud, D. Krishnaiah and H. S. Yee, Int. J. Ind. Chem., 2015, 6, 9–21 CrossRef CAS.
- A. Kumar and H. M. Jena, Results Phys., 2016, 6, 651–658 CrossRef.
- J. Xu, L. Chen, H. Qu, Y. Jiao, J. Xie and G. Xing, Appl. Surf. Sci., 2014, 320, 674–680 CrossRef CAS.
- Q. Han, J. Wang, B. A. Goodman, J. Xie and Z. Liu, Powder Technol., 2020, 366, 239–248 CrossRef CAS.
- S. Suganya and P. Senthil Kumar, J. Ind. Eng. Chem., 2018, 60, 418–430 CrossRef.
- R. A. Canales-Flores and F. Prieto-García, Diamond Relat. Mater., 2020, 109, 108027 CrossRef CAS.
- S. Banerjee and M. C. Chattopadhyaya, Arabian J. Chem., 2017, 10, S1629–S1638 CrossRef CAS.
- E. Rápó and S. Tonk, Molecules, 2021, 26, 5419 CrossRef PubMed.
- P. Luo, Y. Zhao, B. Zhang, J. Liu, Y. Yang and J. Liu, Water Res., 2010, 44, 1489–1497 CrossRef CAS PubMed.
- Y. K. Tovbin, The Molecular Theory of Adsorption in Porous Solids, CRC Press, 2017 Search PubMed.
- S. Brandani and E. Mangano, Adsor, 2021, 27, 319–351 CrossRef CAS.
- S. Kim, S.-N. Nam, A. Jang, M. Jang, C. M. Park, A. Son, N. Her, J. Heo and Y. Yoon, Chemosphere, 2022, 286, 131916 CrossRef CAS PubMed.
- S. M. Alardhi, T. M. Albayati and J. M. Alrubaye, Heliyon, 2020, 6, e03253 CrossRef PubMed.
- S. Baral, G. Trapence, F. Motimedi, E. Umar, S. Iipinge, F. Dausab and C. Beyrer, PLoS One, 2009, 4, e4997 CrossRef PubMed.
- H. Patel, Sci. Rep., 2020, 10, 16895 CrossRef CAS PubMed.
- A. P. Lim and A. Z. Aris, Biochem. Eng. J., 2014, 87, 50–61 CrossRef CAS.
- Y. H. Yoon and J. H. Nelson, Am. Ind. Hyg. Assoc. J., 1984, 45, 509–516 CrossRef CAS PubMed.
- K. K. Hummadi, S. Luo and S. He, Chemosphere, 2022, 287, 131907 CrossRef CAS PubMed.
| This journal is © The Royal Society of Chemistry 2023 |

