 Open Access Article
Improving electrochemical performance of hybrid electrode materials by a composite of nanocellulose, reduced oxide graphene and polyaniline
Hang T. T. Le,
Nguyen Thanh Liem,
Nguyen Chau Giang,
Phan Huy Hoang and
Nguyen Thi Minh Phuong*
School of Chemical Engineering, Hanoi University of Science and Technology, 1 Dai Co Viet, Hai Ba Trung, Hanoi, Vietnam. E-mail: phuong.nguyenthiminh@hust.edu.vn
First published on 25th July 2023
Abstract
Novel ternary composites of polyaniline (PANI), reduced graphene oxide (RGO), and cellulose nanofibers (CNFs) are prepared by a chemical method for hybrid supercapacitors. CNFs were extracted from sugarcane bagasse waste in sugar production, by physicochemical processes. The composites were investigated as electrode-active materials for hybrid supercapacitors. The obtained results revealed that the presence of RGO and CNFs in the composites led to enhanced electrochemical performances, such as capacitance, rate capability, and long-term cyclability of the composite. The optimal composite of CNFs/RGO/PANI with a weight ratio of 4/16/80 can deliver the highest specific capacitance at 566.2 F g−1 under an applied current of 1 A g−1. After 1000 cycles of repetitive charge and discharge, the optimal composite retains 85.4% of its initial capacitance, whereas the PANI electrode obtained only 36.7% under the same conditions. Moreover, the supercapacitive performance is also strongly dependent on the component of the ternary composites. Overall, the composite is a promising material for hybrid supercapacitors; and the CNF component is a renewable material and a product of waste materials.
1. Introduction
Due to the increasing energy demand, diverse energy storage and conversion devices have been developed.1–3 Among them, hybrid supercapacitors have gained great attention because of their superior properties, such as large power density, long cycle life, and high reliability. As is well-known, supercapacitors can be classified into three types based on their charge storage mechanisms: (i) electric double layer capacitors (EDLCs), which store charge electrostatically, (ii) pseudocapacitors (PDs), which store charge electrochemically, and (iii) hybrid supercapacitors (HSCs), which store charge both electrostatically and electrochemically.4 With a combination of the properties of EDLCs and PDs, HSCs possess some advantages such as short charge–discharge times, high power density, long cycle life, high coulombic efficiency, and so on.Currently, various electrode active materials have been investigated and developed for supercapacitor applications. For EDLCs, because electrode materials often require high porosity, high surface area, and high electron conductivity, much research effort has been focused on developing carbonaceous materials, for example, aerogel carbon,5 carbon nanotube (CNT),6,7 graphene,8 reduced graphene oxide,7 graphite.9 Regarding PDs, due to their charge storage mechanism relying on three processes, including underpotential deposition, redox pseudocapacitance, and intercalation pseudocapacitance; the electrode active materials are novel metals,10,11 metal transition oxides,12,13 conducting polymers.13,14 However, the EDLCs and PDs suffer their own disadvantages, such as low specific capacitance (as for EDLCs) and low cycle life (as for PDs). Thus, developing composites with different ingredients functioning as electrode-active materials for EDLCs and PDs has been proved to be an effective strategy.6,13,15
In recent years, conducting polymers-cellulose composites with nanostructure has demonstrated huge potential applications in different fields such as corrosion protection, batteries, sensors, and electrical devices.16–18 Among conducting polymers under investigation, polyaniline (PANI) is often regarded as a promising electrode active material for PDs,19,20 thanks to its abundant advantages involving facile synthesis, controllable electrical conductivity, and good environmental stability. Whilst cellulose with cheap cost, biodegradability, biocompatibility, hydrophilicity, and good mechanical properties is a biopolymer that originated in nature. Especially, if being fabricated on the nanoscale, cellulose has a nanosized structure, namely, nanocellulose (NC), and demonstrates unique and distinctive properties, viz. high surface area, high Young's modulus,21 the capacity for broad chemical modification, and the ability to form versatile semicrystalline fiber morphologies and so on. This makes it a good choice for structure reinforcement when high strength and stability are required. Like other conductive polymers, for instance polypyrrole, polythiophene, PANI possesses low solubility and poor mechanical stability and are not flexible and bendable. In that case, CNFs with its flexible properties can be combined with this conductive material to form a new nanocomposite to increase the synergistic advantages of both components. Hence, the unique properties of CNFs could be applied to the development of supercapacitors and batteries.22 To date, research efforts have been dedicated to the functionality of cellulose with PANI for supercapacitors.16,23–27 For example, Li and a coworker prepared PANI/cellulose/polyacrylamide composites as electrode active material for supercapacitors. The fabricated supercapacitor showed excellent electrochemical performances with a large areal capacitance of 835.0 mF cm−2, and 96% capacitance retention after 5000 cycles.28 Zheng et al. developed the PANI/CNF/GNP composites with the highest specific capacitance of 421.5 F g−1 at a current density of 1 A g−1 and 78.3% retention of the initial capacitance after 1000 cycles of charge and discharge.24 In general, the ternary composites often reveal the remarkably supercapacitive performance because of integration of the advantages of their ingredients.
Regarding NC, NC can be extracted from agricultural byproducts, plants, and wood. Among them, the NC extraction from byproducts often offers higher economic efficiency. Currently, there are various methods for nanocellulose production.29 The used methods mainly depend on the plant sources of cellulose. The four biggest problems in nanocellulose processing are yield, complexity and stability of the nanocellulose processing technique, and the economic efficiency of the extraction process. Therefore, this study deals with the technique of nanocellulose production from a very common raw material, sugarcane bagasse, which is possibly collected in industry, and the sulfate pulp cooking method that is widely applied in the pulp processing industry and paper. The cellulose powder obtained from the sugarcane bagasse was then bleached by hydroperoxide and mechanically ground by a planetary ball mill to break down the cellulose into CNFs. The three-stage production process in this study offer advantages such as stability, easiness, and high yield. Integration of sulfate cooking, total chlorine-free bleaching, and planetary ball milling is considered as an energy-saving, low-stepping method that is close to commercial NC production methods, which enables the energy-efficient production of CNFs.30,31 In addition, we recognize that for electrode materials, good electronic and ionic conductivities are required. Meanwhile, both PANI and CNFs show poor electronic conductivity. An ingredient with excellent electronic conductivity should be included into the composites of PANI and CNFs. Thus, in this work, we propose using reduced graphene oxide (RGO) as a conducting agent, and an electrode active material for HSCs as well. Herein, various ternary composites of PANI, RGO, and CNFs with different composition were fabricated via a facile and reliable route. RGO was synthesized by the modified Humer method. CNFs were extracted from sugarcane bagasse via a combined chemical and mechanical grinding treatment. The process of extracting fibrous NC through sulfate treatment and mechanical grinding is a highly effective procedure for isolating CNFs from biomass. PANI was synthesized by oxidative polymerization of aniline. The resultant ternary composites demonstrated enhanced electrochemical performance in comparison with pure PANI, in the case of the absence of two RGO and CNFs ingredients. The optimal composite could supply a considerably high specific capacitance of 566.2 F g−1 at a charge–discharge current of 1 A g−1 with enhanced cycling performance after 1000 cycles. This is due to mechanical reinforcement of the composite with RGO and CNFs as effectively supporting scaffolds.
2. Experimental
2.1. Chemicals and materials
Sugarcane bagasse which was harvested in November 2020 from the North of Vietnam was used for this study. Aniline (C6H5NH2, ≥99.5%), ammonium persulfate ((NH4)2S2O8, 98%), sodium sulfide (Na2S·9H2O, ≥98%), sodium hydroxide (≥97.0%), graphite powder (grain size <20 μm), sulfuric acid (H2SO4, 95–98%), hydrochloric acid (HCl, 37%), potassium permanganate (KMnO4, ≥99%), peroxide (H2O2, 30%), chloroform (CHCl3, ≥99%) and ethanol absolute (C2H5OH, ≥99.45%) were purchased from Sigma-Aldrich. All reagents were used as received without further purification. Deionized water was used for all experiments.2.2. Preparation of cellulose nanofibers (CNFs) from sugarcane bagasse
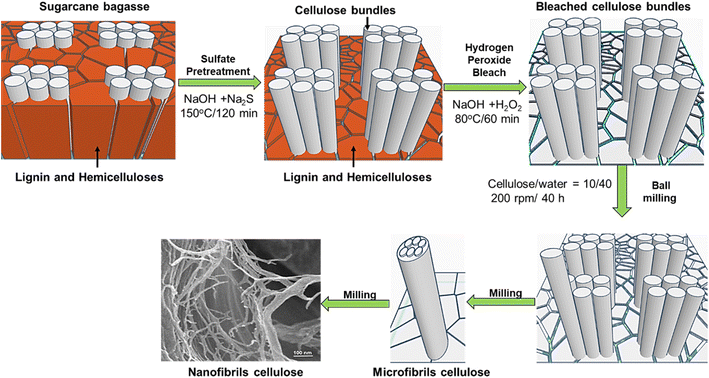
CNFs from sugarcane bagasse were prepared using the three-stage production process. These stages include (i) pretreatment with sulfate agent; (ii) bleaching with hydrogen peroxide in alkaline solution; and (iii) planetary ball milling. In detail, sugarcane bagasse after harvest was pre-treated using a solution mixture of sodium hydroxide and sodium sulfide (sulfidity of 25%) at a solid/liquid ratio of 1 g/9 ml in a 1 litter-autoclave, which was kept in a glycerin bath. The content of active alkali (NaOH + Na2S) was fixed to be 15 wt% over dry bagasse. The pretreatment was performed at 150 °C for 2 h.32,33 After that, the pretreated bagasse was washed with deionized water several times, then bleached with hydrogen peroxide for oxygen delignification. The operational conditions were 5% H2O2, 2% NaOH, 80 °C, and the treatment duration was 60 min. After the bleaching process, the obtained cellulose was washed, squeezed, and the moisture content was determined. Subsequently, a bleached cellulose (10 g) and deionized water (40 ml) were ground for 40 h using a planetary ball mill (Retsch, Germany) to destruct cellulose into CNFs. The ball-mill rotation speed was set at 200 rpm. After 40 hours, the size of cellulose fibers decreased and the fibers structure was more loosely organized. The bundles of macrofibers became the bundles of microfibers and gradually subdivided into CNFs. The CNFs fabrication process can be briefly described as shown in Scheme 1.2.3. Synthesis of reduced graphene oxide
Reduced graphene oxide (RGO) was prepared by oxidizing graphite powder via the modified Hummers' method and followed by a hydrothermal process. The detailed experiment process was performed in the manner described elsewhere.34 Briefly, 10 g of graphite powder was dispersed into 230 ml of the concentrated sulfuric acid solution, then cooled in an ice bath. Subsequently, 30 g of KMnO4 was added and stirred slowly into the mixture to control the reaction temperature below 15 °C. The stirring step remained for 2 h. Next, the mixture was moved out of the ice bath and suffered stirring at 35 °C for 2 days to obtain a pasty brownish mixture. This suspension was diluted by the addition of 300 ml of deionized water. In the next step, 500 ml of deionized water and 25 ml of peroxide were introduced to terminate the reaction. The obtained yellow suspension was subsequently washed and centrifuged several times using 10 wt% HCl solution and deionized water until pH 6–7. Finally, the black solid, graphene oxide (GO), was collected and then dried in an oven for l year 20 h at 70 °C. To obtain RGO, a mixture of GO (1 g) and ethanol (100 ml) was hydrothermally heated at 200 °C for 10 h. The suspension was filtered and washed with deionized water. The obtained solid was dried at 70 °C for 24 h. Following the dispersion in chloroform, sonication for 30 min, and centrifugation, the gel-like substance was vacuum-dried at 60 °C for 12 h to obtain the RGO powder.2.4. Synthesis of polyaniline, nanocellulose fibers/reduced graphene oxide composites
First, a suspension of reduced graphene oxide (RGO) and CNFs was prepared to synthesize the ternary composites. In detail, the designed amounts of RGO and nanocellulose were weighted and dispersed in deionized water under ultrasonication for 1 h. The mass ratio of RGO and CNFs in the suspension mixture was 4![[thin space (1/6-em)]](https://www.rsc.org/images/entities/char_2009.gif) :
:![[thin space (1/6-em)]](https://www.rsc.org/images/entities/char_2009.gif) 1. In addition, 19.61 g of ammonium persulfate was weighted and introduced under constant stirring until thoroughly dissolving. After that, this mixture was chilled in an ice bath at around 2–4 °C. Besides, 8 ml of pure aniline was dissolved in 100 ml of deionized water, followed by 4 ml of 36 wt% HCl acid solution. The solution mixture was then chilled at around 2–4 °C in the ice bath. Next, the two prepared solution mixtures above were mixed under constant stirring for 2 h. The resultant green precipitation was then filtered, washed, and centrifuged several times to remove excess reducing agents. Finally, the prepared composite was dried at a temperature of 60 °C overnight. The ternary composites of PANI, CNFs, and RGO with different compositions were synthesized, as shown in Table 1. The content of PANI in the composites varied from 60 wt% to 100 wt%. Noticeably, during the synthesis process, the molar ratio of ammonium persulfate to aniline was fixed to be 1.15 to ensure the complete occurrence of the oxidation reaction of aniline, and the pH of the aniline containing-solution mixture remained at pH 2.
1. In addition, 19.61 g of ammonium persulfate was weighted and introduced under constant stirring until thoroughly dissolving. After that, this mixture was chilled in an ice bath at around 2–4 °C. Besides, 8 ml of pure aniline was dissolved in 100 ml of deionized water, followed by 4 ml of 36 wt% HCl acid solution. The solution mixture was then chilled at around 2–4 °C in the ice bath. Next, the two prepared solution mixtures above were mixed under constant stirring for 2 h. The resultant green precipitation was then filtered, washed, and centrifuged several times to remove excess reducing agents. Finally, the prepared composite was dried at a temperature of 60 °C overnight. The ternary composites of PANI, CNFs, and RGO with different compositions were synthesized, as shown in Table 1. The content of PANI in the composites varied from 60 wt% to 100 wt%. Noticeably, during the synthesis process, the molar ratio of ammonium persulfate to aniline was fixed to be 1.15 to ensure the complete occurrence of the oxidation reaction of aniline, and the pH of the aniline containing-solution mixture remained at pH 2.
| Sample | CNFs, wt% | RGO, wt% | PANI, wt% |
|---|---|---|---|
| PANI | 0 | 0 | 100 |
| Composite-90 | 2 | 8 | 90 |
| Composite-80 | 4 | 16 | 80 |
| Composite-70 | 6 | 24 | 70 |
| Composite-60 | 8 | 32 | 60 |
2.5. Microstructure and electrochemical characterizations
The morphology and phase structure of the samples were investigated using a field emission Microstructure and electrochemical characterizations.The morphology and phase structure of the samples were investigated using a field emission scanning electron microscope (FE-SEM, JEOL JSM-7600F, Japan) and an X-ray diffractometer (XRD, EQUINOX 5000, France). The texture properties of the materials were evaluated using the nitrogen adsorption–desorption isotherm analysis implemented on Micrometrics Gemini VII equipment (France). The surface area measurements were conducted at 77.15 K. Prior to the measurements, the samples were degassed under a high vacuum. Besides, the samples were analysis their thermal stability using the thermogravimetric analysis (TGA) technique. The TGA measurements were proceeded from room temperature up to 800 °C in the air atmosphere with a heating rate of 10 °C min−1. All the TGA measurements were conducted on Thermal Analysis System TGA/DSC 3+ (Switzerland). Fourier transform infrared (FTIR) spectra were measured with a spectrophotometer (IRAffinity-1, Shimadzu, Japan).
Electrochemical measurements were conducted on Autolab PGSTAT12 Potentiostat using a three-electrode cell, where a platinum mesh and a saturated calomel electrode (SCE) were employed as the counter and reference electrodes, respectively. The electrolyte was 1 M H2SO4 solution. The working electrode was prepared using a slurry method. In specific, the obtained composites (80 wt%) as active material, super P carbon (5 wt%) as conducting agent, and polyvinylidene fluoride or polyvinylidene difluoride (5 wt%) as a binder were mixed well in N-methyl-2-pyrrolidone (NMP) solvent to form a black slurry. Then, the resultant slurry was painted onto a pad of carbon paper as the current was collected. The loading mass was controlled at 1.5 ± 0.2 mg. Finally, the sample was dried at 80 °C in a vacuum chamber for 24 h.
Cyclic voltammetry (CV) was performed within a voltage window of 0–0.8 V vs. SCE at a scan rate of 10 mV s−1. To evaluate the mechanism of the electrode, electrochemical impedance spectroscopy measurements were implemented at open circuit voltage with an amplitude of 5 mV in a frequency range of 0.1 Hz to 100 kHz. Furthermore, the working electrodes were tested using a galvanostatic charge–discharge (GCD) mode under different applied current densities, viz. 1, 5, 8, 10, 15, 20, 25 A g−1 within a voltage range of 0–0.8 V vs. SCE. The long-term cycle life of the working electrode was examined through the GCD mode at 15 A g−1 for repeated 1000 cycles.
The specific capacitance of the electrodes can be calculated based on the following equations:
From CV curves:
 | (1) |
 is the area under the CV plot.
From GCD curves:
 | (2) |
Based on the discharge time from the GCD curves, energy density (E), and power density (P) were calculated using the following relations:
 | (3) |
 | (4) |
3. Results and discussion
Scheme 1 shows the procedure for the fabrication of CNFs. First, the sugarcane baggase was sulfate-pretreated. This stage is called sulfate cooking. For this stage, the pretreatment conditions were selected to be relatively similar to those in the industrial pulping processes.30,31 In this stage, the amount of lignin and hemicellulose was effectively separated, up to about 90%. After that, residual impurities were effectively removed during the subsequent bleaching process. Herein, it is noted that the bleaching process was performed by using hydrogen peroxide agent in alkaline solution without using any chlorine agent. Hydrogen peroxide is known to be a powerful and eco-friendly bleaching agent in a total chlorine-free bleaching cycle. In this study, it is easy to use a small amount of 2% hydrogen peroxide in 5% alkaline solution for dissolving and delignification of the remaining impurities at the moderate treatment condition of 80 °C in 60 minutes. In this way, the fiber bundles were released. The fiber surface is free of clumps, and ready for the next milling stage.The low efficiency of NC is one of factors affecting the economic efficiency of the entire NC production. Therefore, the process of converting the bleached cellulose sugarcane baggase into NC were conducted in a planetary ball mill with a very high efficiency of ∼100%. Water was added into cellulose to soften and increase fibrillation of fibres. At the milling step, with the milling parameters of 200 rpm for 40 h, the converting yield from the bleached cellulose into CNFs reached nearly 100% absolutely no waste in the production of CNFs. Obviously, the three-stage production process in this work offers advantages such as economic benefits, environmental friendliness, mass production and easy processing. This enables the industrial production of CNFs to be realized in the near future. Eventually, in the next step CNFs were used as an ingredient to fabricate the PANI@RGO@CNFs composites.
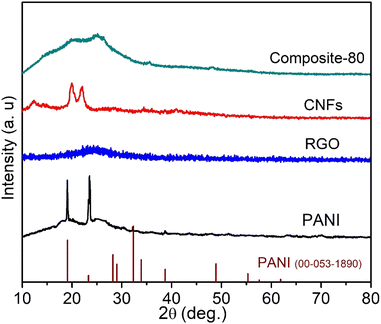
X-ray diffraction (XRD) analysis was used to identify the phase structure of the synthesized samples. Fig. 1 shows the XRD pattern of a typical ternary composite of PANI@RGO@CNFs, viz. the composite-80 sample. To compare, the pure PANI, RGO and CNFs were also analyzed XRD. As observed in Fig. 1, in the absence of the RGO and CNFs ingredients, the XRD pattern of the PANI sample exhibits some sharp diffraction peaks at the 2θ positions of 19.23°, 23.48°, 32.34°, 38.78°. These peaks totally coincide with the standard diffraction lines of PANI with JCPDS card no. 00-053-1890. This indicates the crystalline nature of the synthesized PANI sample (the orthorhombic structure). Noticeably, in addition to the sharp diffraction peaks, the PANI sample shows the XRD pattern with high background signal at around the 2θ angle ranging from 10° to 30°. This also implies that the amorphous phase nature of the resultant PANI. Thus, from the XRD analysis result it can be stated that the synthesized PANI possessed both crystalline and amorphous phases. Meanwhile, as for the RGO sample, no sharp diffraction peak was found, except to a broad and low intensity diffraction peak located at 2θ = 24.6°. This peak was attributed to the RGO (002) crystalline plane.35,36 The CNFs sample also shows some difraction peaks at the 2θ angles of 12.26°, 19.96° and 22.36°. This suggests the nanocrystalline structure of the prepared CNFs.37,38 In contrast with the pure PANI, no sharp diffraction peaks were detected for the composite-80 sample, except for a high background at the 2θ angle from 10° to 30°, suggesting its amorphous phase structure in nature. This can be explained by the presence of RGO and CNFs as a supporting scaffold for PANI probably impacted the polymerization mechanism of the PANI polymer during the synthesis process. In specific, the amorphous phase of PANI was formed favorably instead of its crystalline phase. In other words, adding RGO and CNFs might lower the crystallinity of the PANI polymer. Accordingly, the composite-80 possessed more amorphous domains, which would facilitate the approach of the liquid electrolyte to the electrode active material as well as proton transport.39,40 As a result, the charge–discharge performance of the supercapacitor using the ternary composite-electrodes can be enhanced significantly. In addition, from the XRD pattern of the composite-80, it is observable that the shape of the high background of the XRD pattern located in the 2θ diffraction angle of 10°–30° appears analogous to the shape of the XRD pattern of the NC and RGO ingredients.
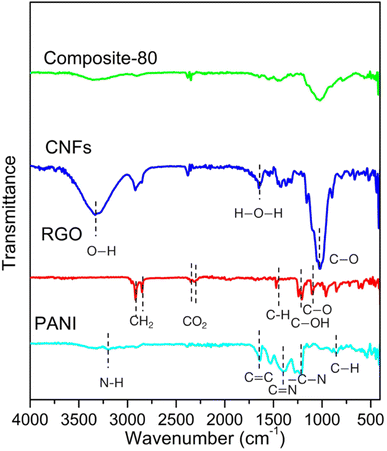
To elucidate the covalent grafting and to confirm the change in functional groups in the synthesized composites, the FTIR analysis was performed. Fig. 2 displays the FTIR spectroscopy of the typical composite-80. For comparison, the FTIR spectra of the ingredients such as PANI, RGO, CNFs were included. As seen, the PANI shows absorption peaks at 3336, 1642 and 1391 cm−1. These peaks are assigned to N–H stretching of the amine group, C=C stretching deformation of quinoid and C=N stretching of secondary aromatic amine, revealing the presence of emeraldine salt state in PANI.41 The other peaks at 1192 and 855 cm−1 correspond to –C–N stretching vibration and out of plane bending vibrations of C–H in the benzene ring, respectively. For the RGO ingredient, prominent absorption bands at 2920 and 2860 cm−1, which correspond to asymmetric and symmetric CH2 stretching.42 It can be also observed that bands around 1472, 1235, and 1088 cm−1 are attributed to C–H bending,43 C–OH stretch of alcohol group, C–O stretching vibrations of C–O–C.42 Meanwhile, the CNFs possesses the absorption peaks located at 3327, 2929, 1650, and 1022 cm−1. These peaks represent O–H vibration elongation, the symmetrical and asymmetrical overlap of C–H and the elongation of the vibration of the aliphatic chain in the spectrum, the elongated vibration of absorbed water (H–O–H) by carbohydrates, C–O stretching vibrations, respectively.44 Noticeably, the FTIR spectrum of the composite-80 is almost identical to that of PANI. No peak at 3336, 2920, 2860 and 1088 cm−1 (corresponding to –OH, –CH2 and C–O–C vibrations, respectively) was found, which confirms that the PANI wrapped the surface of RGO and CNFs.41
The SEM method was used to examine the synthesized samples' morphological surface. Fig. 3 displays the SEM images of RGO, CNFs, PANI, and the typical composite-80 at low and high magnifications. Fig. 3(a) and (b) presents that the synthesized RGO is very porous. It is constructed of graphene sheets with a thickness of ∼30 nm. With such a porous structure, the RGO was expected as a firm scaffold for PANI to anchor. Simultaneously, RGO was referred to work as internal electron conducting bridges within the ternary composites, enhancing the rate capability of the ternary composites. Meanwhile, the CNFs sample illustrates a nanofiber structure. In Fig. 3(c), the low magnification SEM, the cellulose fibers seem to agglomerate due to their high surface area. However, in Fig. 3(d), the nano-sized- diameter of cellulose fibers is easily observed. As estimated, the diameter of cellulose fibers was 8–10 nm, verifying the successful fabrication of CNFs from sugarcane bagasse. As for the PANI sample, which only contained the pure PANI polymer, its surface appears rough (Fig. 3(e) and (f)). The synthesized PANI was composed of irregular particles with an average size of about 2.5 μm. Surprisingly, as for the composite-80 as a typical ternary composite of RGO, CNFs, and PANI, it can be seen from Fig. 3(g) and (h) that the morphology of this composite appears similar to that of the PANI sample. The irregular PANI particles anchoring on the surface of RGO and NC are observed (indicated by white-colored arrows). The shape of RGO and CNFs was hardly recognized. Partly, this is accounted for the predominant component of the PANI polymer in the composite. On the other hand, it is possible that the entire covering of the nascent PANI particles produced on the RGO and CNFs during the polymerization process hides the presence of two rest ingredients in the ternary composite. Thus, the CNFs was a supporting scaffold for the PANI particles to adhere and anchor. This would likely improve porosity, increase the surface area, as well as enhance the conductivity of the synthesized composite materials.
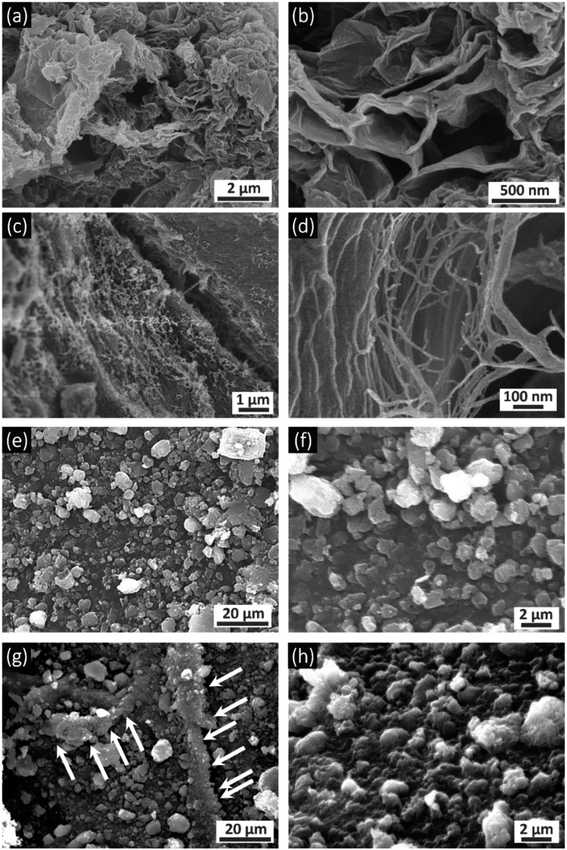 | ||
| Fig. 3 Low and high-resolution SEM images of (a and b) RGO, (c and d) CNFs, (e and f) PANI, and (g and h) composite-80. | ||
To evaluate the porosity of the composites, the samples were analyzed by the nitrogen adsorption–desorption isotherm measurements. The obtained results are presented in Fig. 4. As shown in Fig. 4(a), the shapes of the nitrogen adsorption–desorption isotherm curves of the PANI and composite-80 are of type IV according to the IPUAC classification with an H3 type hysteresis loop in the latter half part, corresponding to the relative pressure P/P0 of 0.5–1.0. This indicates that the samples have a typical mesoporous structure.45 Moreover, the pore size of the samples is mainly distributed between 30÷200 nm, as shown in Fig. 4(b). These pores were formed by the cavities as voids among the PANI particles and composites stacking together, which is consistent with the SEM analysis result. Noticeably, compared with the PANI sample without RGO and CNFs, the composite-80 exhibits a more porous structure. Specifically, the pore size distribution of PANI and composite-80 concentrated at ∼120 nm. Furthermore, the BET surface area of the prepared composite-80 was 21.07 m2 g−1, which is approximately two times higher than that of the PANI (11.23 m2 g−1). Obviously, with the combination of RGO and CNFs, the porosity and surface area of the composite increased dramatically. The enhancement in the porosity and surface area of the composite materials was predicted to facilitate the easy and fast diffusion of the electrolyte into the active material, which would be accompanied by the improved capacitance of the supercapacitors using the composite electrodes.
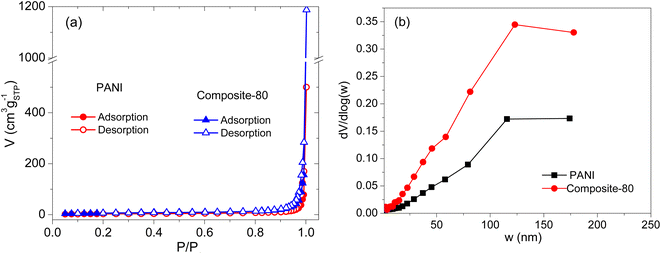 | ||
| Fig. 4 Nitrogen adsorption–desorption isotherm curves (a), and pore size distribution (b) of PANI and composite-80. | ||
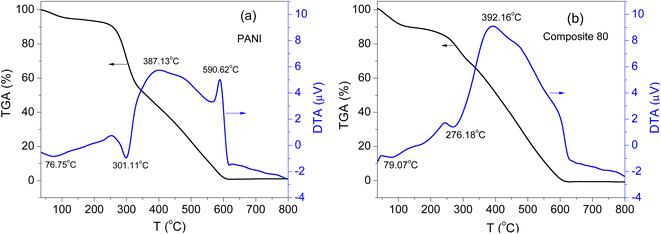
For electrode active materials of any batteries or supercapacitors, thermal stability is an important parameter for examination. In the present work, the samples were analyzed using the TGA method to evaluate the thermal stability of the synthesized composites. Fig. 5 shows the TG and DTA (differential thermal analysis) curves of the PANI and composite-80. For the PANI sample (Fig. 5(a)), as the temperature started to increase, the moisture trapped inside the polymer or bound to the surface of the polymer backbone evaporated.46 The weight loss caused by the moisture evaporation was 5.8 wt%. When the temperature increased to 301.11 °C, an endothermic peak appeared in the DTA plot. This peak represents the decomposition of the residual byproducts such as dimers, trimers, and oligomers generated during the polymerization of PANI as well as the detachment of the HCl dopant in the polymer chain.47 This step corresponds to the weight loss of 51.3 wt% in the TGA plot. At the higher temperature range, two exothermic peaks appeared at 387.13 °C and 590.62 °C, corresponding to two stage-thermal degradations of the PANI polymer chain.48 This decomposition accounted for the weight loss of 41.9 wt%.
Similarly, for the composite-80 (Fig. 5(b)), the TGA plot also exhibited three steps of weight loss. The first weight loss (11.4 wt%) was found at the temperature range of 30 °C–160.1 °C, which corresponds to the first endothermal peak located at 79.07 °C on the DTA plot in Fig. 5b. The second weight loss around the second endothermal peak at 276.18 °C. It is worth noting that, from the DTA plot of the composite-80, only an exothermal peak was detected at the temperature of 392.16 °C. And the weight loss at this temperature approximately 64.5%. This is due to the change in the crystalline structure of the PANI polymer in the presence of two components, RGO and CNFs, in the composite. After being annealed up to about 250 °C, both pure PANI and the composite-80 started to decompose, and the decomposition process was totally completed after the temperature reached about 610 °C. Hence, from the thermal analysis results, it was found that the PANI and ternary composites were unstable at high temperatures. The presence of RGO and CNFs ingredients in the ternary composites hardly influences the thermal stability of the synthesized materials.
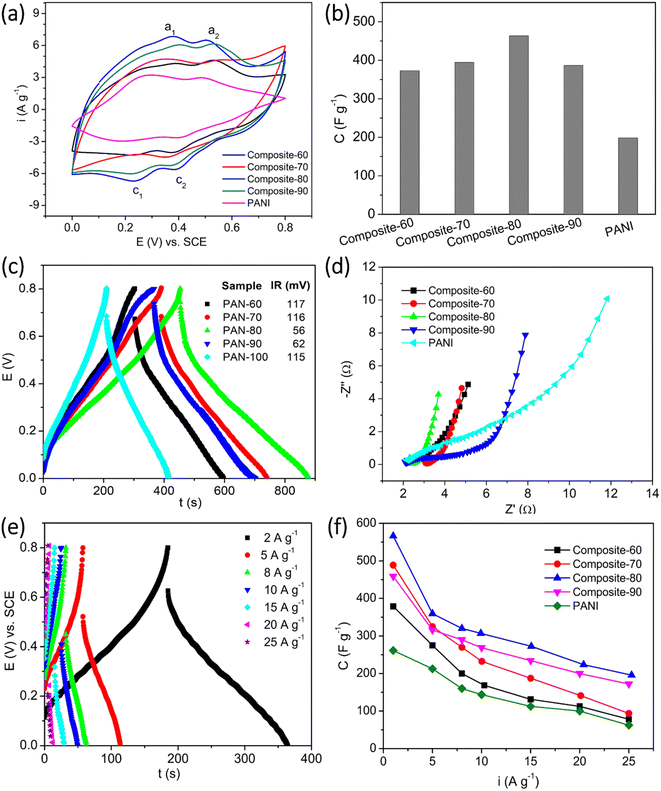
In general, the electrochemical properties of active materials can be determined through CV, GCD, and EIS measurements. The results of these measurements will clarify the working mechanism, capacity, rate capability, cycle life, and degradation mechanism of the electrode active materials. Hence, three techniques were also employed to investigate the supercapacitive behavior of the synthesized materials effectively. Fig. 6(a) shows the CV plots of the composite and PANI electrodes. The CV measurements were recorded at a scan rate of 10 mV s−1 within the potential window of 0–0.8 V vs. SCE. For all the electrodes, two cathodic peaks (denoted as c1 and c2) were found at the potentials of around 0.24 V and 0.4 V. Meanwhile, two anodic (denoted as a1, and a2) were located at ∼0.38 V and ∼0.52 V. The a1/c1 redox peaks represent the doping/de-doping process of the HCl counterions.49,50 The a2/c2 redox peaks correspond to the transition of the PANI, from leucoemeraldine to pernigraniline state.51 The position of the redox peaks of the composites exhibited a certain shift, depending on the content of RGO and CNFs present in the composites. In addition, the current density of the oxidation and reduction peaks also tended to increase with the increasing content of PANI in the composites. The current density of the redox peaks achieved the highest values for the composite-80, then tended to decrease. Based on the eqn (1), the specific capacitances of the electrodes were computed and displayed in Fig. 6(b). At the scan rate of 10 mV s−1, the specific capacitance of the composite-60, composite-70, composite-80, and composite-90 electrodes was 372.7, 394.5, 463.7, and 386.5 F g−1, respectively. So, these values are much higher than that of the PANI electrode in the absence of RGO and CNFs as supporting scaffold, 198.7 F g−1. This is due to the increase in the porosity and surface area of the composites as the RGO and CNFs were introduced. The improved porosity induced the electrolyte to reach the electrode surface favorably. Also, more active sites of the electrode active material were exposed and participated in the redox reactions. Accordingly, the specific capacitance of the composites was enhanced. Herein, among the composites, the composite-80 possessed the highest specific capacitance. This results from the presence of the RGO and CNFs supporting scaffolds with the appropriate contents. The CNFs is an inactive material, while the RGO is a less active material. Thus, the presence of their high content would be detrimental to the capacitance of the composites. On the other hand, their low content would lead to the agglomeration of the main active material, PANI. As a result, it was difficult for the entire bulk PANI to participate in the redox reaction. Eventually, the specific capacitance of the composites was insufficiently high.
Apart from the role of the supporting scaffold for PANI to anchor, the RGO served as the conductive bridges among the PANI particles, which facilitated the charge transfer occurring in the composite electrode. Meanwhile, the CNFs functioned as mechanical bridges to connect the RGO sheets as well as the PANI particles, which would create a stable structure and improve the stability of the composite electrodes. To clarify the roles of RGO and CNFs present in the composites, the composite electrodes were measured the GCD at an applied charge–discharge current of 1 A g−1. From Fig. 6(c), it is observed that the obtained GCD plots of the composites and PANI posed a symmetrical triangle-like shape, demonstrating the highly reversible redox reactions of the electrodes. Furthermore, from the measured GCD plots, the ohmic drop of the electrodes was estimated. In particular, the ohmic drop of the composite-60, composite-70, composite-80, and composite-90 was 117 mV, 116 mV, 56 mV, and 62 mV, respectively. Among the electrodes, the composite-60 posed the lowest ohmic drop. This is indicative of the lowest initial resistance of the composite-80. In contrast, the PANI in the absence of RGO and CNFs as the supporting scaffolds illustrated an extremely high ohmic drop of 115 mV. This value is approximate to that of the composite-60, which contained a large content of RGO and CNFs. Again, the measured GCD results proved that the appropriate contents of RGO and CNFs present in the ternary composites are beneficial for enhancement in the conductivity of the composites.
To further interpret the working mechanism of the synthesized composites, their electrochemical impedance spectroscopy was recorded at open circuit voltage. As seen in Fig. 6(d), the Nyquist plots of the electrodes can be separated into two parts: (i) a depressed semicircle at the high-frequency range, which corresponds to a charge transfer process, and (ii) a straight line at the low frequency, which represents the Warburg diffusion process. Compared with the other composite electrodes, it is noteworthy that the PANI electrode manifests the semicircle with a much larger dimension. This implies the difficulty in the charge transfer process in the absence of RGO and CNFs; owing to RGO and CNFs as the supporting scaffolds, the charge transfer process was facilitated. It is easy to recognize that the composite-80 possesses the smallest dimension. It means that the occurrence of the redox reactions on the surface of composite-80 was the most favorable. In addition, the slope of the straight lines on the Nyquist spectroscopies shows a tendency to increase gradually with the increase in the contents of RGO and CNFs, except for the composites with the content of RGO and CNFs over 20 wt%, viz. composite-70, and composite-60. The high slope of the line in the low-frequency range illustrates the favorable diffusion of ions during charge–discharge processes of supercapacitors. Due to the enhanced porosity of the composites in the presence of the RGO and CNFs supporting scaffolds, the electrolyte reached the electrode surface easily and effectively. Therefore, the presence of the pores in the ternary composites shortens the H+ and Cl− ions transmission pathway and fastens their diffusion rate. In addition, this perspective is also verified by the GCD results, as shown in Fig. 6(e) and (f).
Fig. 6(e) depicts the GCD plots of the typical composite-80 electrodes at various applied currents ranging from 2 to 25 A g−1. Obviously, at the higher applied currents, the ohmic drop of the electrode was more significant, and the charge and discharge plateaus, which represent the faradaic mechanism of batteries or pseudocapacitors, of the electrode almost disappeared. Based on eqn (2), the specific capacitance of the electrodes at the different charge–discharge currents was estimated and displayed in Fig. 6(f). Regarding the composite-80, at any charge–discharge currents under investigation, this electrode always delivered a high specific capacitance superior to other rest electrodes. At the charge and discharge current of 1 A g−1, the composite-80 electrode supplied the highest specific capacitance of 566.2 F g−1, which is as above 2 times high as that of the PANI electrode (260 F g−1). Even at the severe charge–discharge conditions such as at 20 and 25 A g−1, the composite-80 electrode still the relatively high specific capacitances of 223.5 F g−1 and 195.7 F g−1, correspondingly. This suggests the outstanding supercapacitive behaviors of the composite-80 electrode compared with other rest composites. So, the composite-80 is regarded as the optimal composite sample among the ternary composites of PANI, RGO, and CNFs. In addition, the energy density and power density of the composite-80 at different current densities were calculated and summarized in Table 2. From Table 2 it can be seen that, the composite-80 possessed the energy density between 143.6 F V2 g−1 to 45 F V2 g−1 corresponding to the current density in a variety of 2÷25 A g−1, and this composite shows the maximum power density of 9.8 F V2 g−1 s−1 at the current density of 10 A g−1.
| Current density (A g−1) | Discharge time (s) | Specific capacitance (F g−1) | Energy density (F V2 g−1) | Power density (F V2 g−1 s−1) |
|---|---|---|---|---|
| 2 | 179.5 | 448.7 | 143.6 | 0.8 |
| 5 | 56.5 | 353.1 | 113 | 2 |
| 8 | 31 | 310 | 99.2 | 3.2 |
| 10 | 24.5 | 306.2 | 98 | 9.8 |
| 15 | 14.5 | 271.8 | 87 | 6 |
| 20 | 6 | 150 | 48 | 2.4 |
| 25 | 4.5 | 140.6 | 45 | 1.8 |
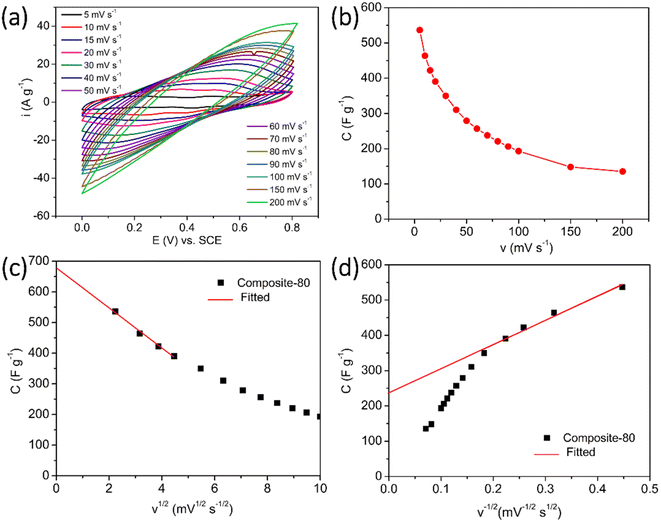
In fact, as observed in Fig. 7(a), the CV curves of the composite electrode seem to be analogous to that of the electrodes of electrical double layer supercapacitors.8,52,53 The deviation of rectangular shape in these CV curves implies the co-existence of two charge storage mechanisms of the composites. RGO is well-known for its double layer storage mechanism, while PANI is established for its faradaic redox reaction mechanism.54,55 So, to determine the contribution of the capacitance components, which are caused by the effect of the double layer as well as by the redox reactions in the total capacitance of the electrode. The optimal composite-80 electrode was measured CV at different scan rates from 5 mV s−1 to 200 mV s−1 (Fig. 7(a)) and the corresponding specific capacitances were computed and displayed in Fig. 7(b). Based on the calculation manner of Trasatti et al.,56 the total specific capacitance of the composite-80 can be described as follows:
| Ctotal = Cin + Cout | (5) |
The total and outer specific capacitances can be calculated by using extrapolation from the specific capacitance versus square root of scan rate curve when the scan rate equals zero (v = 0) and extrapolation from the specific capacitance versus the inversion of the square root of scan rate curve when the scan rate reaches infinity (v → ∞).6 From the results in Fig. 7(c) and (d), the estimated total and outer specific capacitances of the composite-80 were 566.2 F g−1 and 235.5 F g−1, respectively. Accordingly, the contribution of the double layer effect on the total charge storage mechanism was 34.8%. This is a relatively large value, indicating that the addition of RGO and CNFs into the composite-80 resulted in a significantly enhanced surface area of the electrode. Accordingly, the contribution of the outer capacitance into the total capacitance of the electrode was increased because for an electrode active material like PANI, which works via the faradaic redox reaction, the contribution of the double layer effect is often accounted for 5–10% of the total capacitance of the electrode.57 This calculation confirms the potential application of the composite as electrode active material for hybrid supercapacitors.
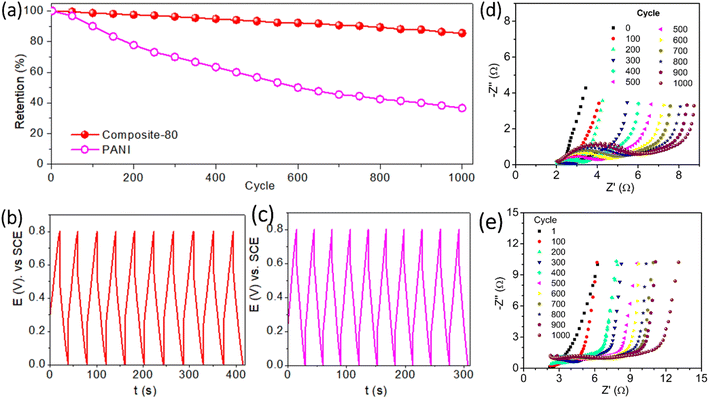
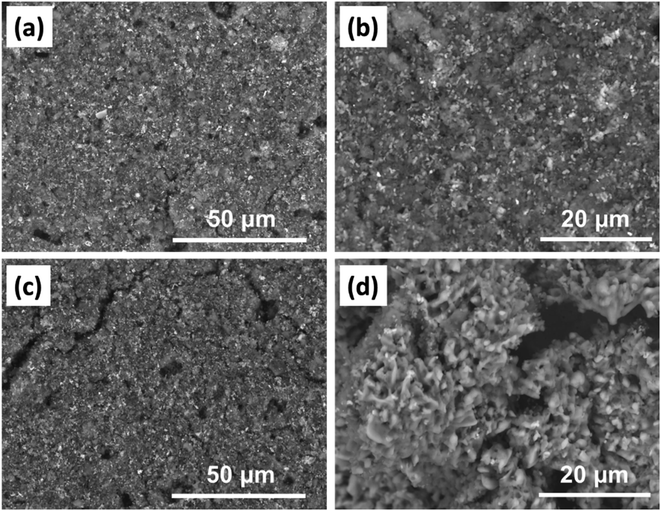
To evaluate the long-term cyclability of the optimal composite-80, the electrode was charged and discharged at the applied current of 15 A g−1 within the potential range of between 0 and 0.8 V vs. SCE for 1000 cycles. For comparison, the PANI electrode was tested as well. Fig. 8(a) shows that the composite-80 electrode showed excellent capacitance retention after a long cycling duration. After 1000 cycles of charge and discharge, the composite-80 electrode is still maintained at 85.47% of the initial capacitance, corresponding to the capacitance fade of 0.01453% per cycle. On the contrary, the PANI electrode disclosed a serious degradation in capacitance with capacitance retention of 36.7% over 1000 cycles, although the capacitance decay in some initial cycles was negligible (Fig. 8(b) and (c)). It is easy to recognize that the capacitance deterioration of the electrodes during 1000 cycles of charge and discharge stems from the consecutive increase in the electrochemical impedance of the electrodes, especially the dramatical increase in the charge transfer resistance, which is manifested by the diameter of the semicircle of the Nyquist plot in the high-frequency range (Fig. 8(d) and (e)). Besides, to clarify the cause of performance degradation further of the composite-80 electrode, the surface change of the electrode after cycling test was captured. As shown in Fig. 9(a) and (b), before cycling test the surface of the electrode is rather smooth. Almost, no crack and no damage are observed. However, after cycling test of 1000 cycles the electrode shows few certain damages (Fig. 9(c) and (d)). This can be considered as a cause of the capacitance degradation of the electrode after cycling test.
To clarify the superior electrochemical performance of the composite-80 as electrode active material for supercapacitors, Table 3 supplies the data on the specific capacitance and cyclability of the PANI based-electrode reported previously and those of composite-80 for easy comparison. It is clear that the supercapacitive performance of the composite-80 prepared in this study is comparable or higher than those reported in other papers.
| Composites | Highest specific capacitance/current density | Cycle number/current rate | Retention | Ref. |
|---|---|---|---|---|
| Bacterial cellulose/PANI | 273 F g−1/0.2 Ag−1 | 1000 cycles/0.4 A g−1 | 94.3% | 16 |
| PANI/cellulose hydrogels | 1003.5 mF cm−2/1 mA cm−2 | 2000 cycles/100 mV s−1 | 90% | 23 |
| PANI/CNFs/graphite nanoplatelets | 421.5 F g−1/1 A g−1 | 1000 cycles/8 A g−1 | 78.3% | 24 |
| PANI/graphene/bacterial cellulose | 4.16 F cm−2/1 mA cm−2 corresponding to 452.2 F g−1/0.11 A g−1 | 2000 cycles/5 mA cm−2 corresponding to 2000 cycles/0.54 A g−1 | 91.5% | 26 |
| PANI/cellulose/polyacrylamide | 835 mF cm−2/1 mA cm−2 corresponding to 251.8 F g−1/0.3 A g−1 | 5000 cycles/200 mV s−1 | 96% | 28 |
| MXene/CNF-PANI | 327 F g−1/3 mA cm−2 | 3000 cycles/50 mA cm−2 | 71.6% | 58 |
| Composite-80 | 566.2 F g−1/1 A g−1 | 1000 cycles/15 A g−1 | 85.4% | This work |
4. Conclusions
In the present work, the ternary composites of PANI, RGO, and CNFs have been fabricated successfully using the chemical synthesis method, wherein NC was extracted from sugarcane bagasse harvested from the North of Vietnam. Here, we demonstrated that incorporation of RGO and CNFs in PANI significantly increases the electric conductivity and electrochemical durability of the synthesized composites. RGO plays conducting bridges to make internal electrical connections between the PANI particles and a supporting scaffold for the PANI particles to anchor. This leads to enhancing the surface area and porosity of the ternary composites. Similarly, CNFs also work as a supporting scaffold, connecting the rest ingredients of RGO and PANI to produce a stable structure; which stabilizes the volumetric shrinkage/expansion of the PANI, and thus prolongs the cyclelife for supercapacitors using the composite electrodes. Among the ternary composites, the composite-80 sample exhibited outstanding supercapacitive performance. The high specific capacitance obtained at 566.2 F g−1 in combination with excellent long-term cyclability with 85.47% capacitance retention after 1000 cycling test; exhibits a suitable candidate for hybrid supercapacitors.Conflicts of interest
There are no conflicts to declare.Acknowledgements
This work was supported by Fund of National Key Laboratory for Polymer & Composite Materials, Hanoi University of Science and Technology (grant no. PTNPLM-2021-04).References
- A. Z. Al Shaqsi, K. Sopian and A. Al-Hinai, Energy Rep., 2020, 6, 288–306 CrossRef.
- A. G. Olabi, C. Onumaegbu, T. Wilberforce, M. Ramadan, M. A. Abdelkareem and A. H. Al-Alami, Energy, 2021, 214, 118987 CrossRef CAS.
- S. Khan, A. Mahmood, A. Ul Haq Ali Shah, G. Rahman, A. Khan and N. Ullah, J. Electroanal. Chem., 2022, 923, 116760 CrossRef CAS.
- M. E. Yibowei, J. G. Adekoya, A. A. Adediran and O. Adekomaya, Environ. Sci. Pollut. Res., 2021, 28, 26269–26279 CrossRef CAS PubMed.
- R. Saliger, U. Fischer, C. Herta and J. Fricke, J. Non-Cryst. Solids, 1998, 225, 81–85 CrossRef CAS.
- A. Roy, A. Ray, S. Saha, M. Ghosh, T. Das, B. Satpati, M. Nandi and S. Das, Electrochim. Acta, 2018, 283, 327–337 CrossRef CAS.
- S. Wang, K. Cao, L. Xu, D. Zhao and Y. Tong, Appl. Phys. A, 2021, 128, 81 CrossRef.
- X. Du, P. Guo, H. Song and X. Chen, Electrochim. Acta, 2010, 55, 4812–4819 CrossRef CAS.
- G. F. L. Pereira, E. E. Fileti and L. J. A. Siqueira, J. Phys. Chem. C, 2021, 125, 2318–2326 CrossRef CAS.
- Y. Teng, K. Liu, R. Liu, Z. Yang, L. Wang, H. Jiang, R. Ding and E. Liu, Mater. Res. Bull., 2017, 89, 33–41 CrossRef CAS.
- H. Jiang, X. Yan, J. Miao, M. You, Y. Zhu, J. Pan, L. Wang and X. Cheng, J. Mater., 2021, 7, 156–165 Search PubMed.
- S. Jeon, J. H. Jeong, H. Yoo, H. K. Yu, B.-H. Kim and M. H. Kim, ACS Appl. Nano Mater., 2020, 3, 3847–3858 CrossRef CAS.
- D. Wu, X. Xie, Y. Zhang, D. Zhang, W. Du, X. Zhang and B. Wang, Front. Mater., 2020, 7, 2 CrossRef.
- S. Bashir, K. Hasan, M. Hina, R. Ali Soomro, M. A. Mujtaba, S. Ramesh, K. Ramesh, N. Duraisamy and R. Manikam, J. Electroanal. Chem., 2021, 898, 115626 CrossRef CAS.
- B. Che, H. Li, D. Zhou, Y. Zhang, Z. Zeng, C. Zhao, C. He, E. Liu and X. Lu, Composites, Part B, 2019, 165, 671–678 CrossRef CAS.
- H. Wang, E. Zhu, J. Yang, P. Zhou, D. Sun and W. Tang, J. Phys. Chem. C, 2012, 116, 13013–13019 CrossRef CAS.
- G. A. Tafete, M. K. Abera and G. Thothadri, J. Energy Storage, 2022, 48, 103938 CrossRef.
- Q. Deng, H. Liu, Y. Zhou, Z. Luo, Y. Wang, Z. Zhao and R. Yang, J. Electroanal. Chem., 2021, 899, 115668 CrossRef CAS.
- H. Khammar, A. Abdelwahab, H. S. Abdel-Samad and H. H. Hassan, J. Electroanal. Chem., 2021, 880, 114848 CrossRef CAS.
- G. Zeplin and E. G. C. Neiva, J. Electroanal. Chem., 2021, 902, 115776 CrossRef CAS.
- Z. Wang, P. Tammela, M. Strømme and L. Nyholm, Adv. Energy Mater., 2017, 7, 1700130 CrossRef.
- M. A. Mohammed, W. J. Basirun, N. M. M. A. Rahman and N. M. Salleh, in Nanocellulose Based Composites for Electronics, ed. S. Thomas and Y. B. Pottathara, Elsevier, 2021, pp. 313–335, DOI:10.1016/B978-0-12-822350-5.00013-8.
- Q. Gong, Y. Li, X. Liu, Z. Xia and Y. Yang, Carbohydr. Polym., 2020, 245, 116611 CrossRef PubMed.
- W. Zheng, R. Lv, B. Na, H. Liu, T. Jin and D. Yuan, J. Mater. Chem. A, 2017, 5, 12969–12976 RSC.
- S. Ke, D. Xie, K. Zhang, F. Cheng and Y. Wu, Mater. Adv., 2022, 3, 2026–2036 RSC.
- R. Liu, L. Ma, S. Huang, J. Mei, J. Xu and G. Yuan, New J. Chem., 2017, 41, 857–864 RSC.
- M. Ben Hadj Said, K. Charradi, Z. Ahmed, H. Cachet, C. Debiemme-Chouvy, Q. A. Alsulami, S. Boufi, S. M. A. S. Keshk and R. Chtourou, Int. J. Energy Res., 2022, 46, 13844–13854 CrossRef CAS.
- Y. Li, Q. Gong, X. Liu, Z. Xia, Y. Yang, C. Chen and C. Qian, Carbohydr. Polym., 2021, 267, 118207 CrossRef CAS PubMed.
- D. Pradhan, A. K. Jaiswal and S. Jaiswal, Carbohydr. Polym., 2022, 285, 119258 CrossRef CAS PubMed.
- P. Bajpai, Environmentally Benign Pulping, Springer International Publishing, 2023 Search PubMed.
- T. Komatsu, K. Yamauchi and T. Yokoyama, J. Wood Chem. Technol., 2023, 43, 67–77 CrossRef CAS.
- N. T. M. Phuong, P. H. Hoang, L. Q. Dien and D. T. Hoa, Clean Technol. Environ. Policy, 2017, 19, 1313–1322 CrossRef.
- L. Q. Dien, N. T. M. Phuong, D. T. Hoa and P. Huy Hoang, Appl. Biochem. Biotechnol., 2015, 175, 1536–1547 CrossRef CAS PubMed.
- S. Setiadji, B. W. Nuryadin, H. Ramadhan, C. D. D. Sundari, T. Sudiarti, A. Supriadin and A. L. Ivansyah, IOP Conf. Ser.: Mater. Sci. Eng., 2018, 434, 012079 Search PubMed.
- B. Gupta, N. Kumar, K. Panda, V. Kanan, S. Joshi and I. Visoly-Fisher, Sci. Rep., 2017, 7, 45030 CrossRef CAS PubMed.
- X. Jiao, Y. Qiu, L. Zhang and X. Zhang, RSC Adv., 2017, 7, 52337–52344 RSC.
- T. Wongjaiyen, W. Brostow and W. Chonkaew, Polym. Bull., 2018, 75, 2039–2051 CrossRef CAS.
- S. K. Evans, O. N. Wesley, O. Nathan and M. J. Moloto, Heliyon, 2019, 5, e02635 CrossRef.
- W. Xiao, X. Li, H. Guo, Z. Wang, Y. Zhang and X. Zhang, Electrochim. Acta, 2012, 85, 612–621 CrossRef CAS.
- H. T. T. Le, D. T. Ngo, R. S. Kalubarme, G. Cao, C.-N. Park and C.-J. Park, ACS Appl. Mater. Interfaces, 2016, 8, 20710–20719 CrossRef CAS.
- M. Kumar, K. Singh, S. K. Dhawan, K. Tharanikkarasu, J. S. Chung, B.-S. Kong, E. J. Kim and S. H. Hur, Chem. Eng. J., 2013, 231, 397–405 CrossRef CAS.
- T. F. Emiru and D. W. Ayele, Egypt. J. Basic Appl. Sci., 2017, 4, 74–79 Search PubMed.
- I. O. Faniyi, O. Fasakin, B. Olofinjana, A. S. Adekunle, T. V. Oluwasusi, M. A. Eleruja and E. O. B. Ajayi, SN Appl. Sci., 2019, 1, 1181 CrossRef CAS.
- D. B. Menezes, F. M. Diz, L. F. Romanholo Ferreira, Y. Corrales, J. R. V. Baudrit, L. P. Costa and M. L. Hernández-Macedo, Cellulose, 2021, 28, 4137–4149 CrossRef CAS.
- K. S. W. Sing and R. T. Williams, Adsorpt. Sci. Technol., 2004, 22, 773–782 CrossRef CAS.
- M. Khairy and M. E. Gouda, J. Adv. Res., 2015, 6, 555–562 CrossRef CAS PubMed.
- M. B. Mohamed and K. El-Sayed, Composites, Part B, 2014, 56, 270–278 CrossRef CAS.
- B. A. Bhanvase, N. S. Darda, N. C. Veerkar, A. S. Shende, S. R. Satpute and S. H. Sonawane, Ultrason. Sonochem., 2015, 24, 87–97 CrossRef CAS PubMed.
- H. K. Hassan, N. F. Atta and A. Galal, Int. J. Electrochem. Sci., 2012, 7, 11161–11181 CrossRef CAS.
- A. Watanabe, K. Mori, Y. Iwasaki, Y. Nakamura and S. Niizuma, Macromolecules, 1987, 20, 1793–1796 CrossRef CAS.
- M. H. Pournaghi-Azar and B. Habibi, Electrochim. Acta, 2007, 52, 4222–4230 CrossRef CAS.
- A. Daraghmeh, S. Hussain, A. U. Haq, I. Saadeddin, L. Servera and J. M. Ruiz, J. Energy Storage, 2020, 32, 101798 CrossRef.
- X. You, M. Misra, S. Gregori and A. K. Mohanty, ACS Sustainable Chem. Eng., 2018, 6, 318–324 CrossRef CAS.
- G. A. Snook, P. Kao and A. S. Best, J. Power Sources, 2011, 196, 1–12 CrossRef CAS.
- Poonam, K. Sharma, A. Arora and S. K. Tripathi, J. Energy Storage, 2019, 21, 801–825 CrossRef.
- S. Ardizzone, G. Fregonara and S. Trasatti, Electrochim. Acta, 1990, 35, 263–267 CrossRef CAS.
- B. E. Conway, Electrochemical Supercapacitors: Scientific Fundamentals and Technological Applications, Springer Science & Business Media, 2013 Search PubMed.
- L. Xu, W. Wang, Y. Liu and D. Liang, Gels, 2022, 8, 798 CrossRef CAS PubMed.
| This journal is © The Royal Society of Chemistry 2023 |

