 Open Access Article
Facile synthesis of a CuSe/PVP nanocomposite for ultrasensitive non-enzymatic glucose biosensing
Momna Rasheeda,
Farhat Saira *b,
Zahida Batool
 *a,
Hasan M. khan
 a,
Junaid Yaseena,
Muhammad Arshadb,
Ambreen Kalsoomc,
Hafiz Ejaz Ahmeda and
Muhammad Naeem Ashiq
 d
d
aInstitute of Physics, The Islamia University of Bahawalpur, Pakistan. E-mail: zahida.batool@iub.edu.pk
bNanoscience and Technology Division, National Center for Physics (NCP), Islamabad, Pakistan. E-mail: Farhat.saira@ncp.edu.pk
cDepartment of Physics, GSCWU, Bahawalpur, Pakistan
dInstitute of Chemical Sciences, Bahauddin Zakariya University of Multan, Pakistan
First published on 6th September 2023
Abstract
Non-enzymatic glucose biosensors show high sensitivity, lower response time, wide linear range and low cost. Copper based composites show excellent electrocatalytic tunability and lead to a better charge transfer in electrochemical non-enzymatic glucose biosensors. In this work, a nanocomposite of polyvinylpyrrolidone (PVP) and copper selenide was synthesized by a facile one pot sol gel method. Synthesized nanomaterials were characterized by XRD, FTIR, UV-visible spectroscopy, SEM, EDS and XPS techniques. Electrochemical behavior was analyzed by cyclic voltammetry (CV), electrochemical impendence (EIS) and chronoamperometry techniques. XRD analysis revealed a hexagonal structure and crystalline nature of CuSe/PVP. FTIR spectra depicted C–N bonding at 1284 cm−1 and C![[double bond, length as m-dash]](https://www.rsc.org/images/entities/char_e001.gif) O stretching at 1634 cm−1, which indicated the presence of PVP in the nanocomposite. Stretching at 823 cm−1 was attributed to the presence of copper selenide. UV-visible absorption indicated the bandgap of copper selenide/PVP at 2.7 eV. SEM analysis revealed a flake like morphology of CuSe/PVP. EDS and XPS analysis confirmed the presence of copper and selenium in the prepared nanocomposite. Prior to employing for biosensing applications, it is important to evaluate the antibacterial activity of nanomaterials for long term use in biological in vitro testing. These materials have shown an efficient inhibition zone of 26 mm against Gram negative Pseudomonas at 50 μg ml−1 and MIC value of 10 μg ml−1. Cyclic voltammetry shows that CuSe/PVP is a promising biosensor for monitoring glucose levels in a wide linear range of 0.5 mM to 3 mM at an excellent sensitivity of 13
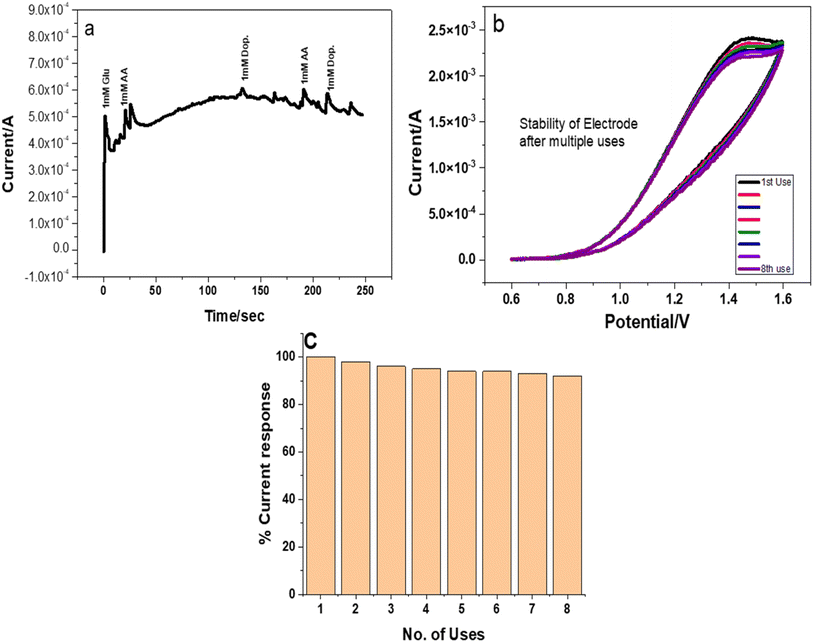
O stretching at 1634 cm−1, which indicated the presence of PVP in the nanocomposite. Stretching at 823 cm−1 was attributed to the presence of copper selenide. UV-visible absorption indicated the bandgap of copper selenide/PVP at 2.7 eV. SEM analysis revealed a flake like morphology of CuSe/PVP. EDS and XPS analysis confirmed the presence of copper and selenium in the prepared nanocomposite. Prior to employing for biosensing applications, it is important to evaluate the antibacterial activity of nanomaterials for long term use in biological in vitro testing. These materials have shown an efficient inhibition zone of 26 mm against Gram negative Pseudomonas at 50 μg ml−1 and MIC value of 10 μg ml−1. Cyclic voltammetry shows that CuSe/PVP is a promising biosensor for monitoring glucose levels in a wide linear range of 0.5 mM to 3 mM at an excellent sensitivity of 13![[thin space (1/6-em)]](https://www.rsc.org/images/entities/char_2009.gif) 450 μA mM−1 cm−2 with an LOD of 0.223 μM. Chronoamperometry measurements revealed a selective behavior of CuSe/PVP for glucose biosensing amongst ascorbic acid and dopamine as common interfering molecules. The nanocomposite was stable after 8 repeated cycles with 92% retention for glucose sensing capacity. This is attributed to the stable nature of the CuSe/PVP nanocomposite as well as higher surface area of available active sites. Herein the CuSe/PVP nanocomposite offered reasonable selectivity, high sensitivity wide linear range with very low LOD, as well as being abundant in nature, this Cu based biosensor has promising applications for future point of care tests (POCT).
450 μA mM−1 cm−2 with an LOD of 0.223 μM. Chronoamperometry measurements revealed a selective behavior of CuSe/PVP for glucose biosensing amongst ascorbic acid and dopamine as common interfering molecules. The nanocomposite was stable after 8 repeated cycles with 92% retention for glucose sensing capacity. This is attributed to the stable nature of the CuSe/PVP nanocomposite as well as higher surface area of available active sites. Herein the CuSe/PVP nanocomposite offered reasonable selectivity, high sensitivity wide linear range with very low LOD, as well as being abundant in nature, this Cu based biosensor has promising applications for future point of care tests (POCT).
1. Introduction
Diabetes is a silent and potentially deadly condition that often remains asymptomatic until it reaches an advanced stage, leading to severe complications.1 Prediabetes, the early stage of diabetes, typically manifests without noticeable symptoms in patients. This condition is commonly attributed to factors such as overeating, obesity, genetic predisposition, and stress. Unfortunately, the diagnostic process for prediabetes is complex and time-consuming, necessitating the development of a rapid screening test for this life-threatening disease. It is crucial to identify diabetes at an early stage in both diabetic patients and individuals without symptoms through continuous monitoring of glucose levels, as this facilitates timely intervention and the adoption of preventive measures. Although commercially available strip-based glucose detectors are commonly employed for blood glucose analysis, their limited shelf life, low sensitivity, lack of reusability, and high cost emphasize the need for an alternative solution in glucose sensing.2–4Glucose biosensors can be broadly categorized into two types: enzymatic and non-enzymatic. Traditional glucose sensors used in blood detection rely on the glucose oxidase (Gox) enzyme, which is highly sensitive to environmental factors like temperature and humidity. Furthermore, the limited lifespan of the enzyme poses challenges to the stability and reproducibility of enzymatic glucose sensors. Moreover, enzymatic sensors exhibit the oxidation of interfering substances, leading to decreased selectivity for glucose as the target analyte. To overcome the pH and temperature dependency observed in enzyme-based sensors, the development of non-enzymatic glucose sensors has become crucial. Non-enzymatic glucose biosensors have garnered significant interest in the scientific and technological domains due to their high stability, sensitivity, affordability, and ease of preparation.5–7
Non-enzymatic electrochemical sensors involve directly depositing a sensing material onto the electrode surface, enabling unrestricted electron flow and enhancing conductivity. By utilizing non-biological materials, these sensors ensure analytical sensing remains unaffected by working conditions, temperature, or pH. This type of electrochemical sensor has experienced significant advancements in recent years. Various enzyme-free glucose sensors have been developed, employing different materials such as metal nanostructures and carbon nanomaterials. These materials are often immobilized using binders; however, non-conductive polymer-based binders can impede catalysis by inhibiting rapid electron transfer and diminishing sensitivity.8–11 In contrast, metals like cobalt, nickel, and iron have been utilized for glucose oxidation, offering advantages such as their abundance, low cost, and eco-friendliness.12,13 Metallic alloys and compounds, such as Co and Ni, Ni and Fe, and Ni and Cu, have also demonstrated excellent electrochemical glucose biosensing capabilities.14–17 Copper, due to its favorable electrochemical properties and cost-effectiveness, is considered an ideal material for the development of electrochemical biosensors. Copper's abundance on Earth makes it highly accessible for various catalytic applications.18–20 Recent studies have highlighted the superior catalytic activity of copper nanoparticles, which offer a multitude of active sites for enzyme-free glucose biosensing. However, nanoparticles are prone to agglomeration, leading to reduced catalytic activity. Nanocomposite of metal oxide and conducting polymer, not only enhance the reactive sites but also supports the material from agglomeration. Transition metal chalcogenides (TMC) are the recent highlights in electrochemical sensing and charge storage devices because of their superior catalytic performance owing to the high degree of covalency and reduced anion electronegativity. Moving from top to bottom in chalcogens, electronegativity decreases, that results in higher electrocatalytic activity. In a series of studies conducted, from NiO to NiTe, chalcogens have shown improved water splitting redox reactions moving down the group in periodic table from oxide to telluride. Moreover, copper selenide is biocompatible and possesses antimicrobial properties.21,22 Copper based material exhibit compatibility with biological systems, ensuring minimal adverse effects and maintaining the integrity of the sensor. For this purpose, we also conducted thorough antibacterial activities for CuSe/PVP nanocomposite prior to use in biosensor applications. By employing a biocompatible sensing material, the sensor can effectively interact with the target analyte while minimizing any unwanted interactions with other substances, thus enhancing both sensitivity and selectivity.
The focus of this paper is to investigate the potential of copper selenide and polyvinylpyrrolidone based nanocomposites for glucose detection. Antibacterial in vitro investigations were also conducted for CuSe/PVP nanocomposites, to evaluate the withstand potential of nanocomposite during glucose biosensing. The composite of both materials exhibited high stability and wide linear range for detection of glucose. The CuSe/PVP composite demonstrates exceptional performance in detecting glucose levels at very low concentrations with wide linear range and high selectivity for glucose amongst common interferants ascorbic acid and dopamine. As previous reports were based on CuO, CuO–ZnO, CuS, CuO/polymer, CuSe and their alloys for biosensing applications, this is a novel and comprehensive exploration of CuSe/PVP nanocomposites for glucose biosensing.
2. Methodology
2.1. Chemicals
Sigma-Aldrich was the source for obtaining selenium (Se) powder of the highest purity (99.9%), copper sulfate pentahydrate with a purity of 99.9%, PVP (polyvinylpyrrolidone), dimethylformamide (DMF) and ammonia (NH3).2.2. Instrumentation
To investigate the structural and crystallographic insight of CuSe/PVP, powder XRD analysis was utilized with Cu Kα (λ = 1.54178 Å) rays. X-ray diffraction pattern of CuSe/PVP was measured at room temperature between 20° and 80° θ. The scan rate used is 1° min−1. FTIR is the spectral analysis of the chemical compound which provides the information about functional groups present in the sample. FTIR of CuSe/PVP is measured between the range of 4000 cm−1 to 400 cm−1 by using (SHIMADZU) spectrometer. For detecting the optical properties of CuSe/PVP, a UV-visible spectroscopy was employed. To investigate the micro structural image of the prepared sample, SEM technique is used. For this, ZEISS Sigma 500VP is used which is also equipped with EDX unit. XPS measurements were performed using a Scienta-Omicron XPS instrument that was equipped with a micro-focused monochromatic Al K Alpha X-ray source and the Gamry 1000 potentiostat at room temperature was used for electrochemical measurements.2.3. Antibacterial analysis of CuSe/PVP nanocomposite
To examine the susceptibility of copper selenide and PVP against different bacteria, disk diffusion method was employed. Two-gram negative bacteria i.e.; Escherichia coli and Pseudomonas aeruginosa were used. These two bacteria were obtained from Bahawalpur Victoria Hospital, Bahawalpur. Clad agar and nutrient agar were used as a medium. Prepared solution of antibiotic (copper selenide and PVP) is distributed equally on the disks. These disks were then placed in disinfected conditions. After that, placed it on agar plates comprising bacteria with a disk that has measured quantity of antibiotics, tigecycline (TGC) as well as levofloxacin (LEV) at the central area of plate. For 24 h, incubated these plates under the temperature of 37 °C. For the performance of antibiotics against bacteria, their respective zone of inhibitions were measured.2.4. Synthesis of CuSe/PVP
For synthesis of CuSe/PVP a one pot co-precipitation method was applied. Briefly, 0.125 g of CuSO4·5H2O was added in 50 ml DMF. Stirred for an hour until a complete dissolution of CuSO4·5H2O was acquired. Small amount of selenium powder added into a cleared mixture and stirred for an hour. A mild aqua colored solution was obtained. After this, 0.5 g of PVP was added and stirred it for another 20 minutes. With the help of ammonia, pH of the solution was maintained. Finally, a blackish precipitate were obtained. These precipitates were cooled down to room temperature and then dried at 200 °C in oven.3. Results and discussion
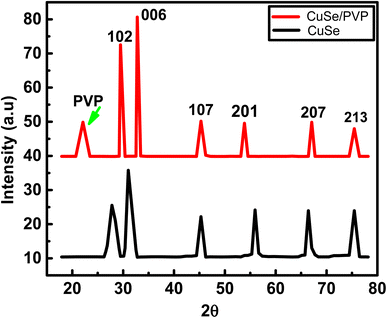
3.1. XRD analysis
XRD diffraction peaks of copper selenide and polyvinylpyrrolidone proves the hexagonal structure of CuSe/PVP. Peaks in the following figure were also confirmed with JCPDS card no. 00-006-04.23The diffraction peaks shown above at 2θ (Bragg's angle) are 28.37°, 31.37°, 45.38°, 53.39°, 66.26° and 75.42° are very similar with standardized JCPDS card no. 00-006-0427. Their planes are (1 0 2), (0 0 6), (1 0 7), (2 0 1), (2 0 7) and (2 1 3) respectively. But, in literature24 the planes are slightly different. This is due to the presence of polymer. In Fig. 1, peak at 22.51° shows the presence of PVP. Similar peak of PVP is observed in pure PVP graph.25 Peak at 31.37° indicated the highest diffraction intensity of CuSe with their desired orientation along (0 0 6) direction. This highest peak is also observed in the synthesis of CuSe nano-powder.17 The hexagonal phase structure of CuSe/PVP has the low coordinate geometry which may enhance the electrocatalytic property as previously been observed in other metal-selenide electrocatalysis.26
Grain size of CuSe/PVP is 6.586 nm. The grain size of CuSe as deposited thin films is greater grain size than CuSe/PVP powder. Moreover, CuSe thin films annealed at different temperature changes its grain size as illustrated earlier.27,28 As FWHM increases, the interplanar spacing also increases. Moreover, the dislocation density decreases as the crystal size increases. Lattice parameters a, c and unit volume of CuSe/PVP composite is shown in the following Table 1. It is almost similar to JCPDS card no. 00-006-042.
| Lattice parameters | CuSe/PVP | CuSe (JCPDS card) |
|---|---|---|
| a (Å) | 3.96 | 3.94 |
| c (Å) | 17.18 | 17.25 |
| Volume | 233.69 | 231.91 |
3.2. FTIR spectrum analysis
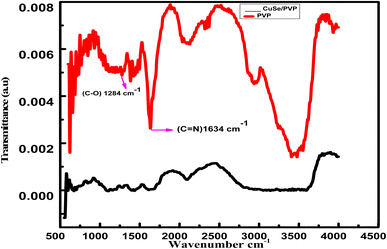
Stretching at 1284 cm−1 shows C–O bond that confirms the presence of PVP in the sample. Another stretching at 1634 cm−1 shows C![[double bond, length as m-dash]](https://www.rsc.org/images/entities/char_e001.gif) N bonding which also confirms the presence of PVP in sample. Almost same peaks were observed in the polyvinylpyrrolidone capped gold nanoparticles as a function of pH.29 Presence of CuSe has been indicated at 823 cm−1. Our results correlate well to another report,30 where two-stage synthesis and characterization of CuSe/PVP nanocomposite thin films also confirmed the peaks of CuSe. This FTIR verified the presence of PVP in the compound at a prominent peak 1284 cm−1. The shift from 1290 cm−1 to 1284 cm−1 and 1660 cm−1 to 1634 cm−1 is due to the strong interaction of copper selenide with PVP. These results clearly confirm the formation of CuSe/PVP composite (Fig. 2).
N bonding which also confirms the presence of PVP in sample. Almost same peaks were observed in the polyvinylpyrrolidone capped gold nanoparticles as a function of pH.29 Presence of CuSe has been indicated at 823 cm−1. Our results correlate well to another report,30 where two-stage synthesis and characterization of CuSe/PVP nanocomposite thin films also confirmed the peaks of CuSe. This FTIR verified the presence of PVP in the compound at a prominent peak 1284 cm−1. The shift from 1290 cm−1 to 1284 cm−1 and 1660 cm−1 to 1634 cm−1 is due to the strong interaction of copper selenide with PVP. These results clearly confirm the formation of CuSe/PVP composite (Fig. 2).
3.3. UV/visible spectroscopy
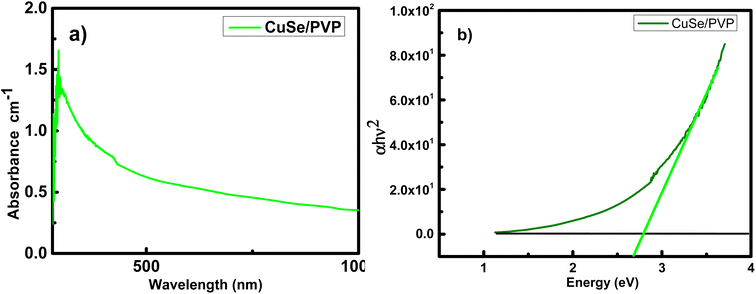
UV/vis spectroscopy of CuSe/PVP synthesized by sol–gel method can easily be calculated. The absorption spectrum of as prepared CuSe/PVP composite is shown is the Fig. 3a. The broad absorption edge is present in the range of 500–800 nm. It is reported that,31 copper selenide thin films deposited by chemical bath deposition also observed the similar range. With the help of Tauc plot method, we have following relation;| (hν − Eg)n = αhν | (1) |
Photon energy is denoted by;
| hc/λ = hν | (2) |
| hν = 1240/wavelength | (3) |
By the help of these equations, we can easily find out the band gap energy of the prepared sample.
It is determined from Fig. 3b that CuSe/PVP shows the value of band gap at 2.7 eV. It has been reported earlier that CuSe has band gaps at 2.4 eV and 2.5 eV.31 It is also observed in ref. 32 that the CuSe thin films shows the band gap energy at 2.4 eV. Band gap energies at 1.7 eV, 2.01 eV and 2.8 eV are also reported in ref. 33 and 34. Ranging from 1.5 to 3 eV in the reference report depicts the presence of CuSe in composite. This confirms the improved crystal structure of the confined nanocomposite.35
3.4. SEM and EDS of CuSe/PVP
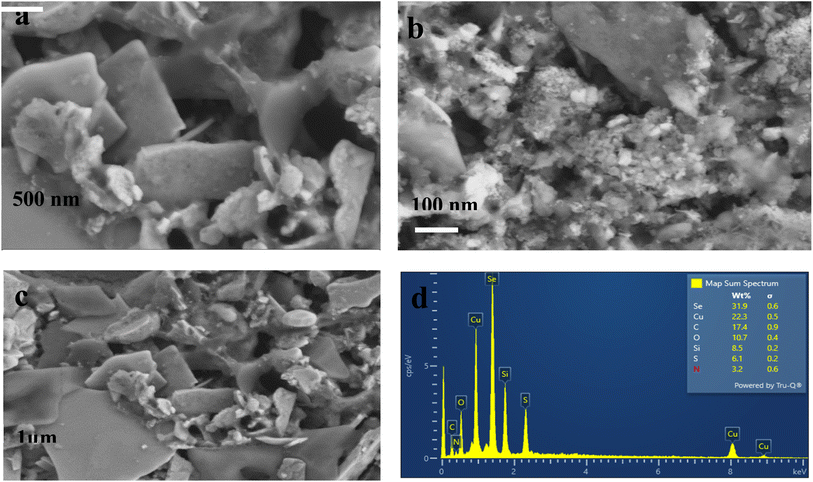
SEM images of CuSe/PVP have been obtained at different magnifications. SEM measurements have shown that CuSe/PVP nanoflakes-like morphology are in agreement with reported literature.17 Nano-flakes in any nanocomposite or nanomaterial offers high surface area for the absorption of analytes. Fig. 4a shows nano-flakes having thickness of 50 nm. The thickness of a single flake is less than 100 nm as shown in Fig. 4a which is an agreement with reported literature.35 It is a compact structure that is composed of small, closely packed and well-defined microcrystals that are visible in Fig. 4b.27 In Fig. 4c, there are many small particles and pores that are formed due to the low nucleation of the crystal's growth rate. SEM of CuSe/PVP confirms that nanocomposite is well organized and dispersed. This nanocomposite with higher surface area can be efficient for the absorption of glucose regarding biosensing. EDS of CuSe/PVP has validated the presence of copper and selenium in the composite. The atomic percentage of Cu and Se elements is 22.3% and 31.9% respectively. Fig. 4d confirms the presence of PVP in nanocomposite as carbon, nitrogen and oxygen are present with atomic percentage of carbon 17.4%, oxygen is 10.7% and nitrogen was 3.2%.24 Fig. 5 shows the uniform distribution of Cu and Se in the nanocomposite in an elemental mapping.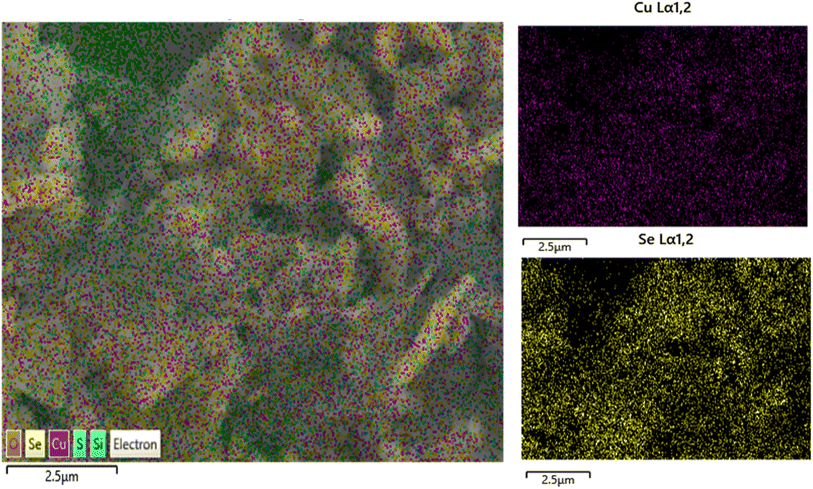 | ||
| Fig. 5 Shows EDS elemental mapping of images of CuSe/PVP nanocomposite, showing a uniform distribution of Cu and Se in the nanocomposite. | ||
3.5. XPS analysis of CuSe/PVP nanocomposite
High-resolution XPS scans of Cu 2p and Se 3d core level are depicted in Fig. 6a–d. Cu 2p3/2 peak is deconvoluted into two peaks leveled at 932.20 eV and 933.75 eV, which corresponds to Cu2O and CuO respectively. The major component is copper in the form of Cu2+ states. These values are in good agreement with literature 36 and 37. Se 3d spectra is dissolved into two peaks separated by ΔE = 0.8 eV due to spin orbit coupling. The first peak is attributed to Se 3d5/2 positioned at 59.4 eV correspond to selenium in divalent form. Two prominent peaks at 930 and 950 eV depict Cu p3/2 and Cu p1/2 respectively. These peaks are representation of Cu(I) state in the nanocomposite. While other peaks around 940 and 960 eV respectively were evident for Cu(II) state in nanocomposite see Fig. 6. This clearly demonstrates that Cu two p states form a heterojunction which helps in glucose sensing characteristics enhancement. Presence of C 1s at 288 and 284 eV (6c) and O 1s at 530 eV (6d) presence of these peaks is a confirmation of bonding between Cu and PVP in this nanocomposite. Cu in this nanocomposite exists in both ionic states as evident from their peaks. Although Cu in its Cu(I) form exhibits 3d10 configuration which should be more stable than Cu(II), but the hydration energy of later is more −ive than former, which compensates for ionization energy values as well.36,37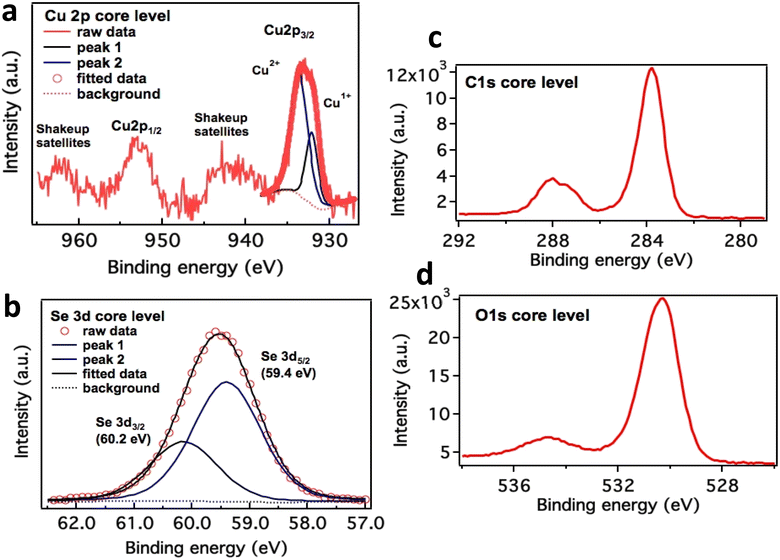 | ||
| Fig. 6 Cu 2p core-level XPS spectrum in CuSe/PVP (a) and Se XPS analysis in CuSe/PVP (b). Presence of C 1s at 288 and 284 eV (c) and O 1s at 530 eV (d). | ||
3.6. Results of antibacterial activity
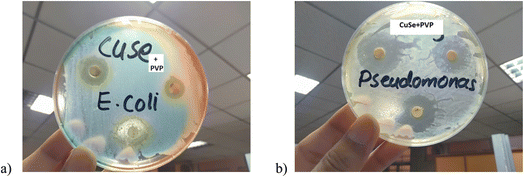
This activity was performed against E. coli which is a Gram-negative bacterium. Mead et al.38 estimated, in 1999 that this organism was accountable for about 73![[thin space (1/6-em)]](https://www.rsc.org/images/entities/char_2009.gif) 000 human illness cases and 61 deaths each year in United States of America. Pseudomonas aeruginosa is a Gram-negative, rod shape bacteria that oxidize positively belongs to the family Pseudomonadaceae. Recent studies have shown that Pseudomonas is an antibiotic resistant bacterium. Zone of inhibition shows the effect of CuSe/PVP at different concentrations. It can be clearly seen that the composite has shown more phenomenal results as the concentration of composite increases. Among three concentrations (20, 30, 50 μg ml−1) of the composite, antibacterial effect of 50 μg ml−1 of CuSe/PVP against Gram negative E. coli has shown more inhibition zone (18 mm) than the other two concentrations (Fig. 7a). The antibacterial effect of 50 μg ml−1 of CuSe/PVP against Gram negative Pseudomonas has shown higher inhibition zone (26 mm) than the other two concentrations (Fig. 7b). It is also observed that the zone of inhibition of CuSe/PVP is higher in Pseudomonas (Gram negative) than E. coli. According to the disk diffusion method, it was proposed that by increasing the concentration of the nanocomposite, inhibition zone also increases for both E. coli and Pseudomonas as shown in the Table 2. From this study, it was also observed that Pseudomonas is more susceptible to CuSe/PVP than E. coli bacteria.
000 human illness cases and 61 deaths each year in United States of America. Pseudomonas aeruginosa is a Gram-negative, rod shape bacteria that oxidize positively belongs to the family Pseudomonadaceae. Recent studies have shown that Pseudomonas is an antibiotic resistant bacterium. Zone of inhibition shows the effect of CuSe/PVP at different concentrations. It can be clearly seen that the composite has shown more phenomenal results as the concentration of composite increases. Among three concentrations (20, 30, 50 μg ml−1) of the composite, antibacterial effect of 50 μg ml−1 of CuSe/PVP against Gram negative E. coli has shown more inhibition zone (18 mm) than the other two concentrations (Fig. 7a). The antibacterial effect of 50 μg ml−1 of CuSe/PVP against Gram negative Pseudomonas has shown higher inhibition zone (26 mm) than the other two concentrations (Fig. 7b). It is also observed that the zone of inhibition of CuSe/PVP is higher in Pseudomonas (Gram negative) than E. coli. According to the disk diffusion method, it was proposed that by increasing the concentration of the nanocomposite, inhibition zone also increases for both E. coli and Pseudomonas as shown in the Table 2. From this study, it was also observed that Pseudomonas is more susceptible to CuSe/PVP than E. coli bacteria.
| Sr. no. | Sample | Bacteria | Concentration of sample (μg ml−1) | Zone of inhabitation (mm) | References |
|---|---|---|---|---|---|
| 1 | CuS/PVA/CS | Pseudomonas | 20![[thin space (1/6-em)]](https://www.rsc.org/images/entities/char_2009.gif) 000 000 |
18 | 39 |
| 2 | CuSe | Pseudomonas | 60 | 12 | 40 |
| 3 | CuS | Pseudomonas | 40 | 12 | 41 |
| 4 | CuO | Pseudomonas | 40 | 26 | 41 |
| 5 | CuSe | Enterococcus faecalis | 160 | 12 | 42 |
| 6 | CuSe | E. coli | 310 | 14 | 42 |
| 7 | PVP-B | E. coli | — | 2.4 | 43 |
| 7 | CuSe/PVP | E. coli | 20 | 11 | This work |
| 8 | CuSe/PVP | E. coli | 30 | 14 | This work |
| 9 | CuSe/PVP | E. coli | 50 | 18 | This work |
| 10 | CuSe/PVP | Pseudomonas | 20 | 19 | This work |
| 11 | CuSe/PVP | Pseudomonas | 30 | 22 | This work |
| 12 | CuSe/PVP | Pseudomonas | 50 | 26 | This work |
It has also been reported in ref. 42 that copper selenide shows low antibacterial activity against micro-organisms. This could be the reason of its limited antimicrobial study. Additionally, due to the presence of polyvinyl pyrrolidone (PVP) in this composite, both bacteria become highly sensitive to the composite. Large inhibition zone confirmed that the antibacterial nature of nanocomposite. Hence, it is elucidated that due to the presence of a polymer, antibacterial activity of a composite would be enhanced. Copper has ability to produce Cu2+ ion that can easily penetrate and disrupt the cell membrane.41–43 PVP makes the outer membrane more hydrophilic resulting in the disruption of membrane rapidly. PVP helps Cu to damage the cell membrane of Gram-negative bacteria very quickly.44 Minimum inhibitory concentration (MIC) of CuSe/PVP is 10 μg ml−1 for both bacterial strains. It is the minimum concentration of the prepared sample that was required to inhibit the growth of bacteria. Minimum inhibition zones for E. coli and Pseudomonas are 3 mm and 5 mm respectively.
3.7. Electrochemical glucose biosensing
Electrochemical measurements were carried out in a three electrode cell, with Ag/AgCl as reference, platinum wire as counter and glassy carbon (GCE) as working electrodes respectively. 0.1 M NaOH was used as an electrolyte and the potential window was swept between 0.5 and 1.5 V for different experiments.45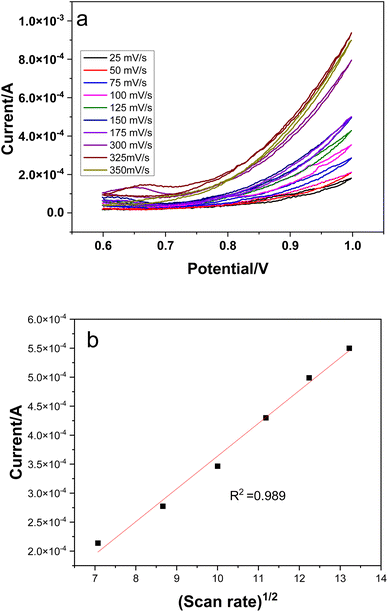 | ||
| Fig. 8 Scan rate effect on electrochemical response of CuSe/PVP nanocomposite (a), linear regression of scan rate (b). | ||
The Randles–Sevcik equation allows for the estimation of the diffusion coefficient. Equation is given as follows;
| Ip = (2.69 × 10⁵)n3/2α1/2ACD1/2ν1/2 | (4) |
Diffusion coefficients were calculated using the slope of the linear regression curves from Fig. 8b and were found to be 7.65 × 10⁻⁵ cm2 which shows fast electron transfer kinetics.
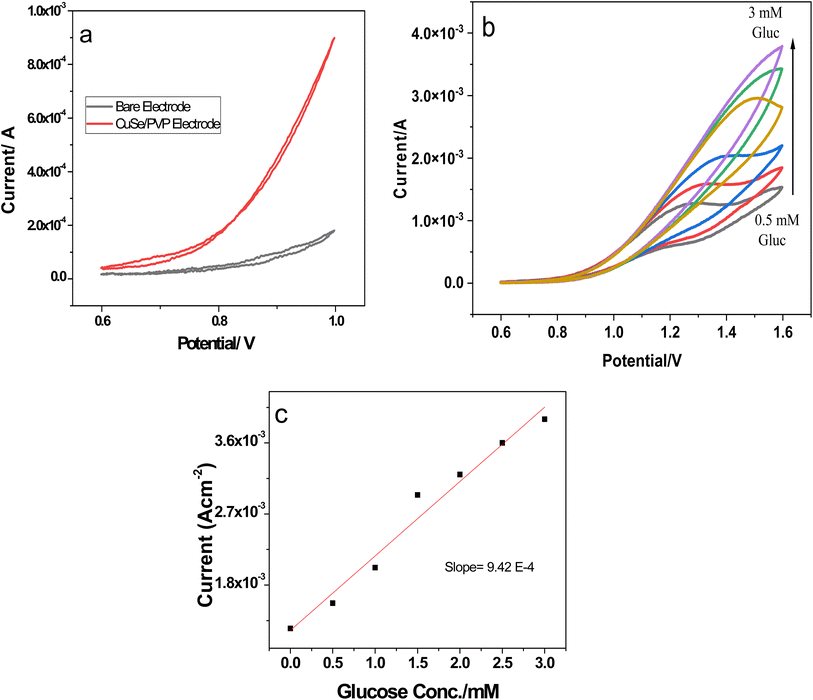
A wide linear range of glucose concentration was analyzed by the nanocomposite i.e., 0.5 mM−3 mM see Fig. 9b. This range is critical for pre-diabetic and diabetic patients. Our investigated sensor nanocomposite is active in this critical range with a response time less than 5 s. Sensitivity was evaluated by linear regression of conc. vs. current density response as shown in Fig. 9c. Slope of the linear regression is represented by m and is the sensitivity while, LOD was calculated as follows;
| LOD = 3SD/m | (5) |
![[thin space (1/6-em)]](https://www.rsc.org/images/entities/char_2009.gif) 450 μA mM−1 cm−2 and the LOD was as 0.223 μA. These values show that sensor is ultrasensitive with very low LOD values as compared to most of the reported literature.48–50 A comprehensive comparison is given in Table 3.
450 μA mM−1 cm−2 and the LOD was as 0.223 μA. These values show that sensor is ultrasensitive with very low LOD values as compared to most of the reported literature.48–50 A comprehensive comparison is given in Table 3.
| Nanocomposite | Sensitivity (μA mM−1 cm−2) | LOD (μM) | References |
|---|---|---|---|
| CuSe | 19![[thin space (1/6-em)]](https://www.rsc.org/images/entities/char_2009.gif) 140 140 |
0.196 | 17 |
| CuS/RGO/CuS/Cu | 22![[thin space (1/6-em)]](https://www.rsc.org/images/entities/char_2009.gif) 670 670 |
0.5 | 52 |
| CuO/NiO/PANI/GCE | 3402 | 2 | 53 |
| CuO/rGO/CNT | 9278 | 1 | 54 |
| SiO2/C/CuO | 472 | 0.06 | 55 |
| Cu2–xSe | 536 | 50 | 56 |
| Cu2Se | 18![[thin space (1/6-em)]](https://www.rsc.org/images/entities/char_2009.gif) 660 660 |
25 | 57 |
| CuO | 627 | 0.2 | 58 |
| Cu3Se2 | 18![[thin space (1/6-em)]](https://www.rsc.org/images/entities/char_2009.gif) 500 500 |
2.8 | 59 |
| NGA–CuO | 233 | 2.7 | 60 |
| Bi2Se3 | 0.112 | 6.1 | 61 |
| CuSe/PVP | 13![[thin space (1/6-em)]](https://www.rsc.org/images/entities/char_2009.gif) 450 μA 450 μA |
0.223 | This work |
| Cu(II) + 2OH− → Cu(III)OOH + e− + H2O | (6) |
| Cu(III)OOH + glucose → gluconolactone + Cu(II) | (7) |
4. Conclusion
CuSe/PVP was synthesized by a well-documented sol gel method. XRD analysis indicated crystalline nature of materials and average crystal size was 6.58 nm. FTIR spectra displayed the occurrence of CuSe bonding at 823 cm−1. It shows the existence of PVP at 1284 cm−1 and 1635 cm−1. UV/vis spectra showed absorbance above 400 nm. It shows band gap at 2.7 eV. Antibacterial activity shows that inhibition zone increases as the concentration of CuSe/PVP increases. The biggest inhibition zone is 26 mm for Gram negative Pseudomonas at the concentration of 50 μg ml−1 of CuSe/PVP. The electrodeposited CuSe/PVP indicate high-level sensitivity and super efficiency for monitoring oxidation of glucose having sensitivity of 13![[thin space (1/6-em)]](https://www.rsc.org/images/entities/char_2009.gif) 450 μA mM−1 cm−2, limit of detection of 0.223 μM and a linear range of 0.5 mM to 3 Mm, stability of long time and exceptional selectivity displayed by chronoamperometry amid ascorbic acid, as interferent. All of these results disclose excellent potential of electrodeposited CuSe/PVP on the electrode operating highly-productive, competent and economical glucose biosensor appropriate for practical applications.
450 μA mM−1 cm−2, limit of detection of 0.223 μM and a linear range of 0.5 mM to 3 Mm, stability of long time and exceptional selectivity displayed by chronoamperometry amid ascorbic acid, as interferent. All of these results disclose excellent potential of electrodeposited CuSe/PVP on the electrode operating highly-productive, competent and economical glucose biosensor appropriate for practical applications.
Conflicts of interest
There are no conflicts to declare.Acknowledgements
Authors would like to acknowledge the Islamia University of Bahawalpur Pakistan and National Center for Physics (NCP), Islamabad, Pakistan for financial and technical assistance.References
- K. M. Bullard, C. C. Cowie, S. E. Lessem, S. H. Saydah, A. Menke, L. S. Geiss, T. J. Orchard, D. B. Rolka and G. Imperatore, Morb. Mortal. Wkly. Rep., 2018, 67, 359–361 CrossRef PubMed.
- A. L. Galant, R. C. Kaufman and J. D. Wilson, Food Chem., 2015, 188, 149–160 CrossRef CAS PubMed.
- A. T. Kharroubi and H. M. Darwish, World J. Diabetes, 2015, 6, 850–867 CrossRef PubMed.
- A. Stokes and S. H. Preston, PLoS One, 2017, 12, 117–219 Search PubMed.
- G. Rocchitta, A. Spanu, S. Babudieri, G. Latte, G. Madeddu, G. Galleri, S. Nuvoli, P. Bagella, M. I. Demartis, V. Fiore, R. Manetti and P. A. Serra, Sensors, 2016, 16, 780 CrossRef PubMed.
- R. Gaia, S. Angela, B. Sergio, L. Gavinella, M. Giordano, G. Grazia, N. Susanna, B. Paola, D. Maria Ilaria, F. Vito, M. Roberto and S. Pier Andrea, Sensors, 2016, 16, 780 CrossRef PubMed.
- R. Wilson and A. P. F. Turner, Biosens. Bioelectron., 1992, 7, 165–185 CrossRef CAS.
- A. A. Saei, J. E. N. Dolatabadi, P. Najafi-Marandi, A. Abhari and M. de la Guardia, TrAC, Trends Anal. Chem., 2013, 42, 216–227 CrossRef CAS.
- J. Luo, S. Jiang, H. Zhang, J. Jiang and X. Liu, Anal. Chim. Acta, 2012, 709, 47–53 CrossRef CAS PubMed.
- H.-X. Wu, W.-M. Cao, Y. Li, G. Liu, Y. Wen, H.-F. Yang and S.-P. Yang, Electrochim. Acta, 2010, 55, 3734–3740 CrossRef CAS.
- Z. Zhu, L. Garcia-Gancedo, A. J. Flewitt, H. Xie, F. Moussy and W. I. Milne, Sensors, 2012, 5996–6022 CrossRef PubMed.
- T. Chen, D. Liu, W. Lu, K. Wang, G. Du, A. M. Asiri and X. Sun, Anal. Chem., 2016, 88, 7885–7889 CrossRef CAS PubMed.
- P. K. Kannan and C. S. Rout, Chem, 2015, 21, 9355–9359 CrossRef CAS PubMed.
- K. Ramachandran, T. Raj kumar, K. J. Babu and G. Gnana Kumar, Sci. Rep., 2016, 6, 36583 CrossRef CAS PubMed.
- J. Yang, X. Liang, L. Cui, H. Liu, J. Xie and W. Liu, Biosens. Bioelectron., 2016, 80, 171–174 CrossRef CAS PubMed.
- M. Ranjani, Y. Sathishkumar, Y. S. Lee, D. Jin Yoo, A. R. Kim and G. Gnana Kumar, RSC Adv., 2015, 5, 57804–57814 RSC.
- S. Umapathi, H. Singh, J. Masud and M. Nath, Mater. Adv., 2021, 2, 927–932 RSC.
- J. Masud, W. P. R. Liyanage, X. Cao, A. Saxena and M. Nath, ACS Appl. Energy Mater., 2018, 1, 4075–4083 CrossRef CAS.
- Y. Wang, S. Liu, Y. Lai, Y. Zhu, R. Guo, Y. Xia, W. Huang and Z. Li, Sens. Actuators, B, 2018, 262, 801–809 CrossRef CAS.
- W. Zhu, J. Wang, W. Zhang, N. Hu, J. Wang, L. Huang, R. Wang, Y. Suo and J. Wang, J. Mater. Chem. B, 2018, 6, 718–724 RSC.
- X. Hao, J. Jia, Y. Chang, M. Jia and Z. Wen, Electrochim. Acta, 2019, 327, 135020 CrossRef CAS.
- N. G. Mbewana-Ntshanka, M. J. Moloto and P. K. Mubiayi, J. Nanotechnol., 2021, 18, 1–4 Search PubMed.
- X. Li, M. Chen, R. Rui, Z. Wan, F. Chen, X. Zuo, C. Wang and H. Wu, Int. J. Electrochem., 2019, 14, 4327–4337 CrossRef CAS.
- K. Kaviyarasu, A. Ayeshamariam, E. Manikandan, J. Kennedy, R. Ladchumananandasivam, U. U. Gomes, M. Jayachandran and M. Maaza, J. Mater. Sci. Eng. B, 2016, 210, 1–9 CrossRef CAS.
- S. Thirumavalavan, K. Mani and S. Sagadevan, Mater. Res., 2015, 18, 1000–1007 CrossRef CAS.
- W. El Hotaby, H. Sherif, B. Hemdan, W. Khalil and S. Khalil, Acta Phys. Pol., A, 2017, 131, 1554–1560 CrossRef CAS.
- J. Masud, P. C. Ioannou, N. Levesanos, P. Kyritsis and M. Nath, ChemSusChem, 2016, 9, 3128–3132 CrossRef CAS PubMed.
- V. M. Bhuse, P. P. Hankare, K. M. Garadkar and A. S. Khomane, Mater. Chem. Phys., 2003, 80, 82–88 CrossRef CAS.
- R. Seoudi, M. M. Elokr, A. A. Shabaka and A. Sobhi, Eurasian Chem.-Technol. J., 2008, 10, 25–30 CAS.
- V. A. Dhumale, R. K. Gangwar, S. S. Datar and R. B. Sharma, Mater. Express, 2012, 2, 311–318 CrossRef CAS.
- Y. E. Firat and A. H. Peksoz, J. Alloys Compd., 2017, 727, 177–184 CrossRef CAS.
- S. Thirumavalavan, K. Mani and S. Sagadevan, Mater. Res., 2015, 18, 1000–1007 CrossRef CAS.
- M. Petrović, M. Gilic, J. Ćirković, M. Romčević, N. Romčević, J. Trajic and I. Yahia, Sci. Sintering, 2017, 49, 167–174 CrossRef.
- A. B. Islam and A. H. Bhuiyan, J. Mater. Sci.: Mater. Electron., 2005, 16, 263–268 CrossRef.
- K. Liu, H. Liu, J. Wang and L. Shi, J. Alloys Compd., 2009, 484, 674–676 CrossRef CAS.
- L. Zhu, Y. Zhao, W. Zheng, N. Ba, G. Zhang, J. Zhang, X. Li, H. Xie and L. Bie, CrystEngComm, 2016, 18, 5202–5208 RSC.
- A. Waskowska, L. Gerward, J. S. Olsen, S. Steenstrup and E. Talik, Condens. Matter Phys., 2001, 13, 2549 CrossRef CAS.
- P. S. Mead, I. Slutsker, V. Dietz, I. F. McCaig, J. S. Bresee and C. Shapiro, Emerging Infect. Dis., 1999, 5, 607 CrossRef CAS PubMed.
- G. Wang and A. Fakhri, Int. J. Biol. Macromol., 2020, 155, 36–41 CrossRef CAS PubMed.
- K. Vimala, M. M. Yallapu, K. Varaprasad, N. N. Reddy, S. Ravindra, N. S. Naidu and K. M. Raju, J. Biomater. Nanobiotechnol., 2011, 2, 55 CrossRef CAS.
- N. G. Mbewana-Ntshanka, M. J. Moloto and P. K. Mubiayi, J. Nanotechnol., 2021, 1–4 Search PubMed.
- R. Ghelich, M. R. Jahannama, H. Abdizadeh, F. S. Torknik and M. R. Vaezi, Polym. Bull., 2022, 79, 5885–5899 CrossRef CAS.
- (a) T. P. Mofokeng, M. J. Moloto, P. M. Shumbula, P. Nyamukamba, P. K. Mubiayi, S. Takaidza and L. Marais, J. Nanotechnol., 2018, 9, 1–4 Search PubMed; (b) Y. Abboud, T. Saffaj, A. Chagraoui, A. El Bouari, K. Brouzi, O. Tanane and B. Ihssane, Appl. Nanosci., 2014, 4, 571–576 CrossRef CAS.
- H. Basri, A. F. Ismail and M. Aziz, Desalination, 2011, 273, 72–80 CrossRef CAS.
- A. Raziq, M. Tariq, R. Hussian, M. H. Mehmood, M. S. Khan and A. Hassan, ChemistrySelect, 2017, 2, 9711–9717 CrossRef CAS.
- E. Laviron, J. Electroanal. Chem. Interfacial Electrochem., 1974, 52, 355–393 CrossRef CAS.
- A. A. Alshaheri, M. I. Tahir, M. B. Rahman, T. Begum and T. A. Saleh, J. Mol. Liq., 2017, 240, 486–496 CrossRef CAS.
- H. Singh, J. Bernabe, J. Chern and M. Nath, J. Mater. Res., 2021, 36, 1413–1424 CrossRef CAS.
- F. Liaqat, I. ul Haq, F. Saira and S. Qaisar, Mater. Sci. Eng., B, 2023, 289, 116231 CrossRef CAS.
- F. Saira, A. Yaqub, H. Razzaq, M. G. Sohail, S. Saleemi, M. Mumtaz, M. A. Rafiq and S. Qaisar, J. Mol. Struct., 2022, 1268, 133646 CrossRef CAS.
- F. Saira, H. Razzaq, M. Mumtaz, S. Ahmad, M. A. Rafiq, A. Yaqub, N. Dilshad and A. Ihsan, Karbala International Journal of Modern Science, 2020, 6, 1–10 CrossRef.
- C. Zhao, X. Wu, X. Zhang, P. Li and X. Qian, J. Electroanal. Chem., 2017, 785, 172–179 CrossRef CAS.
- K. Ghanbari and Z. Babaei, Anal. Biochem., 2016, 498, 37–46 CrossRef CAS PubMed.
- C. Lee, S. H. Lee, M. Cho and Y. Lee, Mikrochim. Acta, 2016, 83, 3285–3292 CrossRef.
- A. Rahim, Z. U. Rehman, S. Mir, N. Muhammad, F. Rehman, M. H. Nawaz, M. Yaqub, S. A. Siddiqi and A. A. Chaudhry, J. Mol. Liq., 2017, 248, 425–431 CrossRef CAS.
- X. Hao, J. Jia, Y. Chang, M. Jia and Z. Wen, Electrochim. Acta, 2019, 327, 135020 CrossRef CAS.
- W. Zhu, J. Wang, W. Zhang, N. Hu, L. Huang, R. Wang and J. Wang, J. Mater. Chem. B, 2018, 6, 718–724 RSC.
- M. S. Jagadeesan, K. Movlaee, T. Krishnakumar, S. G. Leonardi and G. Neri, J. Electroanal. Chem., 2019, 835, 161–168 CrossRef CAS.
- D. B. Malavekar, S. B. Jadhav, S. B. Kale, U. M. Patil and C. D. Lokhande, Materials Today Sustainability, 2022, 20, 100215 CrossRef.
- J. Yang, W. Tan, C. Chen, Y. Tao, Y. Qin and Y. Kong, Mater. Sci. Eng., 2017, 78, 210–217 CrossRef CAS PubMed.
- A. D. Savariraj, V. Vinoth, R. V. Mangalaraja, T. Arun, D. Contreras, A. Akbari-Fakhrabadi, H. Valdés and F. Banat, J. Electroanal. Chem., 2020, 856, 113629 CrossRef CAS.
| This journal is © The Royal Society of Chemistry 2023 |

