 Open Access Article
Effect of glucose pretreatment on Cu–ZnO–Al2O3 catalyzed CO2 hydrogenation to methanol
Xiuyun Jiangad,
Wenbing Yanga,
Hao Songa,
Jucang Kea,
Peng Lia,
Rui Lib,
Qingxiang Ma*a,
Jian Sun *c,
Tian-Sheng Zhao
 a and
Noritatsu Tsubaki
 d
d
aState Key Laboratory of High-efficiency Utilization of Coal and Green Chemical Engineering, School of Chemistry and Chemical Engineering, Ningxia University, Yinchuan 750021, Ningxia, P. R. China. E-mail: maqx@nxu.edu.cn
bAnalysis and Testing Centre of Ningxia University, Yinchuan 750021, Ningxia, P. R. China
cDalian National Laboratory for Clean Energy, Dalian Institute of Chemical Physics, Chinese Academy of Sciences, Dalian 116023, P. R. China. E-mail: sunj@dicp.ac.cn
dDepartment of Applied Chemistry, School of Engineering, University of Toyama, Gofuku 3190, Toyama 930-8555, Japan
First published on 25th July 2023
Abstract
A series of Cu–ZnO–Al2O3 catalysts (CZA) were prepared by glucose pretreatment and applied for methanol synthesis from CO2 hydrogenation. The advantages of the glucose pretreatment and the effects of glucose content were investigated by XRD, N2 physisorption, SEM, N2O chemisorption, CO2-TPD, H2-TPR, TG, and XPS characterization techniques. The influence of glucose pretreatment on the average Cu particle size and the interaction between different components, as well as the effects of the amount of glucose on the Cu specific surface area, the ratio of Cu0/Cu+ and the performance of the catalysts were discussed. The results showed that the catalysts prepared by glucose pretreatment increased the number of basic sites and had a significant advantage in methanol yield. The optimum content of glucose was beneficial to improve the catalytic performance of the CZA catalyst. The maximum space-time yield of methanol was obtained by 2 wt% glucose pretreatments at 200 °C, which was 57.0 g kg−1 h−1.
1 Introduction
With the massive emission of greenhouse gases causing global warming, this has led to increasing frequency of extreme weather such as floods, typhoons and droughts.1,2 Due to CO2 accounting for 77% of the total greenhouse gas emissions, there is an urgent need to reduce the concentration of CO2 in the atmosphere by various means.3,4 As a potential carbon resource, catalytic conversion and utilization of CO2 is one of the effective ways to reduce CO2 concentration, which has attracted widespread attention.5,6 Among them, the catalytic hydrogenation of CO2 to methanol is of great significance, because methanol can not only be used as a clean fuel and substitute for fossil fuels, but also as an important basic raw material for the organic chemical industry such as the synthesis of chemicals with higher added value including olefins and aromatic hydrocarbons through reactions of methanol to olefin transformation (MTO reaction) and methanol to aromatics transformation (MTA reaction).7–9 However, due to the high oxidation state and thermodynamic stability of CO2, it is difficult to use CO2 as a feedstock to produce methanol for the industry because of the realization of this process requires a large amount of energy to activate CO2.10,11 Therefore, high-performance catalysts for activating and converting CO2 to methanol are constantly being studied.At present, most of the catalysts used for hydrogenation of CO2 to methanol are modified on the CuZnAl system.12,13 Since the hydrogenation of CO2 to methanol is an exothermic reaction, the thermodynamic equilibrium limitation in the reaction process can lead to the increase of CO2 conversion, which is always accompanied the serious decrease of methanol selectivity.14 In order to improve the catalytic performance of the catalyst in the hydrogenation of CO2 to methanol, researchers studied numerous methods such as changing the support including ZrO2,15 CeO2,16 SiO2 (ref. 17) and adding a variety of additives or other active metals including Ga, Fe,18 Mn, La, Ce, Zr, Y,19 Pd,20 Au,21 which can affect the size of catalyst particles, the surface metal distribution, the active sites and the support interaction so as to improve the activity of the catalyst.22 In addition, different preparation methods such as co-precipitation method,23 impregnation method,24 fuel-assisted metal precursor combustion method25 also have a great impact on the activity of the catalysts. For the past few years, Cu species (Cu+/Cu0) as active sites of Cu-based catalysts for catalyzing the hydrogenation of CO2 to methanol has attracted extensive attention from researchers, and various pretreatment methods to prepare Cu-based catalysts have been widely explored. Hou et al.26 prepared CuZnAlZr catalyst using formaldehyde as a reducing agent, which can convert Cu2+ into Cu+ in the catalyst and change the interaction between the catalyst components, and improve the catalytic performance of the catalyst. Lü et al.27 prepared the Cu/ZnO catalyst by citric acid assisted solid-phase grinding method. Under the preparation conditions of C2H8O7/(Cu + Zn) molar ratio of 1.2/1, the Cu particles were uniformly dispersed and the particle size was small in the catalyst, which lead an optimal activity for the methanol synthesis. Recently, a method of preparing nanomaterials such as Cu,28 Ag,29 and Cu2O30 by glucose reduction has been proposed, which is considered economical, fast and easy to operate compared with traditional gas reduction. Song et al.31 by reducing Cu(II) to ultra-fine Cu2O, showed that the amount of glucose can optimize the particle size of Cu2O. Cao32 studied the preparation of Cu2O by glucose reduction method and found that glucose reduction has an important effect on the morphology, particle size and dispersion of Cu2O. At present, the preparation of Cu–ZnO–Al2O3 catalysts using glucose as reducing agent has not been reported.
Therefore, in this paper, the Cu–ZnO–Al2O3 catalysts were prepared by a simple and controllable solid-phase grinding method using to mix glucose with the precursor of Cu/Zn/Al catalyst and the reduction pretreatment carrying out through the calcined process. The effect of the amount of glucose on the physicochemical structure of the catalyst and the catalytic performance of CO2 hydrogenation to methanol were also discussed.
2 Experimental section
2.1 Materials
We purchased copper nitrate trihydrate (Cu(NO3)2·3H2O, A.R), zinc nitrate hexahydrate (Zn(NO3)2·6H2O, A.R), aluminum nitrate nonahydrate (Al(NO3)3·9H2O, A.R), sodium carbonate (Na2CO3, A.R), glucose (C6H12O6, A.R) from Sinopharm Chemical Reagent Co., Ltd. The reagents were used as supplied.Catalyst precursor was prepared by a co-precipitation method: typically, 19.3280 g of Cu(NO3)2·3H2O, 11.9002 g of Zn(NO3)2·6H2O and 6.0021 g Al(NO3)3·9H2O were dissolved in deionized water to make a metal salts solution with a concentration of 1.0 mol L−1 (molar ratio Cu/Zn/Al = 10![[thin space (1/6-em)]](https://www.rsc.org/images/entities/char_2009.gif) :
:![[thin space (1/6-em)]](https://www.rsc.org/images/entities/char_2009.gif) 5
5![[thin space (1/6-em)]](https://www.rsc.org/images/entities/char_2009.gif) :
:![[thin space (1/6-em)]](https://www.rsc.org/images/entities/char_2009.gif) 2), whereas the precipitant was a 1.0 mol L−1 Na2CO3 solution. The two types of solution were simultaneously dropwise added into 200 mL deionized water under 65 °C of water bath and 900 rpm of vagarous stirring, controlling pH = 7.0 ± 0.1. After precipitation, the catalyst precursor was obtained by stirring aging for 2 h, filtering, washing with deionized water and drying at 80 °C for 12 h. Then the catalyst precursor was mixed with its mass of 0, 2%, 4%, 6%, 8% glucose, respectively, and were thoroughly ground, calcined at 350 °C for 5 h in N2 flow, then passed through N2/O2 = 99/1 passivated gas for 8 h at room temperature, the pretreated Cu–ZnO–Al2O3 catalyst were prepared (denoted as CZA-X%G, X = 0, 2, 4, 6, 8).
2), whereas the precipitant was a 1.0 mol L−1 Na2CO3 solution. The two types of solution were simultaneously dropwise added into 200 mL deionized water under 65 °C of water bath and 900 rpm of vagarous stirring, controlling pH = 7.0 ± 0.1. After precipitation, the catalyst precursor was obtained by stirring aging for 2 h, filtering, washing with deionized water and drying at 80 °C for 12 h. Then the catalyst precursor was mixed with its mass of 0, 2%, 4%, 6%, 8% glucose, respectively, and were thoroughly ground, calcined at 350 °C for 5 h in N2 flow, then passed through N2/O2 = 99/1 passivated gas for 8 h at room temperature, the pretreated Cu–ZnO–Al2O3 catalyst were prepared (denoted as CZA-X%G, X = 0, 2, 4, 6, 8).
2.2 Instrumental measurements
X-ray powder diffraction analysis (XRD) was recorded on the German Bruker D8 Advance X-ray diffraction instrument (40 kV, 40 mA) equipped with the radiation source of Cu Kα ray, and the scanning with a range of 3–85°, a speed of 8°/min and a step width of 0.02° to determine the crystal phase composition of the catalyst.N2 physical adsorption desorption experiment was carried out on the JW-BK122F specific surface and pore size analyzer, and the pore volume, pore size and specific surface area of the catalyst were determined. Prior to the measurements, the samples (0.2 g, 20–40 mesh) were degassed at 300 °C for 2 h, and then measured by static volumetric method at liquid nitrogen temperature (77 K) and partial pressure of nitrogen in the range of 10−8–10−1. The specific surface area was calculated by BET formula, and the pore size distribution was calculated by BJH model.
Scanning electron microscopy (SEM) analysis was performed on the Carl ZEISS EVO18 tungsten filament scanning electron microscope (Germany). Gold was sprayed on the surface of the samples and the operating voltage was 3.0 kV.
Thermogravimetric analysis (TG) was tested on the German NRTZSCH STA449 thermal analyzer, and the sample precursor was heated from room temperature to 800 °C at a rate of 10 °C per min under a nitrogen atmosphere.
X-ray photoelectron spectroscopy (XPS) was studied using the Thermo Fisher Scientific ESCALAB Xi + instrument. Monochromatization Al Kα (1486.8 eV) as the excitation source and C1s peak (284.6 eV) as the reference.
Programmed temperature reduction (H2-TPR), temperature-programmed desorption (CO2-TPD), copper specific surface area, dispersion (N2O titration) were characterized on the Micromerictics automatic temperature-programmed chemisorbent analyzer (AutoChem II.2920) in the United States.
H2-TPR: 0.05 g 20–40 mesh catalyst was placed in a U-shaped quartz tube, heated to 150 °C at a rate of 10 °C per min, purged with 30 mL min−1 He gas for 1 h to clean the catalyst surface, then cooled down to room temperature. Subsequently, the H2/Ar = 1/9 mixture at a flow rate of 30 mL min−1 was introduced and the temperature was heated to 400 °C at a rate of 10 °C per min, and the reduction curve was recorded simultaneously.
CO2-TPD: 0.05 g 20–40 mesh catalyst was placed in U-shaped quartz tube, heated to 400 °C at a rate of 10 °C per min under 30 mL min−1 He flow and then switch to 30 mL min−1 H2/CO2 = 3/1 gas mixture pretreatment catalyst for 1 h. After pretreatment, the temperature was reduced to 50 °C. 10 mL min−1 He flow was used for purging for 1 h, then CO2 gas was switched to surface reaction for 1 h, and finally He gas was switched to purge for 1 h, and the temperature was increased to 300 °C at 10 °C per min. The desorption curve was recorded simultaneously by MS.
N2O titration: 0.05 g 20–40 mesh catalyst was placed in a U-shaped quartz tube, and Ar gas with a flow rate of 30 mL min−1 was fed into the tube and heated to 150 °C at a rate of 10 °C per min. The sample was pretreated for 1 h, then reduced to room temperature, and then switched to H2/Ar = 1/9 mixture with a flow rate of 30 mL min−1. At the rate of 10 °C per min, the temperature was raised to 400 °C and reduced for 1 h. At the end, switched to Ar atmosphere for purging, cooled down to 50 °C, and switch the N2O/Ar = 1/9 for surface reaction for 0.5 h, then the He gas was switched to purging for 2 h. Finally, the H2/Ar = 1/9 mixture with a flow rate of 30 mL min−1 was switched, and the temperature was raised to 400 °C at 10 °C per min, and the curve was recorded synchronously. The reaction equation is as follows:
| CuO + H2 → Cu + H2O | (1) |
| 2Cu + N2O → Cu2O + N2 | (2) |
| Cu2O + H2 → 2Cu + H2O | (3) |
The hydrogen consumption of the reaction of formula (1) and (3) is a and b, μmol g−1, respectively; It can be calculated by eqn (4):
| SCu = 2 × b × Nav/(a × Mcu ×1.4 × 10¹⁹) = 1353 × b/a | (4) |
In eqn (4): SCu represents Cu specific surface area (m2 g−1), Nav represents Avogadro's constant, mol−1; MCu is the molar mass of Cu, g mol; 1.4 × 10¹⁹ is the number of Cu atoms per square meter, m−2.
2.3 Catalytic test
The CO2 hydrogenation activity test of the catalysts were carried out on the multichannel fixed-bed Microreactor, and the reaction tube inner diameter of 8 mm, tube length of 506 mm. 1.0 g 20–40 mesh catalyst sample and 2.0 g 20–40 mesh quartz sand homogeneously mixed and placed in the middle of the reaction tube, fixed with quartz wool, and then filled with sea sand. Among them, the role of sea sand is to make the feed gas evenly distributed before the reaction, the mixing of quartz sand is to prevent the reaction exothermic and make the catalyst sintered, the lower layer of quartz wool plays a bearing role, while avoiding the catalyst being flushed out of the reaction pipe and blocking the lower pipeline, valves, etc. After the catalyst was heated up to the reaction temperature under N2 atmosphere, the feed gas H2/CO2 = 3/1 was introduced to evaluate the activity of the catalyst. The evaluation conditions of the catalyst were as follows: T = 200 °C, P = 3.0 MPa, W/F = 10 g h mol−1, TOS = 48 h. After 10 h of the reaction, the gas phase products were condensed and then processed into gas chromatography with thermal conductivity detector for on-line sampling and analysis, and the sampling interval was 2 h. After the reaction is over, the condensate phase products are collected for off-line analysis.The result calculation used Ar as the internal standard, and the conversion of CO2 and the selectivity of methanol were calculated by the internal standard method as showed below:
Methanol selectivity: SCH3OH = 1 − SCO
Methanol yield: YCH3OH = XCO2 × SCH3OH
Space-time yield of methanol: STYCH3OH = (mL × WCH3OH)/(t × mC)
where Ai represents the peak area of component i, μV s; fi represents the relative correction factor of component i; XCO2 indicates the conversion of CO2, %; Si indicates the selectivity of component i, %; YCH3OH indicates the yield of methanol, %; STYCH3OH represents the space-time yield of methanol g (kg h)−1, where mL is the liquid phase product mass (g), t is the reaction time (h), mC is catalyst mass (g), WCH3OH is the mass fraction of methanol in the liquid phase product.
3 Results and discussions
3.1 Catalyst characterization
Fig. 1(a) shows the XRD spectra of the CZA and CZA-G catalysts after drying, and it can be seen from the figure that the characteristic diffraction peaks of zinc-aluminum hydrotalite structures (Zn0.7Al0.3(OH)2(CO3)0.15·H2O) appeared at 2θ = 11.6°, 23.3°, 34.5°, 39.1°, 46.6° which belongs to its (003), (006), (012), (015), (018) crystal planes respectively (PDF#48-1022). Characteristic diffraction peaks of zinc malachite ((Cu, Zn)2CO3(OH)2) appeared at 2θ = 14.6°, 17.5°, 24.1°, 24.1°, 29.6°, 35.3°, which is attributed to its (200), (210), (220), (211), (420) respectively (PDF#36-1475). After mixing with glucose, the CZA-G catalyst precursor exhibited a characteristic diffraction peak of the glucose (111) crystal plane at 2θ = 20.6° (PDF#24-1964). The results showed that glucose mixing had little effect on the crystal structure of the precursor. | ||
| Fig. 1 XRD patterns of CZA catalyst and CZA-G catalysts (a) dried, (b) calcined and (c) after treatment with feed gas. | ||
Fig. 1(b) shows the XRD pattern of the catalyst after calcination. It can be seen from the figure that the characteristic diffraction peaks of CuO appeared at 2θ = 35.5°, 38.7°, and 48.7° for the CZA catalyst, corresponding to its (![[1 with combining macron]](https://www.rsc.org/images/entities/char_0031_0304.gif) 11), (111), (
11), (111), (![[2 with combining macron]](https://www.rsc.org/images/entities/char_0032_0304.gif) 02) crystal plane (PDF#45-0937), and ZnO (100) crystal characteristic diffraction peaks at 2θ = 31.8° (PDF#36-1451), respectively. For CZA-2%G catalyst, in addition to the characteristic diffraction peaks of CuO and ZnO, the characteristic diffraction peaks of Cu2O appeared at 2θ = 29.5°, 36.4°, 42.3° and 61.3°, corresponding to its (110), (111), (200) and (220) crystal planes, respectively (PDF#05-0667). The CZA-4%G catalyst exhibited a weak diffraction peak of elemental Cu characteristics. CZA-6%G and CZA-8%G present only the characteristic diffraction peaks of elemental copper at 2θ = 43.1°, 50.4°, and 74.1°, corresponding to its (111), (200) and (220) crystal planes, respectively (PDF# 04-0836). These results indicate that glucose pretreatment can reduce the catalyst during calcination, and the extent of catalyst reduction increases with the amount increase of the glucose.
02) crystal plane (PDF#45-0937), and ZnO (100) crystal characteristic diffraction peaks at 2θ = 31.8° (PDF#36-1451), respectively. For CZA-2%G catalyst, in addition to the characteristic diffraction peaks of CuO and ZnO, the characteristic diffraction peaks of Cu2O appeared at 2θ = 29.5°, 36.4°, 42.3° and 61.3°, corresponding to its (110), (111), (200) and (220) crystal planes, respectively (PDF#05-0667). The CZA-4%G catalyst exhibited a weak diffraction peak of elemental Cu characteristics. CZA-6%G and CZA-8%G present only the characteristic diffraction peaks of elemental copper at 2θ = 43.1°, 50.4°, and 74.1°, corresponding to its (111), (200) and (220) crystal planes, respectively (PDF# 04-0836). These results indicate that glucose pretreatment can reduce the catalyst during calcination, and the extent of catalyst reduction increases with the amount increase of the glucose.
Fig. 1(c) shows the XRD spectra of the catalyst treated with feed gas. As can be seen from the Fig. 1(c), the catalyst after reaction shows only the characteristic diffraction peaks of Cu and ZnO, and the copper in the mixed valence state of CZA-2%G and CZA-4%G catalysts disappears, indicating that the treatment with feed gas results in a secondary gas phase reduction, which is attributed to the existence of a large amount of H2 in the feed gas itself.33
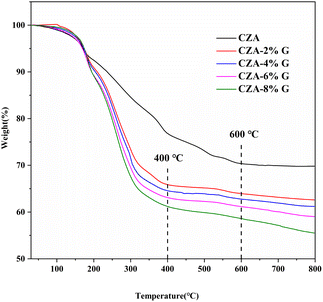
The thermogravimetric curves of the CZA and CZA-G catalysts (Fig. 2) show that the decomposition of CZA catalysts almost completes at 600 °C while the decomposition of CZA-G completes at 400 °C. The results indicate that the addition of glucose is beneficial to the decomposition of the catalyst. Table 1 lists the total weight loss of the catalysts heating when heated to 700 °C. As shown in the Table 1, the weight loss of the CZA-2%G catalyst is more than 6.9% compared to the CZA catalyst. And the weight loss of catalysts adding with different amount glucose increases from 37.0% to 42.8%. The results indicate that the reduction degree of CuO in catalysts increases with the increase consumption of glucose, which is consistent with the XRD results.
| Sample | SBET (m2 g−1) | SCua (m2 g−1) | DCub (nm) | Total weight lossc (%) |
|---|---|---|---|---|
| a Calculated by N2O titration.b Calculated by Cu (111) reflection of the XRD results based on Scherrer equation.c Calculated by TG curves. | ||||
| CZA | 57 | 50 | 17 | 30 |
| CZA-2%G | 82 | 66 | 15 | 37 |
| CZA-4%G | 64 | 53 | 16 | 38 |
| CZA-6%G | 40 | 36 | 17 | 40 |
| CZA-8%G | 53 | 40 | 21 | 43 |
Fig. 3 shows the N2 isotherm adsorption–desorption curve and pore size distribution of CZA and CZA-G catalysts. The catalyst adsorption–desorption isotherms are typical IV isotherms (Fig. 3(a)) and the pore size distribution of all catalysts are relatively concentrated (Fig. 3(b)), which indicates that the stacked mesoporous structure exists in the catalysts.34 With the amount increase of the glucose, the pore size of the CZA-G catalyst increases slightly, and the pore size was concentrated around 15 nm.
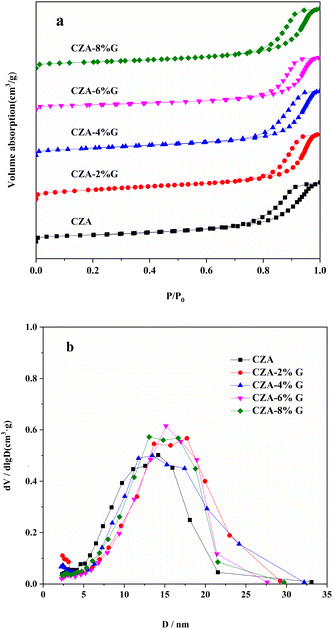 | ||
| Fig. 3 N2 absorption–desorption isotherm curves (a) and pore diameter distribution curves (b) of different catalyst samples. | ||
Table 1 lists the physico-chemical properties of the catalyst. Compared with the CZA catalyst, the specific surface area of the CZA-G catalyst (SBET) increases firstly and then decreases with the amount increase of the glucose. The specific surface area of the metal Cu (SCu) also has the same trend as well as SBET. The average Cu grain size of the Cu (111)crystal face decreases firstly and then increases according to the XRD results calculated by Scherer public. The minimum of 15 nm of average grain size of Cu particles is obtained in the CZA-2%G catalyst.
The SEM images of the catalyst samples after calcination (Fig. 4) show that the catalysts have a layered structure with isolated and stacked nanoparticles distributed on its surface, which is consistent with the hydrotalcite-like structure characterized by XRD. In contrast, it is found that glucose pretreatment makes the Cu particles form more uniformly and the Cu particle size decrease obviously in the CZA-2%G catalyst. As shown in the Table 1, the specific surface area of the Cu particles in the CZA-2%G catalyst reaches the maximum of 82 m2 g−1.
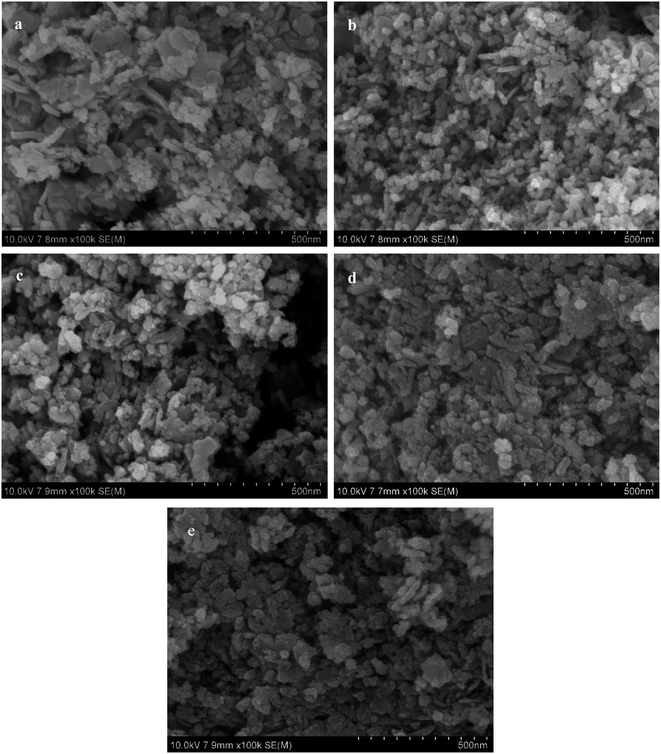 | ||
| Fig. 4 SEM images of calcined catalyst samples (a) CZA, (b) CZA-2%G, (c) CZA-4%G, (d) CZA-6%G, (e) CZA-8%G. | ||
Fig. 5 shows the XPS spectra of the catalyst after calcination and reaction, and the surface oxidation state and composition of Cu in the catalyst were further analyzed by Cu LMM auger electron spectroscopy. The kinetic energy of Cu LMM of Cu0, Cu+ and Cu2+ are 918.6 eV, 916.8 eV and 917.9 eV, respectively.35,36 As shown in the Fig. 5(a), the CZA catalyst has only one peak at 917.9 eV ascribed to the Cu2+. The result indicates that only CuO exists in the CZA catalyst, which is consistent with the XRD results. The peak of Cu+ appears at about 916.8 eV in the CZA-2%G and CZA-4%G catalysts, and the Cu2+ peak area of the catalysts is significantly reduced, indicating that the degree of reduction is further improved. The Cu2+ peaks disappear in the CZA-6% G and CZA-8%G catalysts, and a peak of Cu0 appears at 918.6 eV. Table 2 lists the proportions of different valence Cu of the catalysts after calcination, the surface of the catalyst prepared after pretreatment basically exists in the form of Cu+. In the Fig. 5(b), the Cu2+ peaks of all catalysts disappear after the reaction, and Cu exists in the form of Cu0 and Cu+. In the CZA-2%G catalyst, the ratio of Cu0/Cu+ is 0.15. According to the active site exploration in the literature, the presence of Cu+ is beneficial to the activity of the catalyst.37
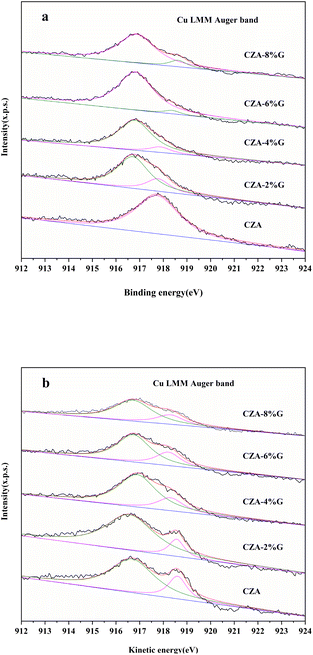 | ||
| Fig. 5 Cu LMM Auger electron spectroscopies of catalyst samples (a) calcined and (b) after treatment with feed gas. | ||
| Sample | Cu+/Cu2+ | Cu+/Cu0 | Cu0/Cu+ |
|---|---|---|---|
| a Calculated by Cu LMM Auger electron spectroscopy. Cu+/Cu2+ and Cu+/Cu0 is related to the catalysts after calcination, Cu0/Cu+ is related to the catalysts after reaction. | |||
| CZA | 0 | — | 0.28 |
| CZA-2%G | 3.49 | — | 0.15 |
| CZA-4%G | 8.66 | — | 0.27 |
| CZA-6%G | — | 26.68 | 0.36 |
| CZA-8%G | — | 9.78 | 0.32 |
3.2 H2-TPR analysis
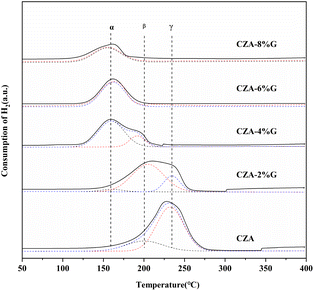
Fig. 6 shows the H2-TPR profile of catalyst samples. Combined with XRD and XPS analysis, only Cu2+ exists in the CZA catalyst, so the broad peak is the reduction peak of CuO. The catalyst prepared after pretreatment has a variety of valence copper, so its reduction peak is the reduction of mixed valence copper species. The reduction peaks were divided and fitted into peaks, the α peak around 160 °C can be attributed to the reduction of Cu2O to Cu, the β peak around 200 °C is the reduction of highly dispersed copper on the catalyst surface, and the γ peak around 235 °C is the reduction of copper species in the bulk phase.38–40 Table 3 lists the TPR fitting data of CZA and CZA-2%G catalyst samples. Compared with the CZA catalyst, the proportion of β peaks in the CZA-2%G catalyst increases from 23.9% to 73.9%, which indicates that the Cu dispersion in the pretreated catalyst samples increase. Meanwhile, the specific surface area of Cu particles in the CZA-2%G catalyst also increase, reaching the maximum of 66 m2 g−1. The results are consistent with the N2O titration result of CZA-2%G catalyst.3.3 CO2-TPD analysis
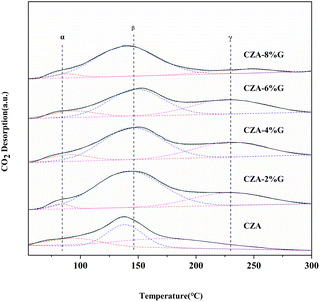
Fig. 7 shows the CO2-TPD curve of the catalyst samples to characterize the surface basic of the catalysts. All desorption peaks can be decomposed into three Gaussian peaks. The peak around 85 °C (α peak) is the bicarbonate formed on the hydroxyl group on the surface of the catalyst, which belongs to the weak basic sites. The peak around 140 °C (β peak) and peak around 228 °C (γ peak) are the bicentate carbonate bridging type and bicentate carbonate chelating type formed by metal–oxygen interaction on the surface of the catalyst, which both belong to the medium-strong basic sites. The strong basic sites are generally above 300 °C, and it is the surface oxygen ion (O2−) that forms a monodentate carbonate on the surface of the catalyst.41,42 Related literature show that carbonate intermediates are tend to be hydrogenated by H to HCOO*, H2COO*, H2COOH* and H2CO*, and finally the C![[double bond, length as m-dash]](https://www.rsc.org/images/entities/char_e001.gif) O bond of H2CO* is activated to react with H atoms on the surface to form methanol.43,44 As can be seen from the Fig. 7, the γ peak temperature of the catalyst samples pretreated with glucose moves to the high temperature, the strength of the medium-strong basic sites increases and the peak area also increases significantly. This can be attributed to the increased dispersion and specific surface area of the active site Cu in the catalyst samples after glucose pretreatment, which promotes the contact between Cu and ZnO, Al2O3, enhances the metal–oxygen pair interaction in the catalyst, and thus increases the distribution of basic sites on the catalyst surface.
O bond of H2CO* is activated to react with H atoms on the surface to form methanol.43,44 As can be seen from the Fig. 7, the γ peak temperature of the catalyst samples pretreated with glucose moves to the high temperature, the strength of the medium-strong basic sites increases and the peak area also increases significantly. This can be attributed to the increased dispersion and specific surface area of the active site Cu in the catalyst samples after glucose pretreatment, which promotes the contact between Cu and ZnO, Al2O3, enhances the metal–oxygen pair interaction in the catalyst, and thus increases the distribution of basic sites on the catalyst surface.
Table 4 shows the peak area of CO2 desorption and the proportion of medium-strong basic sites in the catalyst samples. It is found that the total base peak areas of the catalysts increase after glucose pretreatment. Especially, the peak proportion of β increase apparently. Compare to the CZA catalyst, the total base peak area of the CZA-2G catalyst increases from 26.1 to 41.9. Simultaneously, the peak area and the proportion of β both increase from 10.3 to 30.3 and from 39.5% to 72.3%, respectively in the CZA-2G catalyst. The increase of β improve the adsorption and activation capacity of CO2 of the CZA-2G catalyst.
| Sample | Peak area and contribution % | |||
|---|---|---|---|---|
| Peak α | Peak β | Peak γ | Total area | |
| a α-weak basic sites; β, γ-medium-strong basic sites. | ||||
| CZA | 4.3(16.5) | 10.3(39.5) | 11.5(44.0) | 26.1 |
| CZA-2%G | 1.3(3.1) | 30.3(72.3) | 10.3(24.6) | 41.9 |
| CZA-4%G | 2.9(7.4) | 24.2(61.6) | 12.2(31.0) | 39.3 |
| CZA-6%G | 3.2(9.5) | 18.3(54.5) | 12.1(36.0) | 33.6 |
| CZA-8%G | 1.3(4.6) | 24.4(86.2) | 2.6(9.2) | 28.3 |
3.4 Catalyst catalytic performance
The CO2 conversion and the product selectivity of catalysts are shown in the Table 5. Compared with the CZA catalyst, the activity of the CZA-G catalyst catalyzing the CO2 hydrogenation to methanol is obviously improved. With the increase of the amount of glucose, the catalyst activity increases firstly and then decreases obviously. The catalyst activity with the amount of 2% glucose reaches the optimum after pretreatment, resulting the CO2 conversion of 12.8%, the selectivity of methanol of 70.5%, the yield of methanol of 9.0%, and the space time yield (STY) of 57.0 g kg−1 h−1. The optimal catalyst activity of the CZA-G catalyst is attributed to the appropriate amount of glucose pretreatment improved the structural properties of the catalyst. According to the previous XRD, H2-TPR and XPS characterization, there are different valence Cu species (Cu+/Cu0) in the catalyst as the active center of the catalyst, which contributes to the formation of methanol. And improves the interaction between the active metal and the carrier oxides ZnO and Al2O3, resulting in smaller Cu particles, increasing the dispersion of Cu and the specific surface area of Cu, as demonstrated by the above N2O titration results (Table 1). Moreover, the increase of the number of medium and strong base sites in the CZA-G catalyst promoted the selectivity of methanol. In addition, CZA-G catalyst also exhibit bigger average pore diameter and BET special surface area than CZA (Table 1), which is may be conducive to the improvement of catalyst performance.| Sample | CO2 conversion (%) | Selectivity (%) | STY of CH3OH (g kg−1 h−1) | Yield (%) | |
|---|---|---|---|---|---|
| CH3OH | CO | ||||
a Reaction conditions: H2![[thin space (1/6-em)]](https://www.rsc.org/images/entities/char_2009.gif) : :![[thin space (1/6-em)]](https://www.rsc.org/images/entities/char_2009.gif) CO2 = 3 CO2 = 3![[thin space (1/6-em)]](https://www.rsc.org/images/entities/char_2009.gif) : :![[thin space (1/6-em)]](https://www.rsc.org/images/entities/char_2009.gif) 1, W/F = 10 g h mol−1, P = 3.0 MPa, T = 200 °C, TOS = 48 h. 1, W/F = 10 g h mol−1, P = 3.0 MPa, T = 200 °C, TOS = 48 h. |
|||||
| CZA | 10.3 | 65.7 | 34.3 | 45.6 | 6.8 |
| CZA-2%G | 12.8 | 70.5 | 29.5 | 57.0 | 9.0 |
| CZA-4%G | 11.6 | 71.1 | 28.9 | 54.7 | 8.3 |
| CZA-6%G | 10.5 | 72.5 | 27.5 | 50.7 | 7.6 |
| CZA-8%G | 8.5 | 72.8 | 27.2 | 39.9 | 6.2 |
The activity of the CZA-2%G catalyst at different reaction temperatures (Fig. 8) shows that the reaction temperature has a greater influence on the product distribution of the catalyst. As the reaction temperature increases, the CO2 conversion gradually increases and the methanol selectivity decreases. The studying result is consistent with the studies in the literature.45 This is because there is a side reaction in the reaction process, the reverse water gas conversion reaction (RWGS: CO2 + H2 → CO + H2O), which is a typical endothermic reaction. The higher temperature increases, the more conducive to the production of CO is obtained. Consequently, the methanol selectivity decreases apparently with increasing temperature. At the reaction temperature of 180 °C, methanol selectivity reaches optimum value of 79.8%. When the temperature increases to 260 °C and methanol selectivity decreases to 41.9%. When the reaction temperature was 240 °C, the methanol yield reached the maximum.
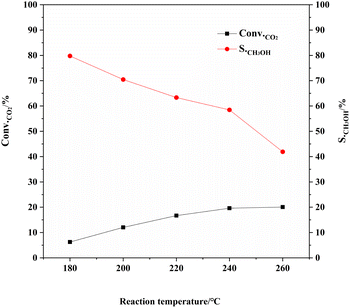 | ||
Fig. 8 Catalytic performance of CZA-2%G catalyst at different reaction temperatures. Reaction conditions: H2![[thin space (1/6-em)]](https://www.rsc.org/images/entities/char_2009.gif) : :![[thin space (1/6-em)]](https://www.rsc.org/images/entities/char_2009.gif) CO2 = 3 CO2 = 3![[thin space (1/6-em)]](https://www.rsc.org/images/entities/char_2009.gif) : :![[thin space (1/6-em)]](https://www.rsc.org/images/entities/char_2009.gif) 1, W/F = 10 g h mol−1, P = 3.0 MPa, T = 180 °C/200 °C/220 °C/240 °C/260 °C. 1, W/F = 10 g h mol−1, P = 3.0 MPa, T = 180 °C/200 °C/220 °C/240 °C/260 °C. | ||
As can be seen from Fig. 9, the CO2 conversion and methanol selectivity of CZA-2%G catalyst are basically stable after reaction for 20 h, and the activity of the catalyst decreased slightly after 120 h of reaction.
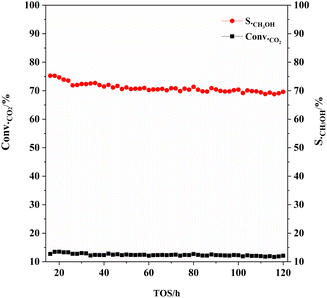 | ||
Fig. 9 The variation of catalytic performance of CZA-2%G catalyst during a TOS of 120 h. Reaction conditions: H2![[thin space (1/6-em)]](https://www.rsc.org/images/entities/char_2009.gif) : :![[thin space (1/6-em)]](https://www.rsc.org/images/entities/char_2009.gif) CO2 = 3 CO2 = 3![[thin space (1/6-em)]](https://www.rsc.org/images/entities/char_2009.gif) : :![[thin space (1/6-em)]](https://www.rsc.org/images/entities/char_2009.gif) 1, W/F = 10 g h mol−1, P = 3.0 MPa, T = 200 °C. 1, W/F = 10 g h mol−1, P = 3.0 MPa, T = 200 °C. | ||
4 Conclusion
In this experiment, a series of Cu–ZnO–Al2O3 pretreated with different amount of glucose are prepared and the performances on catalyzing the hydrogenation of CO2 to methanol are investigated. The results show that the pretreated glucose has a significant impact on the physicochemical properties and catalytic performance compared with the untreated Cu–ZnO–Al2O3 catalyst, the pretreatment with appropriate amount of glucose can introduce copper active centers of different valences into the catalysts. The combination of the tiny particle size, the large specific surface area and the uniform distribution of the copper particles is beneficial to the increase of the medium-strong basic sites on the surface of the catalyst, which can promote effectively the activity of the catalyst for hydrogenation of CO2 to methanol. The Cu–ZnO–Al2O3 catalyst pretreated with 2% glucose has the highest methanol space-time yield 57.0 g kg−1 h−1, and the methanol yield is also the highest 9.0%. In addition, in this experiment, the catalyst prepared by glucose pretreatment precursor can spontaneously conduct redox in the calcination process under inert atmosphere, omitting the traditional catalyst plus H2 reduction step and reducing the consumption of H2.Author contributions
Xiuyun Jiang: investigation, methodology, experiments, data acquisition, original draft writing, validation, formal analysis. Wenbing Yang: methodology, data acquisition, experimental discussion, formal analysis. Hao Song: experimental discussion. Jucang Ke: experimental discussion. Peng Li: formal analysis, validation. Rui Li: characterization writing – review & editing. Qingxiang Ma: conceptualization, methodology, funding, supervision, writing. Jian Sun: writing – review & editing. Tsubaki Noritatsu: writing – review & editing.Conflicts of interest
There are no conflicts to declare.Acknowledgements
This work was supported by the financial support from the National natural Science Foundation of China (21766027,21965028), Ningxia Natural Science Foundation (2021AAC03108), Ningxia Innovation and Entrepreneurship Program for Returnees, and Doctoral Research Initiation Fund of Ningxia University.References
- J. W. Zhong, X. F. Yang, Z. L. Wu, B. L. Liang, Y. Q. Huang and T. Zhang, Chem. Soc. Rev., 2020, 49, 1385–1413 RSC.
- K. Baz, J. H. Cheng, D. Y. Xu, K. Abbas, I. Ali, H. Ali and C. D. Fang, Energy, 2021, 226, 120357 CrossRef.
- M. N. Anwar, A. Fayyaz, N. F. Sohail, M. F. Khokhar, M. Baqar, A. Yasar, K. Rasool, A. Nazir, M. U. F. Raja, M. Rehan, M. Aghbashlo, M. Tabatabaei and A. S. Nizami, J. Environ. Manage., 2020, 260, 110059 CrossRef CAS PubMed.
- H. Lei, R. H. Zheng, Y. P. Liu, J. C. Gao, X. Chen and X. L. Feng, RSC Adv., 2019, 9, 13696–13704 RSC.
- A. Dibenedetto, A. Angelini and P. Stufano, J. Chem. Technol. Biotechnol., 2014, 89, 334–353 CrossRef CAS.
- Y. H. Wang, W. G. Gao, H. Wang, Y. E. Zheng, W. Na and K. Z. Li, RSC Adv., 2017, 7, 8709–8717 RSC.
- W. H. Li, H. Z. Wang, X. Jiang, J. Zhu, Z. M. Liu, X. W. Guo and C. S. Song, RSC Adv., 2018, 8, 7651–7669 RSC.
- G. A. Olah, Angew. Chem., Int. Ed., 2005, 44, 2636–2639 CrossRef CAS PubMed.
- C. L. Zhong, X. M. Guo, D. S. Mao, S. Wang, G. S. Wu and G. Z. Lu, RSC Adv., 2015, 5, 52958–52965 RSC.
- A. Álvarez, A. Bansode, A. Urakawa, A. V. Bavykina, T. A. Wezendonk, M. Makkee, J. Gascon and F. Kapteijn, Chem. Rev., 2017, 117, 9804–9838 CrossRef.
- M. D. Porosoff, B. H. Yan and J. G. Chen, Energy Environ., 2016, 9, 62–73 RSC.
- X. M. Guo, D. S. Mao, G. Z. Wang and S. Lu, J. Catal., 2010, 271, 178–185 CrossRef CAS.
- I. C. Lo and H. S. Wu, J. Taiwan Inst. Chem. Eng., 2016, 9, 62–73 Search PubMed.
- S. Kondrat, P. J. Smith, L. Lu and J. K. Bartley, Catal. Today, 2018, 317, 12–20 CrossRef CAS.
- G. Bonura, M. Cordaro, C. Cannilla, F. Arena and F. Frusteri, Appl. Catal., B, 2014, 152–153, 152–161 CrossRef CAS.
- J. Zhu, D. Ciolca, L. Liu, A. Parastaev, N. Kosinov and E. J. M. Hensen, ACS Catal., 2021, 11, 4880–4892 CrossRef CAS PubMed.
- K. Chen, J. Yu, B. Liu, C. C. Si, H. Y. Ban, W. J. Cai, C. M. Li, Z. Li and K. Fujimoto, J. Catal., 2019, 372, 163–173 CrossRef CAS.
- W. J. Cai, Q. Chen, F. G. Wang, Z. C. Li, H. Yu, S. Y. Zhang, L. Cui and C. M. Li, Catal. Lett., 2019, 149, 2508–2518 CrossRef CAS.
- P. Gao, F. Li, N. Zhao, F. K. Xiao, W. Wei, L. S. Zhong and Y. H. Sun, Appl. Catal., A, 2013, 468, 442–452 CrossRef CAS.
- E. J. Choi, Y. H. Lee, D. W. Lee, D. J. Moon and K. Y. Lee, Mol. Catal., 2017, 434, 146–153 CrossRef CAS.
- N. Pasupulety, H. Driss, Y. A. Alhamed, A. A. Alzahrani, M. Daous and L. Petrov, Appl. Catal., 2015, 504, 308–318 CrossRef CAS.
- F. Arena, G. Mezzatesta, G. Zafarana, G. Trunfio, F. Frusteri and L. Spadaro, Catal. Today, 2013, 210, 39–46 CrossRef CAS.
- M. Behrens, J. Catal., 2009, 267, 24–29 CrossRef CAS.
- R. Q. Yang, X. C. Yu, Y. Zhang, W. Z. Li and N. Tsubaki, Fuel, 2008, 87, 443–450 CrossRef CAS.
- H. Lei, R. F. Nie, J. H. Fei and Z. Y. Hou, J. Zhejiang Univ., Sci., A, 2012, 13, 395–406 CrossRef CAS.
- X. X. Hou, C. H. Xu, Y. L. Liu and J. J. Li, J. Catal., 2019, 379, 147–153 CrossRef CAS.
- P. Lu, D. Xu, D. M. Shen, B. Han, X. K. Gai, C. Xing, H. Y. Liu, C. X. Lu and R. Q. Yang, J. Mol. Catal., 2017, 31, 141–151 CAS.
- J. Yang, Y. Zhou, T. Okamoto, R. Ichino and M. Okido, J. Mater. Sci., 2007, 42, 7638–7642 CrossRef CAS.
- Y. He, X. Wu, G. Lu and G. Shi, Mater. Chem. Phys., 2006, 98, 178–182 CrossRef CAS.
- J. Jiang, D. Tan, J. Liu, Y. Han, H. Chen and Z. Yu, Nonferrous Met. Mater. Eng., 2004, 25, 5–8 CAS.
- C. Song, H. Huang, G. Yin, X. Ma and S. Kang, J. Wuyi Univ., Nat. Sci. Ed., 2010, 24, 39–44 Search PubMed.
- Y. Cao, Preparation of cuprous oxide by glucose reduction method, Central South University, 2009 Search PubMed.
- Y. F. Zhang, W. B. Yang, Q. X. Ma, X. H. Gao, J. L. Zhang, P. Li, T. S. Zhao and R. Li, Acta Pet. Sin., 2021, 37, 508–517 CAS.
- J. Liu, C. H. Han, X. C. Yang, G. J. Gao, Q. Q. Shi, M. Tong, X. Y. Liang and C. F. Li, J. Catal., 2016, 6, 113–121 Search PubMed.
- X. S. Dong, F. Li, N. Zhao, Y. S. Tan, J. W. Wang and F. K. Xiao, Chin. J. Catal., 2017, 10, 132–157 Search PubMed.
- J. F. Yu, M. Yang, J. X. Zhang, Q. J. Ge, A. Zimina, T. Pruessmann, L. Zheng, J. D. Grunwaldt and J. Sun, ACS Catal., 2020, 10, 14694–14706 CrossRef CAS.
- L. L. Wang, L. M. Yang, Y. H. Zhang, W. Ding, S. P. Chen, W. P. Fang and Y. Q. Yang, Fuel Process. Technol., 2010, 91, 723–728 CrossRef CAS.
- P. Gao, F. Li, F. K. Xiao, N. Zhao, W. Wei, L. S. Zhong and Y. H. Sun, Catal. Today, 2012, 194, 9–15 CrossRef CAS.
- X. B. Zhang, L. Zhong, Q. H. Guo, H. Fan, H. Y. Zheng and K. C. Xie, Fuel, 2010, 89, 1348–1352 CrossRef CAS.
- F. Prinetto, G. Ghiotti, R. Durand and D. Tichit, J. Phys. Chem. B, 2000, 104, 11117–11126 CrossRef CAS.
- M. Leon, E. Diaz, S. Bennici, A. Vega, S. Ordóñez and A. Auroux, Ind. Eng. Chem. Res., 2010, 49, 3663–3671 CrossRef CAS.
- Q. X. Ma, M. Q. Geng, J. L. Zhang, X. L. Zhang and T. S. Zhao, ChemistrySelect, 2019, 4, 563–581 Search PubMed.
- V. D. B. C. Dasireddy and B. Likozar, Renewable Energy, 2019, 140, 452–460 CrossRef CAS.
- P. Gao, F. Li, N. Zhao, F. K. Xiao, W. Wei, L. S. Zhong and Y. H. Sun, Appl. Catal., A, 2013, 468, 442–452 CrossRef CAS.
- X. Jie, D. S. Mao, X. M. Guo and J. Yu, Appl. Surf. Sci., 2015, 338, 146–153 CrossRef.
| This journal is © The Royal Society of Chemistry 2023 |


