 Open Access Article
Utilizing a nanocomposite aerogel grafted with Fe3O4@GO for the extraction and determination of metoprolol in exhaled breath condensate†
Bita Azadab,
Zahra Karimzadehab,
Amirreza Jabbaripourc,
Vahid Jouyban-Gharamalekid,
Maryam Khoubnasabjafarief,
Abolghasem Jouybanag and
Elaheh Rahimpour *ah
*ah
aPharmaceutical Analysis Research Center and Faculty of Pharmacy, Tabriz University of Medical Sciences, Tabriz, Iran. E-mail: Rahimpour_e@yahoo.com
bStudent Research Committee, Faculty of Pharmacy, Tabriz University of Medical Sciences, Tabriz, Iran
cFaculty of Medicine, Tabriz Azad Islamic University, Tabriz, Iran
dKimia Idea Pardaz Azarbayjan (KIPA) Science Based Company, Tabriz University of Medical Sciences, 5165665811, Tabriz, Iran
eTuberculosis and Lung Diseases Research Center, Tabriz University of Medical Science, Tabriz, Iran
fDepartment of Anesthesiology and Intensive Care, Faculty of Medicine, Tabriz University of Medical Sciences, Tabriz, Iran
gPharmaceutical Sciences Research Center, Shahid Beheshti University of Medical Sciences, Tehran, Iran
hInfectious and Tropical Diseases Research Center, Tabriz University of Medical Sciences, Tabriz, Iran
First published on 18th October 2023
Abstract
This article presents a solid-phase extraction method combined with a spectrofluorometric method for the extraction/pre-concentration and determination of metoprolol (MET) in exhaled breath condensate. The extraction sorbent is an agarose aerogel nanocomposite grafted with graphene oxide (GO) Fe3O4. The size and morphology of the nanosorbent were characterized via X-ray crystallography, scanning electron microscopy, Fourier-transform infrared spectrometry, and Brunauer–Emmett–Teller analysis. Factors affecting the extraction/determination of MET were optimized using the one-at-a-time method. Under optimized experimental conditions, the calibration graph was linear in the range of 0.005 to 2.0 μg mL−1 with a detection limit of 0.001 μg mL−1. The method was successfully applied for the determination of MET in biological samples taken from patients receiving MET.
1. Introduction
Metoprolol (MET) is a member of the β-blocker family of drugs that are utilized to treat incessant heart failure, coronary artery disease, hypertension, and other cardiovascular disorders. β-Blockers have clinical applications and play a role in diminishing nervousness, anxiety, and tremors. However, they are regularly misused as doping agents in exercises requiring high accuracy and precision, potentially leading to hypotension, bradycardia, and fatigue.1,2 Typical plasma and urine concentrations of MET as a quite sensitive drug are 0.02–0.5 μg mL−1 and 968.0 μg mL−1,3 in which its small dosage can achieve an adequate blockage of the β-adrenergic receptors. The incorrect usage of beta-blockers can lead to severe consequences due to their fast-acting and potentially hazardous effects. Notably MET is a moderately lipophilic β-blocker and the overconsumption of beta-blocker medications, such as MET, can pose a risk as it has the potential to significantly decrease the heart rate and blood pressure.53,54 Hence, examining the distribution of MET in different biological samples could yield valuable insights in relation to researching medications, resolving criminal cases, comprehending toxins, and deducing the movement of pharmaceuticals within the body.4,5Various techniques, including capillary zone electrophoresis,6,7 ultrahigh-performance liquid chromatography,8 gas chromatography-mass spectrometry,9 micellar electrokinetic chromatography,10 spectrofluorimetry,11 and HPLC along with fluorescence, ultraviolet, and diode array detectors12–16 have been utilized to determine MET1 in various biological samples. MET measurement calls for a prompt and precise approach; however, considering the shortcomings in the previous approaches, the development of a method that offers simplicity, speed, and exceptional accuracy is still required. Monitoring drugs through optimal methods appears to hold promise. The optical strategy is a straightforward and high assurance way, as it is based on an inalienable fluorescent characteristic of MET.17 Due to the complexity of biological samples, it is crucial to employ a technique to enhance the concentration and purity of a medication before assessing it in an analytical system.18 Extracting substances using the solid-phase extraction (SPE) method is a convenient, cost-effective, and rapid means of preconcentration procedure and can be conducted using a simple solid-phase cartridge.19 With recent advancements in nanotechnology, the application of nanostructures in manufacturing efficient sorbents for SPE cartridges has increased due to their superior physicochemical features.20 Among several nanomaterials, nanocomposite aerogels (NCAs), obtained by a supercritical drying of hydrogels, have been recently exploited as a potential sorbent in extraction applications.21 In particular, their grafting with some fillers, such as graphene oxide (GO), has attracted great scientific interest, due to their large specific surface area, low density, high-energy storage, and ultrahigh porous structure.22 However, graphene-based aerogels have the drawbacks of a hydrophobic surface and structural shrinkage, which limit their usage in analytical systems.23 In order to resolve the problems previously stated, surface functionalization by using cross-linkers and nanoparticles would be an efficient approach. Here, magnetic nanoparticles (e.g., Fe3O4 NPs) with unique properties, such as chemical stability, fast recovery, effortless separation, complex formation with pollutants, and low cost, were selected to decorate GO surface. This aimed to not only improve the GO's structural features but also avoid the agglomeration and oxidization of naked Fe3O4 NPs (due to their high chemical activity).24
Exhaled breath condensate (EBC), as newly used biological sample type, has attracted increasing attention in recent years.25–28 It possesses both volatile and non-volatile analytes of various sizes, from small metal ions to genes and proteins. EBC has been introduced as an alternative biological sample type due to its less complicated matrix, non-invasive sampling procedure compared to blood samples, more prominent compliance from patients, and as it permits coordinated sampling injection into the analyzer, with no need for a skilled individual to gather the EBC, and the plausibility of providing as many as required samples per day.55 Moreover, because the condensate consists primarily of water, very little sample preparation is required.56 Consequently, EPB has been used for the monitoring of disease biomarkers,29,30 and drugs,31–36 while also some general parameters, such as the pH of the EBC,37 have been employed in recent biomedical investigations.
In this study, we attempted to extract and pre-concentrate MET with NCAs grafted with Fe3O4@GO from EBC samples. As it can be effectively loaded with profoundly active compounds beneath dry conditions, and given its large-pore structure, large specific surface area, and biodegradability, agarose as an ideal raw polysaccharide was selected for preparing the aerogel here.38 For this, a nanocomposite aerogel based on agarose grafted with Fe3O4 and GO was synthesized and used as a compelling adsorbent for the extraction and preconcentration of low concentrations of MET from aqueous solutions. It should be noted that the main aim in the selection of Fe3O4 nanoparticles was not using their magnetic property, rather they were utilized as an available filler with certain desirable properties, such as narrow size distributions, biocompatibility, non-toxic nature, simple preparation method,57 and especially good affinity toward MET, which could be enhanced in the presence of GO sheets. In the last step, to optimize the absorption of MET, Fe3O4@GO nanocomposites were incorporated into agarose to boost the stability and porosity of the nanocomposite.58
2. Experimental
2.1. Chemicals and reagents
All the used chemicals and solvents, including sodium hydroxide (NaOH), acetic acid (HAC), hydrochloric acid (HCl), ethanol (EtOH), methanol (MeOH), formic acid, acetonitrile (ACN), sulfuric acid (H2SO4), sodium nitrate, potassium permanganate, sodium dihydrogen phosphate, hydrogen peroxide, FeCl3·6H2O, FeCl2·4H2O, ammonia solution, and citric acid, were obtained from Merck (Darmstadt, Germany). All the solutions were prepared with high-purity deionized water (Ghazi Serum Co, Tabriz, Iran, http://www.sgco-infusion.com/). Agarose was purchased from Sigma-Aldrich Co. A stock solution of MET succinate tartrate (gifted by Sobhan Darou Co., Rasht, Iran) at a concentration of 500 μg mL−1 was prepared by dissolving an appropriate amount of drug powder in deionized water, which was then kept in a refrigerator at approximately 4 °C away from light. The consecutive dilution of this stock solution with high-purity deionized water was used for preparing other working standard solutions.2.2. Instruments and apparatuses
For measurement of the fluorescence spectra, a FP-750 spectrofluorometer (Jasco Corp., Japan) was used with a xenon lamp source and a 1 mL standard quartz cell. The bandwidths were set at 10 nm in the excitation and 5 nm in the emission paths for recording all the fluorescence spectra. The Fourier-transform infrared (FT-IR) spectra were obtained on a Bruker FT-IR spectrophotometer (Model Tensor 270) under ambient conditions. Typical scans were obtained over 4000–400 cm− 1 spectral width with a resolution of 4 cm −1. To study the morphological characteristics of the nanosorbent, a MIRA3 (TESCAN, Czech Republic) field emission scanning electron microscopy (FESEM) system was employed. Powder X-ray diffraction (XRD) patterns were achieved using a Siemens diffractometer with filtered Cu-Kα radiation at 35 kV within the 2θ range of 4°–70°. For the BET surface area analysis, a BELSORP MINI II instrument was used.2.3. Synthesis of the GO and Fe3O4 nanoparticles
GO was synthesized using the modified Hummer approach.39 For this purpose, 1.0 g of graphite was mixed with 54.0 mL of concentrated H2SO4, and then in an ice bath, 1.0 g of sodium nitrate was added to the reaction container. The ice bath was expelled and the suspension was permitted to warm up to 33 °C after the expansion of potassium permanganate (4.0 g) under vigorous stirring. With continuous stirring for 45 min, the mixture transformed into a brown shade upon the addition of 46 mL of purified water. Another 150 mL of water was added to the reaction to further dilute it, followed by the addition of 3.5 mL of 30% hydrogen peroxide to convert the remaining permanganate and manganese dioxide into soluble manganese sulfate. The suspension was rinsed three times with 3% HCl and then left to dry. The resulting black graphite oxide was irradiated for 3 h in an ultrasonic bath until a colloidal solution was obtained. The obtained GO was further dried for examination and structural analysis.Furthermore, Fe3O4 NPs were synthesized utilizing the method portrayed in the literature.40 First, in 40 mL deionized water, 8.73 mmol of FeCl2·4H2O and 4.37 mmol of FeCl3·6H2O were dissolved and under a N2 purge, the solution was heated to 80 °C. Thereupon, 5 mL of ammonia solution (28% v/v) was added quickly into the vigorously stirred solution. Following a 30 min duration, a magnet was used to gather the solid substances, which were then cleansed with purified water and dried in a vacuum at normal room temperature.
2.4. Synthesis of Fe3O4@GO/agarose NCAs
To prepare the Fe3O4@GO nanocomposite, first, 26 mg of GO was dispersed in 1 mL of deionized water and placed in an ultrasound bath for 10 min to distribute the particles evenly in the solution. Upon adding 26 mg of Fe3O4 to the initial solution, the resulting mixture underwent an additional 10 min of processing in an ultrasonic bath. The obtained Fe3O4@GO nanocomposite was maintained at a standard temperature for further experimentation.To obtain Fe3O4@GO/agarose NCAs, agarose solution was prepared by adding 0.075 g of agarose into 6 mL of water until it was totally dissolved at melting point (65–85 °C) using a stirrer. At this point, the pre-prepared Fe3O4@GO nanocomposite solution was added to the hot agarose solution and mixed for another few min at 80 °C to guarantee homogeneity. By increasing the temperature, the GO sheets were reduced (rGO). The hot Fe3O4@rGO/agarose solution was dropped into liquid nitrogen by pipette tip to immediately form Fe3O4@rGO/agarose nanocomposite hydrogel. The hydrogel was placed in a −78 °C refrigerator for 24–48 hours and subsequently at a temperature of 31.5 °C and pressure of 74 bar, it was dried with supercritical CO2 (SC-CO2).41
2.5. Preparation of the sample solutions
To produce our solutions, we utilized high-grade chemicals and purified deionized water. Working standard solutions were obtained quotidian by a suitable accumulative dilution of the stock solutions with deionized water. In order to collect human exhalation samples, an exhalation collection device was used.26 The EBC device consisted of a cooling trap whose temperature could be adjusted from 0 °C to −25 °C. This device cooled first the blown air rapidly and after that cleared out the vaporized particles on the surface of the trap within the frame of the condensed water vapor particles. Without any preparation step, the obtained EBC samples were straightforwardly analyzed. For the optimization and calibration methods, the used samples were collected from healthy volunteers. For checking the method's applicability, real samples were taken from 5 patients receiving MET. The sample donors signed a consent form confirmed by the ethics committee of Tabriz University of Medical Sciences, with the code IR.RBZMED.REC.1401.568.2.6. General procedure
For preparing the initial solution, 1.0 μg mL−1 of MET was spiked into a 2 mL microtube containing 300 μL EBC and 50 μL of phosphate buffer at pH 9 followed by topping up to the final volume of 2 mL with deionized water. An appropriate and optimized amount of NCAs was placed into a cartridge with a 25 μm filter at the outlet end of the cartridge. The initial solution was passed through the cartridge twice and the passed solution was discharged. Up to this point, the NCAs substrate had absorbed the drug. Afterward, a desorption solvent consisting of 500 μL of methanol/acetic acid with a 99![[thin space (1/6-em)]](https://www.rsc.org/images/entities/char_2009.gif) :
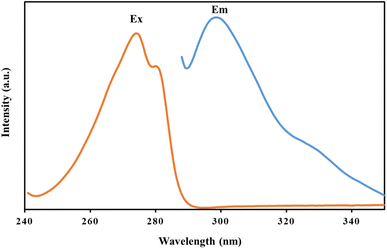
:![[thin space (1/6-em)]](https://www.rsc.org/images/entities/char_2009.gif) 1 v/v% was employed to eliminate the absorbed analyte from the cartridge. At this point, the supernatant was collected and its fluorescent intensity was measured at 310 nm with an excitation wavelength of 274 nm (Fig. 1). All the experiments were repeated three times (N = 3).
1 v/v% was employed to eliminate the absorbed analyte from the cartridge. At this point, the supernatant was collected and its fluorescent intensity was measured at 310 nm with an excitation wavelength of 274 nm (Fig. 1). All the experiments were repeated three times (N = 3).
3. Results and discussion
3.1. Choice of adsorbent for MET determination
The demand for efficient and precise absorption is increasingly quantitative and requires rapid sorption. An effective adsorption material comprises a permeable and steady matrix with great renewability, a high adsorption capacity, suitable functional groups, and high surface-area accessibility. In this regard, Fe3O4 NPs, GO sheets, and Fe3O4@GO nanocomposites, and their aerogels were separately synthesized and tested to find the appropriate adsorption material for the target analyte extraction. When Fe3O4 NPs and GO sheets were utilized, the quantity of the analyte retrieved was considerably small based on the findings. However, the Fe3O4@GO nanocomposites showed progressive analyte recovery for MET, as well as Fe3O4@GO/agarose NCA. It should be noted that the MET recovery from the Fe3O4 NPs (60%) was higher than that from the GO sheets (35%), which could be related to due to the nanomaterials' nature, i.e. large surface area compared with GO sheets. Alternatively, nanocomposites offer the chance for higher performance due to their synergistic impacts compared with single NPs. Additionally, Fe3O4@GO/agarose NCA was confirmed to show superior performance for the pre-concentration/extraction of MET compared to Fe3O4@GO nanocomposites, which could be ascribed to the porous structure of the agarose aerogel, which increased its adsorption capacity owing to its high surface area. Accordingly, Fe3O4@GO/agarose NCA was employed as an adsorbent for the determination of MET in EBC. The general process for synthesizing the hydrogel-based nanocomposite is schematically depicted in Scheme 1.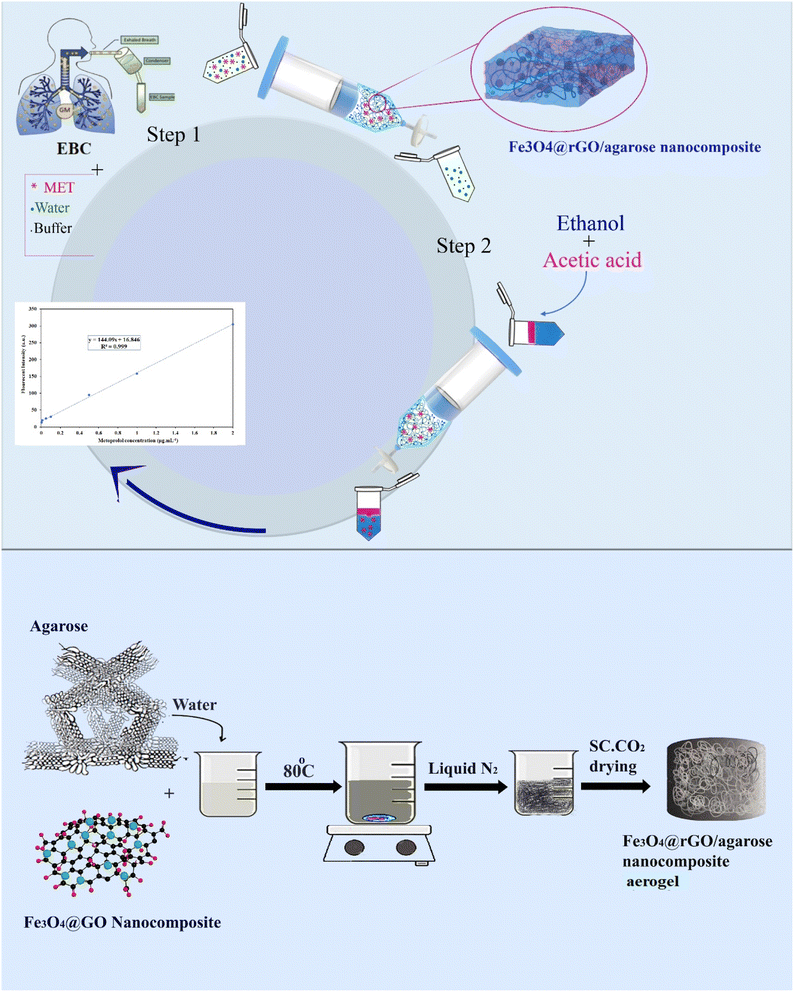 | ||
| Scheme 1 Schematic representation of MET extraction using Fe3O4@rGO/agarose aerogels from EBC samples. | ||
3.2. Characterization of Fe3O4@rGO/agarose aerogel
To confirm the formation of GO and Fe3O4 NPs in addition to investigating their interactions with agarose, Fourier-transform infrared (FT-IR) spectroscopy was used. According to the FT-IR spectrum of GO (Fig. 2A(I)), the presence of absorption peaks at about 1230 and 1637 cm−1 could be attributed to the C–O stretching vibrations and C![[double bond, length as m-dash]](https://www.rsc.org/images/entities/char_e001.gif) O stretching of carboxylic and/or carbonyl moiety functional groups, respectively. Additionally, the absorption peaks at 3438 and 1629 cm−1 were related to the vibration peaks of water molecules and nanocomposite O–H stretching, and the vibration absorption peak of C
O stretching of carboxylic and/or carbonyl moiety functional groups, respectively. Additionally, the absorption peaks at 3438 and 1629 cm−1 were related to the vibration peaks of water molecules and nanocomposite O–H stretching, and the vibration absorption peak of C![[double bond, length as m-dash]](https://www.rsc.org/images/entities/char_e001.gif) O in carboxyl, individually.42 According to the FT-IR spectrum of Fe3O4@rGO in Fig. 2A(II), a broad peak was seen at 590 cm−1 in addition to the peaks seen in Fig. 2A(I), which could be attributed to the presence of the magnetic phase, suggesting that Fe3O4 was successfully bound to the GO.59 A band at 1637 cm−1 and a broad band centered at 3420 cm−1 accompanied the presence of hydroxyl groups and were attributed to OH bending and OH stretching, respectively, from iron oxide or perhaps from the moisture present in the sample. Two overlapping bands coordinated at 2956 and 2898 cm−1 (related to the –CH2 symmetric and asymmetric stretches of Fe3O4) appeared in the nanocomposite form, representing the successful integration of Fe3O4 in the GO structure.43 The FT-IR spectrum of NCA in Fig. 2A(III) showed the characteristic peaks of agarose at 895/932/1156, 1077, 1637, 2924, and 3420 cm−1, attributed to vibrational modes of the glycosidic linkage stretching, glycoside bonding, C–H stretching, and polysaccharides, respectively. Moreover, there was an increase in the intensity of OH stretching at 3420 cm−1, C–O stretching at 1077 cm−1, and C
O in carboxyl, individually.42 According to the FT-IR spectrum of Fe3O4@rGO in Fig. 2A(II), a broad peak was seen at 590 cm−1 in addition to the peaks seen in Fig. 2A(I), which could be attributed to the presence of the magnetic phase, suggesting that Fe3O4 was successfully bound to the GO.59 A band at 1637 cm−1 and a broad band centered at 3420 cm−1 accompanied the presence of hydroxyl groups and were attributed to OH bending and OH stretching, respectively, from iron oxide or perhaps from the moisture present in the sample. Two overlapping bands coordinated at 2956 and 2898 cm−1 (related to the –CH2 symmetric and asymmetric stretches of Fe3O4) appeared in the nanocomposite form, representing the successful integration of Fe3O4 in the GO structure.43 The FT-IR spectrum of NCA in Fig. 2A(III) showed the characteristic peaks of agarose at 895/932/1156, 1077, 1637, 2924, and 3420 cm−1, attributed to vibrational modes of the glycosidic linkage stretching, glycoside bonding, C–H stretching, and polysaccharides, respectively. Moreover, there was an increase in the intensity of OH stretching at 3420 cm−1, C–O stretching at 1077 cm−1, and C![[double bond, length as m-dash]](https://www.rsc.org/images/entities/char_e001.gif) O stretching at 1635 cm−1, indicating the interaction of agarose and GO. Furthermore, the intensity decreases at 3431, 1624, and 1078 cm−1, and also the disappearance of the peak at 1730 cm−1 in the nanocomposite form of GO, confirmed its reduction (rGO).44
O stretching at 1635 cm−1, indicating the interaction of agarose and GO. Furthermore, the intensity decreases at 3431, 1624, and 1078 cm−1, and also the disappearance of the peak at 1730 cm−1 in the nanocomposite form of GO, confirmed its reduction (rGO).44
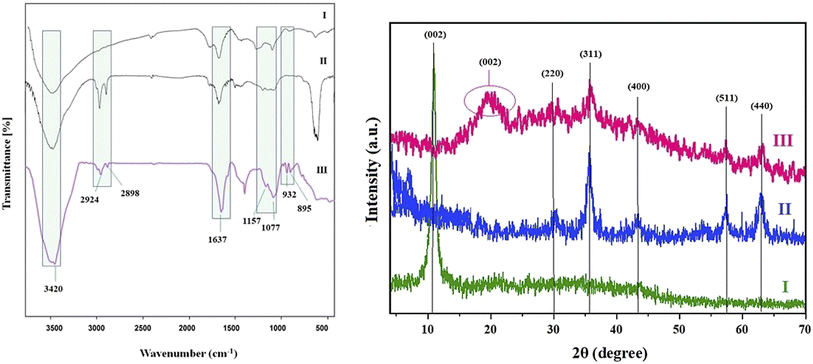 | ||
| Fig. 2 (A) FT-IR spectra and (B) XRD patterns of (I) GO, (II) Fe3O4@GO, and (III) Fe3O4@rGO/agarose NCAs. | ||
In order to authenticate the crystallinity and phase purity of the gels and also to guarantee the favored amalgamation of Fe3O4@rGO into the agarose matrix, the samples were subjected to XRD analysis. Fig. 2B shows the XRD patterns of GO, Fe3O4@rGO, and Fe3O4@rGO/agarose NCA. As shown in Fig. 2B(I), the diffraction peak at 2θ = 10° was specific to the (002) reflection of GO.45 For Fe3O4@rGO (Fig. 2B(II)), new diffraction peaks appeared at 2θ: 30.1°, 35.4°, 43.1°, 57°, and 62.6° and could be ascribed to the (220), (311), (400), (511), and (440) facets of the cubic spinel crystal planes of Fe3O4.43 As shown in Fig. 2B(III), the appearance of the above-mentioned peaks evidenced the successful synthesis of Fe3O4@rGO/agarose NCAs. It was significant to note that the reflection peak at 10°, which was attributed to layered GO, disappeared during the formation of GO, Fe3O4@rGO nanocomposite, and agarose nanocomposite aerogel, respectively. This may be due to the fact that after being covered with Fe3O4, the GO sheets were no longer stackable with each other to form crystalline structures. Furthermore, the appearance of a small and broad pick at 23.58° confirmed the reduction of GO during the composition with the agarose aerogel.
The surface morphology of the proposed Fe3O4@rGO/agarose aerogel was analyzed via SEM analysis (Fig. 3). Fig. 3a shows the morphology of GO, revealing the two-dimensional GO with layered structures and a face-to-face assembly of sheets. The FESEM image of the GO@Fe3O4 nanocomposite (Fig. 3b) showed aggregates of crystallites gathered together as pseudo-spherical particles with approximate sizes ranging from 30–50 nm, then accumulating with each other and enwrapping the GO sheets, confirming the successful synthesis of Fe3O4 NPs on the surface of the GO sheets. Fig. 3c illustrates the porous structure of Fe3O4@rGO/agarose aerogel containing an interconnected network of graphene flakes.
 | ||
| Fig. 3 SEM images of (a) GO, (b) Fe3O4@rGO, and (c) Fe3O4@rGO/agarose aerogel with magnifications of 2 μm, 500 nm, and 500 nm, respectively. | ||
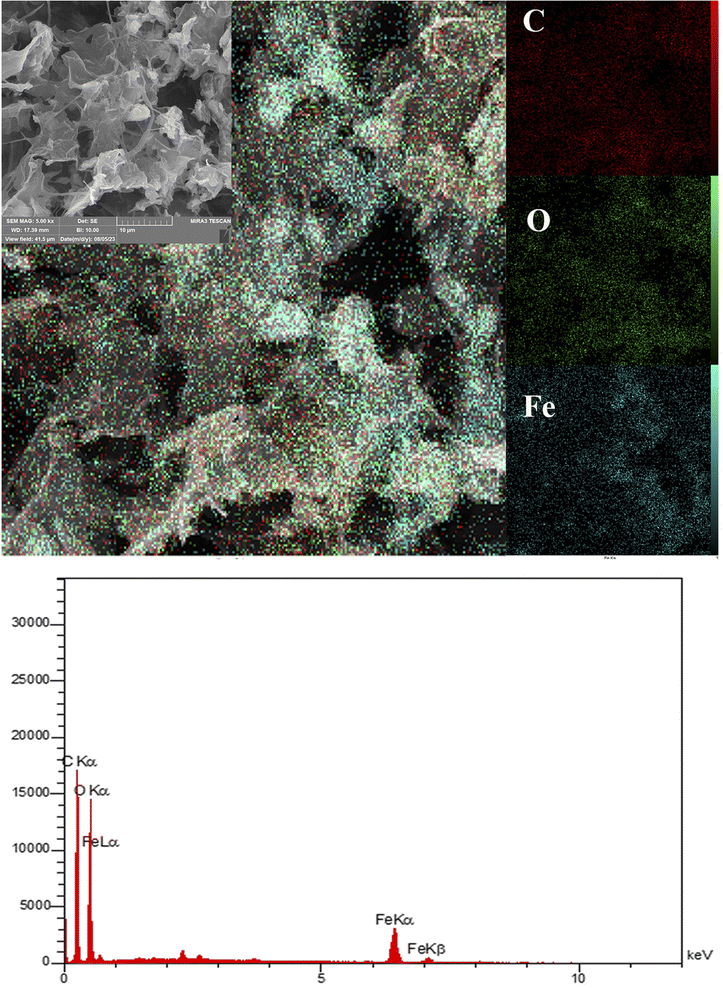
The SEM-EDS image of Fe3O4@rGO/agarose aerogel in Fig. 4 shows the distribution of the C, O, and Fe elements. The compositional map revealed the C, O, and Fe species were greatly dispersed over the matrix surface. The elemental composition was estimated by EDX analysis, as shown in Fig. 3, exhibiting the presence of Fe as a metal and C and O as non-metal constituents. The presence of non-metals suggested the successful attachment of agarose polymer over the matrix.51 In addition, only signals from the primary components of the NCAs (i.e., C, O, and Fe) could be exclusively detected and these signals were uniformly distributed across the entire scanned area. No evidence of foreign elements was detected, indicating the high purity of the sample. The percentages of elements are provided in Table 1.
| Element | C | O | Fe |
| W% | 35.64% | 53.51 | 10.85 |
| A% | 45.61% | 51.41 | 2.98 |
The surface area and porosity of the prepared material, as useful measurements for determining the material's properties, were confirmed by BET surface analysis. BET analysis was thus applied to distinguish the adsorption–desorption isotherms of the GO nanoparticles. According to Fig. 5a, the BET surface area of Fe3O4 was obtained as 92.226 m2 g−1, while according to Fig. 5b, GO had the most noteworthy normalized adsorption capacity due to having the biggest surface area availability, caused by its unique single-atom-layered structure.52 Moreover, the BET surface area of the sample was obtained as 130.94 m2 g−1. The BJH method was utilized to determine the pore-size distribution, which was approximately 9.91 nm. According to Fig. 5c, a characteristic type-IV profile was shown, indicating the mesoporous nature of the Fe3O4@rGO/agarose aerogel. It should be acknowledged that the synthesized NCA could serve as a mesoporous adsorbent providing monolayer–multilayer adsorption. Furthermore, the BET surface area (as,BET) of the sample was obtained as 20.11 m2 g−1. Using the BJH method, the dependent pore-size distribution was calculated as about 9.25 nm.
 | ||
| Fig. 5 Nitrogen adsorption–desorption isotherms of (a) Fe3O4, (b) GO, and (c) Fe3O4@rGO/agarose aerogel and the Barrett–Joyner–Halenda (BJH) pore-size distribution (inset). | ||
3.3. Optimization of the reaction conditions
To obtain an appropriate preconcentration of MET on the agarose NCA grafted with Fe3O4@rGO, the experimental conditions, such as pH, amount of Fe3O4@rGO/agarose aerogel, adsorption/desorption time, and elution conditions, were optimized. Using the “change only one thing at a time” method, where one parameter is varied and the others are kept constant, we sought to optimize the parameters affecting the extraction efficiency. The recovery percentage as the analytical response was calculated from the following equation:
 | (1) |
Experiments were thus conducted to identify a suitable eluent for separating MET from its attached materials. To this end, various reagents, such as ACN, ethanol, MeOH/HAC, and formic acid/ACN/H2O, were tested. As shown in Fig. 6a, the maximum recovery occurred when MeOH/HAC were used as the eluent system. Furthermore, the ratio of MeOH/HAC was optimized. For this purpose, various ratios from 30![[thin space (1/6-em)]](https://www.rsc.org/images/entities/char_2009.gif) :
:![[thin space (1/6-em)]](https://www.rsc.org/images/entities/char_2009.gif) 70 to 99
70 to 99![[thin space (1/6-em)]](https://www.rsc.org/images/entities/char_2009.gif) :
:![[thin space (1/6-em)]](https://www.rsc.org/images/entities/char_2009.gif) 1 of MeOH/HAC were investigated to elute the adsorbed analyte from the sorbent. As shown in Fig. 6b, when the amounts of MeOH and HAC were identical, the recovery was the most unfavorable. The substance gradually exhibited an increased recovery when a higher amount of MeOH was added in comparison to HAC. When the ratio of MeOH to HAC was 99
1 of MeOH/HAC were investigated to elute the adsorbed analyte from the sorbent. As shown in Fig. 6b, when the amounts of MeOH and HAC were identical, the recovery was the most unfavorable. The substance gradually exhibited an increased recovery when a higher amount of MeOH was added in comparison to HAC. When the ratio of MeOH to HAC was 99![[thin space (1/6-em)]](https://www.rsc.org/images/entities/char_2009.gif) :
:![[thin space (1/6-em)]](https://www.rsc.org/images/entities/char_2009.gif) 1, the highest recovery rate of 97% was obtained. Thus, this ratio was selected as the optimal ratio. Furthermore, our analysis included investigating the correlation between the amount of eluent used and the recovery value. The research findings conclusively demonstrated that the highest recovery rates could be achieved by utilizing 500 mL of the eluent (Fig. 6c). Consequently, 500 mL was selected as the optimum volume of the eluent.
1, the highest recovery rate of 97% was obtained. Thus, this ratio was selected as the optimal ratio. Furthermore, our analysis included investigating the correlation between the amount of eluent used and the recovery value. The research findings conclusively demonstrated that the highest recovery rates could be achieved by utilizing 500 mL of the eluent (Fig. 6c). Consequently, 500 mL was selected as the optimum volume of the eluent.
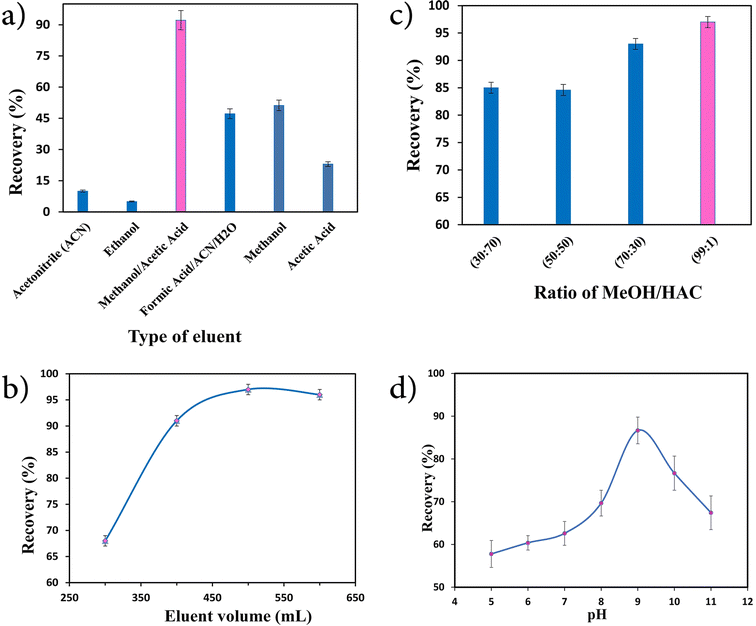 | ||
| Fig. 6 Effect of the (a) type of eluent, (b) ratio of MeOH/HAC, (c) eluent volume (mL), and (d) pH on the extraction efficiency (N = 3). | ||
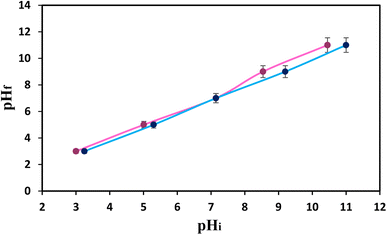
One of the foremost critical variables that may influence the effectiveness of the extraction process is the pH of the sample. Therefore, its optimization could be a critical step in developing an analytical procedure. In this work, the effect of pH on the recovery percentage of MET was studied by varying the pH of the donor solution from 4 to 11 and the results are presented in Fig. 6d. Based on the results, the system response was expanded alongside increasing the pH, where the most elevated recovery response was accomplished at pH 9.0. Based on the literature,46 the pH of the zero-point charge (pHpzc) can be estimated using the pH drift method. To achieve this, aliquots of 20 ml of 0.01 mol L−1 sodium chloride solutions were adjusted to various initial pH values from 3 to 11. Subsequently, 0.01 g of nanosorbent was added to the solutions. The pH values of all the solutions were monitored and compared to their initial pH values after a time period of 24 h. Here, pHpzc is the point where pHi = pHf. As shown in Fig. 7, the pHpzc of the Fe3O4@GO/agarose NCA was around 7.2, whereas the pKa of MET was 9.7. Therefore, the nanocomposite surface would be negatively charged if the pH value is higher than the pHpzc (7.2) and could then interact with the positively formed MET at pH < 9.7. The pH value thus plays a very significant role in the adsorption of the analyte ions, as it affects the protonation and deprotonation of the functional groups in the nanocomposite and analyte present in acidic–basic environments. This work found that the optimal pH for the sample solution was 9.
Moreover, the quantity of adsorbent employed is a significant determinant in assessing the level of adsorption. In the present study, to test the effect of the amount of NCA agent on the quantitative preconcentration of MET, the extraction was carried out by varying the amounts of the sorbent from 2.5 to 20 mg. The results showed that the adsorption increased when increasing the amount of NCA, reaching a plateau at 5.0 mg. As the adsorbent amount increased to 5.0 mg, the adsorbent accessible sites for MET also increased, and subsequently superior adsorption took place. The recovery kept constant for amounts greater than 5.0 mg of the adsorbent, which indicated that 5.0 mg was adequate for 1.0 μg mL−1 of MET.
3.4. Interference study
To demonstrate the selectivity of the developed strategy for MET detection, the impact of various possible co-administrated drugs with MET was investigated under the optimum conditions. The responses were measured based on the presence of potentially interfering substances in EBC, including ibuprofen, caffeine, chlordiazepoxide, clonazepam, phenobarbital, aspirin, diazepam, propranolol, sotalol, diclofenac, enalapril, carvedilol, amlodipine, and losartan. The responses were assessed for an MET concentration of 1.0 μg mL−1 and the concentration of all the interfering substances was just the same as the amount of MET. As shown in Fig. 8, the cumulative addition of the interferences from ibuprofen, caffeine, clonazepam, phenobarbital, aspirin, diazepam, propranolol, enalapril, carvedilol, and amlodipine had a negligible effect on the extraction/determination of MET. However, among the possible co-prescribed drugs, chlordiazepoxide, sotalol, diclofenac, carvedilol, and losartan showed interferences with MET. The interference between MET and sotalol was due to its structural similarity with MET, whereas chlordiazepoxide (absorption wavelength = 285 nm), losartan (λex = 248 nm and λem = 410 nm), diclofenac (λex = 287 nm and λem = 362 nm), and carvedilol (λex = 285 nm and λem = 345 nm) had an overlap in the excitation/emission or absorption wavelength with MET (λex = 274 nm and λem = 310 nm). Therefore, it is proposed that this method could be best performed for MET tracing in the EBC of patients not receiving these drugs.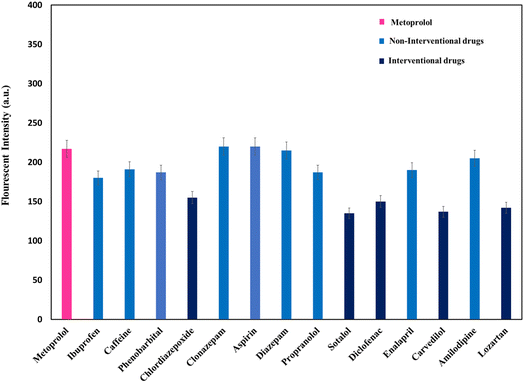 | ||
| Fig. 8 Study of the matrix effects under optimal conditions (1.0 μg mL−1 of MET) using some possible coexisting drugs in EBC samples with concentrations of 1 μg mL−1 (N = 3). | ||
3.5. Analytical figures of merit
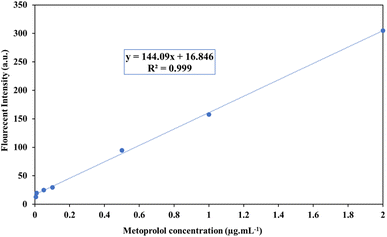
The calibration curve in the direct determination of MET (without the preconcentration step) in the absence of NCA was linear at 0.1–2.0 μg mL−1 with a detection limit of 0.05 μg mL−1. The equation for the regression line was y = 119.79x + 9.6097, where y is the fluorescence intensity in arbitrary units, and x is the concentration of MET expressed in μg mL−1. The calibration graph after preconcentration with the Fe3O4@rGO/agarose aerogel was linear from 0.005–2.0 μg mL−1 with the equation y = 144.09x + 16.846, with a detection limit of 0.003 μg mL−1 (Fig. 9). According to these results, the linear range of MET concentration was improved from 0.1–2.0 μg mL−1 to 0.005–2.0 μg mL−1 after preconcentration with the investigated adsorbent. Additionally, an improvement in the detection limit from 0.05 to 0.003 μg mL−1 was observed. In order to measure the precision of the method, the analysis was repeated on the same day and inter-day relative standard deviations (RSD) were obtained as 1.68% and 2.22% for 0.01, 2.37% and 3.95% for 0.05, and 1.33% and 2.82% for 0.1 μg mL−1 MET, respectively. A comparison of the current procedure with other systems described in other works in the literature is summarized in Table 2. The results showed that the validated method is respectable and comparable with other methods for MET detection.| Type of method | Adsorbent | Sample | LOD (μg mL−1) | Linear range (μg mL−1) | Ref. |
|---|---|---|---|---|---|
| UPLC-UV | — | Plasma | 0.0017 | 0.005–0.3 | 47 |
| Spectrofluorometry | — | Plasma | 0.0165 | 0.05–0.55 | 48 |
| Fourier-transform ion cyclotron resonance mass spectrometry | Nano silver-functionalized magnetic nanoparticles with an interlayer of poly(3,4-dihydroxyphenylalanine) | Plasma | 3.5–6.8 × 10⁻⁶ | 0.05–20 | 5 |
| Ultrahigh-performance liquid chromatography with mass spectrometry | IL@SiO2@Fe3O4 | Plasma | 0.62 × 10⁻⁶ | 0.002–10 | 49 |
| Gas chromatography | Fe3O4 nanoparticles modified with polyamidoamine dendrimers | Plasma and urine | 0.01 | 0.05–0.5 | 50 |
| Spectrofluorimetry | Magnetic iron oxide nanoparticles | Plasma, urine and EBC | 2.1–3.4 × 10⁻³ | Plasma: 6–100 × 10−3 urine, EBC and water: 5–100 × 10−3 | 11 |
| Micellar LC-UV with UV and fluorometric detectors | — | Plasma | 0.016 | 0.1–0.8 | 10 |
| Spectrofluorometry | Fe3O4@GO/agarose nanocomposite aerogel | EBC | 0.003 | 0.005–2.0 | This work |
3.6. Real samples analysis
MET determination was accomplished in five EBC samples taken from patients receiving MET to verify the analytical applicability and feasibility of the proposed Fe3O4@rGO/agarose nanocomposite aerogel with real samples. The standard addition method was used for the patient sample determination. Table 3 presents the results of the real samples analysis. The concentrations of MET in the five EBC real samples were 1.19–2.83 μg mL−1. It should be noted that all the optimization and validation procedures were performed in healthy subjects' EBC samples, who were not administered MET, and no matrix interference was observed. However, for further study of the reliability, the procedure was performed on a blank EBC sample of a healthy subject without any MET spike and negative control samples, i.e., a patient who was not administered MET, and the results are given in Fig. 1S in the ESI,† with the results confirming the method accuracy.| No. | Gender | Age | Daily dose (mg) | MET in EBC (μg mL− 1) |
|---|---|---|---|---|
| 1 | Male | 58 | 47.5 (1 per day) | 0.009 |
| 2 | Female | 66 | 50 (2 per day) | 0.012 |
| 3 | Female | 69 | 95 (1 per day) | 0.010 |
| 4 | Female | 60 | 50 (2 per day) | 0.008 |
| 5 | Female | 59 | 50 (2 per day) | 0.009 |
4. Conclusion
To the best of our knowledge, this is the first application of the synthesized Fe3O4@rGO/agarose aerogel nanocomposite as a highly selective separation agent for the trace analysis and preconcentration of MET in EBC. The achieved results showed that MET was quantitatively adsorbed on the sorbent and, subsequently, could be easily stripped with MeOH/HAC as an eluent. The main advantages of the presented procedure include a low detection limit, high dispersity, good adsorption capacity, excellent accuracy, and good precision. Looking into the future, the sorbent based on agarose nanocomposite aerogel could find new opportunities in a wide range of applications by using different nanofillers, thus opening a broad scope for the construction of unique probes in the pharmaceutical field.Conflicts of interest
There are no conflicts of interest to declare.Acknowledgements
This report is a part of the results of B. Azad's MSc thesis submitted to the Faculty of Pharmacy, Tabriz University of Medical Sciences, Tabriz, Iran, and supported by Tabriz University of Medical Science under grant number of 69787.References
- R. Brogden, et al., Metoprolol: a review of its pharmacological properties and therapeutic efficacy in hypertension and angina pectoris, Drugs, 1977, 14, 321–348 CrossRef CAS PubMed.
- Z. Karimzadeh, et al., Dual-emission ratiometric fluorescent probe based on N-doped CQDs@UiO-66/PVA nanocomposite hydrogel for quantification of pethidine in human plasma, Microchim. Acta, 2023, 190(4), 128 CrossRef CAS PubMed.
- R. Regenthal, et al., Drug levels: therapeutic and toxic serum/plasma concentrations of common drugs, J. Clin. Monit. Comput., 1999, 15, 529–544 CrossRef CAS PubMed.
- S. Brinker, et al., Therapeutic drug monitoring facilitates blood pressure control in resistant hypertension, J. Am. Coll. Cardiol., 2014, 63(8), 834–835 CrossRef PubMed.
- X. Xiao, et al., Rapid and sensitive analysis of trace β-blockers by magnetic solid-phase extraction coupled with Fourier transform ion cyclotron resonance mass spectrometry, J. Pharm. Anal., 2022, 12(2), 293–300 CrossRef PubMed.
- S. Sun, et al., Rapid and sensitive tapered-capillary microextraction combined to on-line sample stacking-capillary electrophoresis for extraction and quantification of two beta-blockers in human urine, Talanta, 2018, 180, 90–97 CrossRef CAS PubMed.
- H. Zhang, H. Shao and Z. Zhang, Optimized conditions of enantioseparation of β-blockers by CZE using carboxymethyl-β-cyclodextrin as chiral selector, Chromatographia, 2008, 68, 653–658 CrossRef CAS.
- I. Baranowska, S. Magiera and J. Baranowski, UHPLC method for the simultaneous determination of β-blockers, isoflavones and their metabolites in human urine, J. Chromatogr. B, 2011, 879(9–10), 615–626 CrossRef CAS PubMed.
- B. Yilmaz and S. Arslan, GC–MS Determination of Atenolol Plasma Concentration after Derivatization with N-methyl-N-(trimethylsilyl) trifluoroacetamide, Chromatographia, 2009, 70, 1399–1404 CrossRef CAS.
- S. Soltani and A. Jouyban, A validated micellar LC method for simultaneous determination of furosemide, metoprolol and verapamil in human plasma, Bioanalysis, 2012, 4(1), 41–48 CrossRef CAS PubMed.
- M. A. Tarfiei, A. B. Tabrizi and A. Jouyban, Trace Extraction of Metoprolol from Plasma, Urine and EBC Samples Using Modified Magnetic Nanoparticles Followed by Spectrofluorimetric Determination for Drug Monitoring Purposes, Curr. Pharm. Anal., 2020, 16(7), 844–855 CrossRef CAS.
- W. Fan, et al., Water-compatible graphene oxide/molecularly imprinted polymer coated stir bar sorptive extraction of propranolol from urine samples followed by high performance liquid chromatography-ultraviolet detection, J. Chromatogr. A, 2016, 1443, 1–9 CrossRef CAS PubMed.
- L. Zahálka, et al., Simultaneous determination of propranolol hydrochloride and sodium benzoate in oral liquid preparations by HPLC, Chromatographia, 2013, 76, 1553–1558 CrossRef.
- A. Sarafraz-Yazdi, M. R. Abedi and Z. Es' haghi, Pre-concentration and determination of β-blockers using carbon nanotube-assisted pseudo-stirbar hollow fiber solid-/liquid-phase microextraction and high-performance liquid chromatography with fluorescence detection, J. Liq. Chromatogr. Relat. Technol., 2013, 36(6), 750–769 CrossRef CAS.
- M. Delamoye, et al., Simultaneous determination of thirteen β-blockers and one metabolite by gradient high-performance liquid chromatography with photodiode-array UV detection, Forensic Sci. Int., 2004, 141(1), 23–31 CrossRef CAS PubMed.
- P. Lukkari, T. Nyman and M.-L. Riekkola, Determination of nine β-blockers in serum by micellar electrokinetic capillary chromatography, J. Chromatogr. A, 1994, 674(1–2), 241–246 CrossRef CAS PubMed.
- Y. Zhang, et al., Fluorescence determination of metoprolol in human plasma by trilinear decomposition-based calibration techniques, Anal. Bioanal. Chem., 2006, 386(6), 1741–1748 CrossRef CAS PubMed.
- M. d. G. A. Korn, et al., Separation and preconcentration procedures for the determination of lead using spectrometric techniques: A review, Talanta, 2006, 69(1), 16–24 CrossRef CAS PubMed.
- N. Talib, S. Mohd-Setapar and A. Khamis, The Benefits and Limitations of Methods Development in Solid Phase Extraction: Mini Review, J. Teknol. Lab., 2014, 69, 69–72 Search PubMed.
- M. Mahmoudpour, et al., Aptamer functionalized nanomaterials for biomedical applications: Recent advances and new horizons, Nano Today, 2021, 39, 101177 CrossRef CAS.
- M. Sun, et al., Development of aerogels in solid-phase extraction and microextraction, TrAC, Trends Anal. Chem., 2022, 146, 116497 CrossRef CAS.
- Z. Karimzadeh and H. Namazi, Nontoxic double-network polymeric hybrid aerogel functionalized with reduced graphene oxide: Preparation, characterization, and evaluation as drug delivery agent, J. Polym. Res., 2022, 29(2), 37 CrossRef CAS.
- I. Ali, et al., In situ reduced graphene-based aerogels embedded with gold nanoparticles for real-time humidity sensing and toxic dyes elimination, Microchim. Acta, 2021, 188(1), 10 CrossRef CAS PubMed.
- N. Shah, et al., Magnetic aerogel: an advanced material of high importance, RSC Adv., 2021, 11(13), 7187–7204 RSC.
- M. Khoubnasabjafari, E. Rahimpour and A. Jouyban, Exhaled breath condensate as an alternative sample for drug monitoring, Future Sci., 2018, 61–64 CAS.
- M. Khoubnasabjafari, et al., Exhaled breath condensate as a potential specimen for diagnosing COVID-19, Future Sci., 2020, 1195–1197 CAS.
- N. Hashemzadeh, E. Rahimpour and A. Jouyban, Applications of Exhaled Breath Condensate Analysis for Drug Monitoring and Bioequivalence Study of Inhaled Drugs, J. Pharm. Pharm. Sci., 2022, 25, 391–401 CAS.
- E. Rahimpour, et al., Non-volatile compounds in exhaled breath condensate: review of methodological aspects, Anal. Bioanal. Chem., 2018, 410, 6411–6440 CrossRef CAS PubMed.
- B. Sepehr, et al., A sensitive determination of ammonia and nitrite in exhaled breath condensate of healthy humans by using berthelot reaction, Curr. Pharm. Anal., 2018, 14(6), 555–561 CrossRef CAS.
- F. Pourkarim, et al., A simple colorimetric method for determination of ethanol in exhaled breath condensate, Pharm. Sci., 2020, 27(2), 297–301 CrossRef.
- Y. Sefid-Sefidehkhan, et al., Efficient dispersive solid-phase extraction of methylprednisolone from exhaled breath of COVID-19 patients, RSC Adv., 2023, 13(17), 11457–11463 RSC.
- Y. Sefid-Sefidehkhan, et al., Utilizing Fe (III)-doped carbon quantum dots as a nanoprobe for deferiprone determination in exhaled breath condensate, Chem. Pap., 2023, 77(3), 1445–1453 CrossRef CAS.
- S. Khajir, et al., A Rayleigh light scattering technique based on β-cyclodextrin modified gold nanoparticles for phenytoin determination in exhaled breath condensate, J. Pharm. Biomed. Anal., 2023, 223, 115141 CrossRef CAS PubMed.
- P. Eydi, et al., A terbium metal–organic framework platform for determination of lamotrigine in exhaled breath condensate, Pharm. Sci., 2021, 28(4), 572–578 Search PubMed.
- M. S. Hoseininezhad-Namin, et al., Electromembrane extraction of tramadol from exhaled breath condensate and its liquid chromatographic analysis, J. Pharm. Biomed. Anal., 2022, 219, 114959 CrossRef CAS PubMed.
- F. Pourkarim, et al., Validation of a colorimetric method for determination of paracetamol in exhaled breath condensate, Chem. Pap., 2021, 75, 2901–2906 CrossRef CAS.
- J. Lačná, et al., Capillary electrophoretic analysis of ionic content in exhaled breath condensate and pH monitoring as a non-invasive method in gastroesophageal reflux disease diagnostics, J. Chromatogr. B, 2019, 1134, 121857 CrossRef PubMed.
- K. Ganesan, et al., Review on the Production of Polysaccharide Aerogel Particles, Materials, 2018, 11(11), 2144 CrossRef PubMed.
- W. S. Hummers Jr and R. E. Offeman, Preparation of graphitic oxide, J. Am. Chem. Soc., 1958, 80(6), 1339 CrossRef.
- H. Abdolmohammad-Zadeh, et al., Aluminum(III)-doped ZnO@Fe3O4 nanocomposite as a magnetic sorbent for preconcentration of cadmium(II), Microchim. Acta, 2017, 184(6), 1641–1648 CrossRef CAS.
- F. Luo, et al., Simultaneous removal of trichloroethylene and hexavalent chromium by green synthesized agarose-Fe nanoparticles hydrogel, Chem. Eng. J., 2016, 294, 290–297 CrossRef CAS.
- B. Nigam, et al., Synthesis and characterization of Fe3O4 nanoparticles for nanofluid applications-a review, in IOP Conference Series: Materials Science and Engineering, IOP Publishing, 2018 Search PubMed.
- H. Abdolmohammad-Zadeh, E. Rahimpour and Y. Pasandideh, Utilizing a nanocomposite based on ion-imprinted polydopamine-coated magnetic graphene oxide for extraction of Cd (II) and Ni (II) from water samples, J. Anal. Chem., 2020, 75, 967–974 CrossRef.
- M. Belay, R. K. Nagarale and V. Verma, Preparation and characterization of graphene-agar and graphene oxide-agar composites, J. Appl. Polym. Sci., 2017, 134(33), 45085 CrossRef.
- H. Abdolmohammad-Zadeh and E. Rahimpour, Utilizing of Ag@ AgCl@ graphene oxide@ Fe3O4 nanocomposite as a magnetic plasmonic nanophotocatalyst in light-initiated H2O2 generation and chemiluminescence detection of nitrite, Talanta, 2015, 144, 769–777 CrossRef CAS PubMed.
- P. Raizada, et al., Solar photocatalytic activity of nano-ZnO supported on activated carbon or brick grain particles: role of adsorption in dye degradation, Appl. Catal., A, 2014, 486, 159–169 CrossRef CAS.
- A. Gallegos, et al., Development of a novel ion-pairing UPLC method with cation-exchange solid-phase extraction for determination of free timolol in human plasma, J. Chromatogr. B, 2018, 1096, 228–235 CrossRef CAS PubMed.
- A. B. Tabrizi, F. Bahrami and H. Badrouj, A very Simple and sensitive spectrofluorimetric method based on the oxidation with cerium (IV) for the determination of four different drugs in their pharmaceutical formulations, Pharm. Sci., 2017, 23(1), 50 CrossRef.
- S. Jamshidi, M. K. Rofouei and G. Thorsen, Using magnetic core-shell nanoparticles coated with an ionic liquid dispersion assisted by effervescence powder for the micro-solid-phase extraction of four beta blockers from human plasma by ultra high performance liquid chromatography with mass spectrometry detection, J. Sep. Sci., 2019, 42(3), 698–705 CrossRef CAS PubMed.
- M. A. A. Abadi, M. Masrournia and M. R. Abedi, Simultaneous extraction and preconcentration of three Beta (β)-blockers in biological samples with an efficient magnetic dispersive micro-solid phase extraction procedure employing in situ sorbent modification, Microchem. J., 2021, 163, 105937 CrossRef.
- J. Li, et al., Pd nanoparticles supported over agar-agar functionalized Fe3O4 as a biodegradable composite nanomedicine for the in vitro anti-human oral cancer application, J. Mater. Res. Technol., 2022, 21, 4876–4885 CrossRef CAS.
- V. B. Mohan, K. Jayaraman and D. Bhattacharyya, Brunauer–Emmett–Teller (BET) specific surface area analysis of different graphene materials: A comparison to their structural regularity and electrical properties, Solid State Commun., 2020, 320, 114004 CrossRef CAS.
- C. A. Barton, et al., Successful treatment of a massive metoprolol overdose using intravenous lipid emulsion and hyperinsulinemia/euglycemia therapy, Pharmacotherapy, 2015, 35(5), e56–e60 CrossRef CAS PubMed.
- M. Lauterbach, Clinical toxicology of beta-blocker overdose in adults, Basic Clin. Pharmacol. Toxicol., 2019, 125(2), 178–186 CrossRef CAS PubMed.
- H. Rezaei, et al., A new method for investigating bioequivalence of inhaled formulations: A pilot study on salbutamol, J. Pharm. Sci., 2023, 26, 11466 Search PubMed.
- M. Khoubnasabjafari, et al., A new hypothesis to investigate bioequivalence of pharmaceutical inhalation products, Daru, 2019, 27(1), 517–524 CrossRef PubMed.
- C. C. Ong, et al., Nanoscaled Surface Modification of Poly(dimethylsiloxane) Using Carbon Nanotubes for Enhanced Oil and Organic Solvent Absorption, ACS Omega, 2018, 3(11), 15907–15915 CrossRef CAS PubMed.
- E. Saatcioglu, et al., 3D printing of Osage orange extract/Chitosan scaffolds for soft tissue engineering, Food Hydrocolloids Health, 2021, 1, 100039 CrossRef CAS.
- K. Nurhasana Siregar, et al., Crystal Structure and Magnetic Properties of Fe3O4 Nanoparticles Using Iron Sand as a Raw Material for Mercury Removal, J. Hunan Univ., Nat. Sci., 2022, 49(12), 142–149 Search PubMed.
Footnote |
| † Electronic supplementary information (ESI) available. See DOI: https://doi.org/10.1039/d3ra03883a |
| This journal is © The Royal Society of Chemistry 2023 |

