 Open Access Article
Piezo-photocatalytic properties of BaTiO3/CeO2 nanoparticles with heterogeneous structure synthesized by a gel-assisted hydrothermal method†
Xia Li‡
ab,
Hongjuan Zheng‡ac,
Jingjin Liue,
Hongcheng Liab,
Jing Wang ac,
Kang Yanac,
Jingsong Liub,
Feng Dang
 d and
Kongjun Zhu
 *ac
*ac
aState Key Laboratory of Mechanics and Control for Aerospace Structures, Nanjing University of Aeronautics and Astronautics, Nanjing 210016, P. R. China. E-mail: kjzhu@nuaa.edu.cn; Fax: +86-25-84895759; Tel: +86-25-84895982
bCollege of Materials Science and Technology, Nanjing University of Aeronautics and Astronautics, Nanjing 210016, P. R. China
cCollege of Aerospace Engineering, Nanjing University of Aeronautics and Astronautics, Nanjing 210016, P. R. China
dKey Laboratory for Liquid-Solid Structural Evolution & Processing of Materials, Ministry of Education, Shandong University, Jinan 250061, P. R. China
eSchool of General Education, Wuchang University of Technology, Wuhan 430223, P. R. China
First published on 16th August 2023
Abstract
BaTiO3/CeO2 nanoparticles with heterogeneous structure were successfully synthesized via a gel-assisted hydrothermal method. The molar ratio of Ti/Ce was set as 1![[thin space (1/6-em)]](https://www.rsc.org/images/entities/char_2009.gif) :
:![[thin space (1/6-em)]](https://www.rsc.org/images/entities/char_2009.gif) 0, 0.925
0, 0.925![[thin space (1/6-em)]](https://www.rsc.org/images/entities/char_2009.gif) :
:![[thin space (1/6-em)]](https://www.rsc.org/images/entities/char_2009.gif) 0.075, 0.9
0.075, 0.9![[thin space (1/6-em)]](https://www.rsc.org/images/entities/char_2009.gif) :
:![[thin space (1/6-em)]](https://www.rsc.org/images/entities/char_2009.gif) 0.1; 0.875
0.1; 0.875![[thin space (1/6-em)]](https://www.rsc.org/images/entities/char_2009.gif) :
:![[thin space (1/6-em)]](https://www.rsc.org/images/entities/char_2009.gif) 0.125, and 0.85
0.125, and 0.85![[thin space (1/6-em)]](https://www.rsc.org/images/entities/char_2009.gif) :
:![[thin space (1/6-em)]](https://www.rsc.org/images/entities/char_2009.gif) 0.15 in the dried gels. Affected by the values of Ti/Ce, the particle sizes of hydrothermal products decreased obviously, and the surface of nanoparticles became rough and even had small protrusions. XRD, SEM, HRTEM, XPS, DRS, ESR, and PFM were used to characterize the nanoparticle textures. We speculated that the main body and surface of nanoparticles were BaTiO3 and CeO2 protrusions, respectively. The catalytic performance of BaTiO3/CeO2 nanoparticles was characterized by their abilities to degrade RhB in water under different external conditions (light irradiation, ultrasonic oscillation, or both). In all test groups, BaTiO3/CeO2 nanoparticles with a Ti/Ce molar ratio of 0.875
0.15 in the dried gels. Affected by the values of Ti/Ce, the particle sizes of hydrothermal products decreased obviously, and the surface of nanoparticles became rough and even had small protrusions. XRD, SEM, HRTEM, XPS, DRS, ESR, and PFM were used to characterize the nanoparticle textures. We speculated that the main body and surface of nanoparticles were BaTiO3 and CeO2 protrusions, respectively. The catalytic performance of BaTiO3/CeO2 nanoparticles was characterized by their abilities to degrade RhB in water under different external conditions (light irradiation, ultrasonic oscillation, or both). In all test groups, BaTiO3/CeO2 nanoparticles with a Ti/Ce molar ratio of 0.875![[thin space (1/6-em)]](https://www.rsc.org/images/entities/char_2009.gif) :
:![[thin space (1/6-em)]](https://www.rsc.org/images/entities/char_2009.gif) 0.125 in the initial dried gel exhibited the strongest catalytic ability when light irradiation and ultrasonication were applied simultaneously owing to the appropriate amount of Ce3+ and oxygen vacancies.
0.125 in the initial dried gel exhibited the strongest catalytic ability when light irradiation and ultrasonication were applied simultaneously owing to the appropriate amount of Ce3+ and oxygen vacancies.
1. Introduction
Environmental pollution has become a serious issue for humanity and has even begun to approach criticality to the planet, challenging the limits of the ecosystem and human health.1,2 Water pollution caused by the discharge of various organic substances is attracting considerable attention because of the difficult degradation of organic chemical substances and its close relationship with human life and social production.3 The degradation of organic pollutants by using traditional chemical oxidation4–6 is also accompanied by the consumption of a large number of chemicals and nonrenewable energy resources. Thus, more environment-friendly methods are needed. Photocatalysis7–10 using solar energy and piezocatalysis11 utilizing mechanical energy as energy sources have become research hotspots. However, the recombination of photoelectrons (e−) and holes (h+) in semiconductors seriously hinders the practical application of photocatalysts. In recent years, the built-in electric field generated by the piezoelectric effects of piezoelectric materials has been proven to be an effective method for improving the separation and migration of photoinduced carriers in photocatalysis. Piezo-photocatalysis that combines piezoelectric materials with semiconductors can utilize the built-in electric field of such materials to control the generation, transmission, and separation of charge carriers at the interface between piezoelectric materials and semiconductors, thereby significantly improving the overall catalytic activity. Therefore, piezo-photocatalysis that combines piezocatalysis and photocatalysis provides new ideas for environmental improvement research such as sterilization, organic-pollutant degradation, and water splitting to produce oxygen and hydrogen.12–14As a typical piezoelectric material, BaTiO3 shows potential in catalysis.15 In addition to being used as an independent catalyst,16,17 BaTiO3 is usually doped with other metal ions or used to construct heterogeneous structures with other inorganic materials18–20 or organic compounds21–23 to form composite catalysts for photocatalysis improvement. Based on excellent thermal-structure stability, catalytic efficiency, and chemoselectivity, CeO2 has been demonstrated as a good catalyst candidate material. Ce3+ and oxygen vacancies introduced into BaTiO3 lattices in an appropriate amount benefit the catalytic performance of the products.24,25 Ce3+ can transform with Ce4+, contributing to an intrinsic catalytic capability of CeO2 and promoting relevant catalytic reactions.26 CeO2 can also be induced by an external electric field and exhibit enhanced catalytic activity.27
Herein, BaTiO3/CeO2 composites with heterogeneous structure were prepared, and their structures, morphologies, piezo-photocatalytic activity, and piezoelectric response were characterized. BaTiO3/CeO2 nanoparticles with a Ti/Ce molar ratio of 0.875![[thin space (1/6-em)]](https://www.rsc.org/images/entities/char_2009.gif) :
:![[thin space (1/6-em)]](https://www.rsc.org/images/entities/char_2009.gif) 0.125 in the initial dried gel exhibited the strongest catalytic ability when the light irradiation and ultrasonic were stimulated simultaneously because of the appropriate amount of Ce3+ and oxygen vacancies. The improved piezo-photocatalytic activity was due to the special catalytic properties of CeO2 and separation of photoinduced carriers promoted by the built-in electric field in BaTiO3 when an external stress was applied.
0.125 in the initial dried gel exhibited the strongest catalytic ability when the light irradiation and ultrasonic were stimulated simultaneously because of the appropriate amount of Ce3+ and oxygen vacancies. The improved piezo-photocatalytic activity was due to the special catalytic properties of CeO2 and separation of photoinduced carriers promoted by the built-in electric field in BaTiO3 when an external stress was applied.
2. Experimental
2.1 Materials
Barium acetate (Ba(CH3COO)2), and sodium hydroxide (NaOH) were used as the source of Ba and mineralizer in the hydrothermal synthesis, respectively. All of them were received from Macklin Biochemical Co., Ltd, Shanghai. Tetra-butyl titanate (Ti(OC4H9)4, TBOT) and cerium(III) acetate hydrate (Ce(CH3CO2)3·xH2O) (M = 317.25) served as the source of Ti and Ce. Glacial acetic acid (CH3COOH) and absolute alcohol (C2H5OH) acted as hydrolysis inhibitor and organic solvent at different experimental stages, respectively. They were provided by Sinopharm Chemical Reagent Co., Ltd, China. All chemicals in this work were analytical grade and used directly without any additional treatment.2.2 Preparation of BTCe dried gel
In a typical procedure, 5.6752 g of Ba(CH3COO)2 and an appropriate amount of Ce(CH3CO2)3·xH2O (M = 317.25) were dissolved in a solution mixed with 20 mL of 36 wt% CH3COOH to obtain solution A. The molar ratio of Ba to (Ti + Ce) was fixed at 1.11, and the molar ratio of Ti/Ce was changed from 1![[thin space (1/6-em)]](https://www.rsc.org/images/entities/char_2009.gif) :
:![[thin space (1/6-em)]](https://www.rsc.org/images/entities/char_2009.gif) 0, 0.925
0, 0.925![[thin space (1/6-em)]](https://www.rsc.org/images/entities/char_2009.gif) :
:![[thin space (1/6-em)]](https://www.rsc.org/images/entities/char_2009.gif) 0.075, 0.9
0.075, 0.9![[thin space (1/6-em)]](https://www.rsc.org/images/entities/char_2009.gif) :
:![[thin space (1/6-em)]](https://www.rsc.org/images/entities/char_2009.gif) 0.1, and 0.875
0.1, and 0.875![[thin space (1/6-em)]](https://www.rsc.org/images/entities/char_2009.gif) :
:![[thin space (1/6-em)]](https://www.rsc.org/images/entities/char_2009.gif) 0.125 to 0.85
0.125 to 0.85![[thin space (1/6-em)]](https://www.rsc.org/images/entities/char_2009.gif) :
:![[thin space (1/6-em)]](https://www.rsc.org/images/entities/char_2009.gif) 0.15, respectively. The corresponding amount of Ti(OC4H9)4 was dispersed in 10 mL of C2H5OH to obtain solution B. After adding solution B into solution A under continuous vigorous stirring, gels formed within several hours at room temperature (∼25 °C). Following aging for 12 h in a natural environment, the gels were placed in an oven at 80 °C until they were dried. The final dried products were named as BTCe-0, BTCe-1, BTCe-2, BTCe-3, and BTCe-4 dried gels, respectively, corresponding with the order of Ti/Ce mentioned above.
0.15, respectively. The corresponding amount of Ti(OC4H9)4 was dispersed in 10 mL of C2H5OH to obtain solution B. After adding solution B into solution A under continuous vigorous stirring, gels formed within several hours at room temperature (∼25 °C). Following aging for 12 h in a natural environment, the gels were placed in an oven at 80 °C until they were dried. The final dried products were named as BTCe-0, BTCe-1, BTCe-2, BTCe-3, and BTCe-4 dried gels, respectively, corresponding with the order of Ti/Ce mentioned above.
2.3 Synthesis of BaTiO3/CeO2 nanoparticles
About 1 g of each above-mentioned BTCe dried gel was dispersed in 50 mL of NaOH solution with a molar concentration of 4.5 M and stirred for 1 h. Then, the suspension liquid was transferred into a Teflon-lined autoclave (70 mL) and heated in the oven at 220 °C for 24 h. The synthesized products were filtered and washed with deionized water and ethanol several times. Finally, the products were dried in an oven at 65 °C overnight and named as BaTiO3 (shorted as BT hereafter), BaTiO3/CeO2-1, BaTiO3/CeO2-2, BaTiO3/CeO2-3 and BaTiO3/CeO2-4, respectively. The schematic of synthesis route is shown in Fig. S1.†2.4 Piezo-photocatalytic test
The catalytic performance of BaTiO3/CeO2 nanoparticles was characterized by their ability to degrade simulated pollutant (RhB in this work) at different energy supplies. The light irradiation and mechanical vibration in the experimental system were provided by a xenon lamp (PLS-SXE300+, Beijing Perfectlight Technology Co., Ltd, China) and an ultrasonic cleaner (JM-05D-40, Skymen Cleaning Equipment Shenzhen Co., Ltd, China), respectively. BaTiO3/CeO2 nanoparticles (100 mg) were dispersed in 100 mL of RhB solution (10 mg L−1) in a beaker. After magnetically stirring the turbid solution for 30 min in darkness to balance the adsorption and desorption of RhB, the beaker was moved into the ultrasonic cleaner followed by light irradiation. Then, 5 mL of turbid liquid was collected every 20 min and centrifuged (9000 rpm, 3 min) to obtain the supernatant and measure the UV-visible absorption of residual RhB. Degradation rate was calculated by converting absorbance into concentration through a dye standard curve to characterize the catalytic performance of BaTiO3/CeO2 nanoparticles. The device diagram of the piezo-photocatalytic test is shown in Fig. S2.†2.5 Characterizations
The crystalline phase of products was determined by the powder X-ray diffraction (XRD; Bruker D8 Advance Diffractometer, Cu Kα radiation, λ = 0.15418 nm). The micromorphology and structure of samples were characterized by field-emission scanning electron microscopy (SEM; HITACHI S-4800 with an accelerating voltage of 25 kV), high-resolution transmission electron microscopy (HRTEM), and selected area electron diffraction (SAED; ThermoFisher TF-G20), respectively. X-ray photoelectron spectroscopy (XPS) analyses were performed on AXIS-Ultra DLD. UV-vis absorption spectra were obtained on a PE Lambda 950 spectrophotometer in diffuse-reflectance mode from 200 nm to 800 nm. Electrochemical impedance spectroscopy (EIS) was conducted using a CHI 660D electrochemical workstation. Piezoelectric force microscopy (PFM) measurements were performed on a Bruker Multimode 8 with a Pt-coated conductive tip. UV-vis diffuse reflectance spectroscopy (DRS) was conducted on a PE Lambda 950 spectrometer with BaSO4 as reference. Electron spin resonance (ESR) was determined on an electron paramagnetic resonance spectrometer (Bruker-A300).3. Results and discussion
3.1 Structures of BaTiO3/CeO2 nanoparticles
Fig. 1 displays the XRD patterns and SEM images of the products as a function of the molar ratio of Ti/Ce. As shown in Fig. 1(a), the main peaks of all patterns can be identified as reflections from BaTiO3 with perovskite structure (PDF#75-0460). No reflections corresponding with impurities were detected in BT. However, when Ce was introduced into dried gel, a diffraction peak of CeO2 (PDF # 78-0694) was found, and the intensity of their diffraction peaks increased with increased Ce content in the dried gels. As shown in Fig. 1(b), the diffraction peak at 2θ = ∼45° split into two peaks, indicating that the phase of pure BT was tetragonal. With increased Ce content in dried gel, the split peak gradually became a single one, indicating that the phase gradually became cubic. This result may be due to the entry of part Ce in the ABO3 lattice.24,25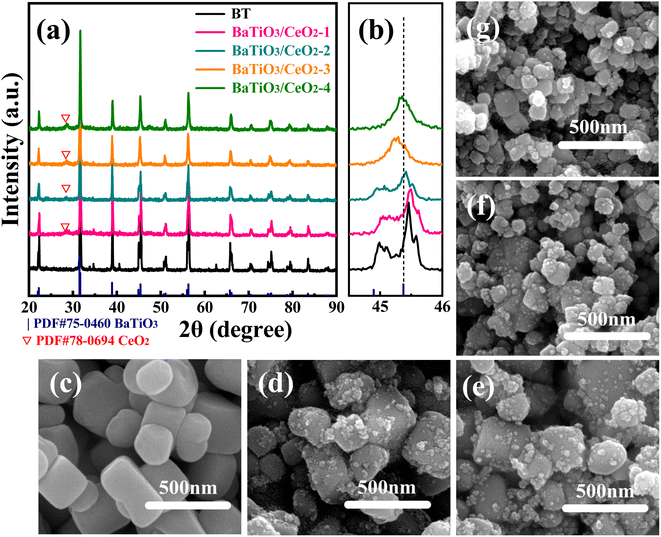 | ||
| Fig. 1 XRD patterns of gel-assisted hydrothermal synthesized products (a and b) and SEM images of BT (c), BaTiO3/CeO2-1 (d), BaTiO3/CeO2-2 (e), BaTiO3/CeO2-3 (f), and BaTiO3/CeO2-4 (g). | ||
The SEM images of BaTiO3/CeO2 nanoparticles are shown in Fig. 1(c)–(g) respectively. The particle sizes of samples gradually decreased, and the average particle sizes of pure BT, BaTiO3/CeO2-1, BaTiO3/CeO2-2, BaTiO3/CeO2-3 and BaTiO3/CeO2-4 were 367.64, 345.03, 324.67, 289.84, and 275.71 nm, respectively. These values were calculated by the Debye–Scherrer equation based on the FWHM of all XRD peaks. The surfaces of BT nanoparticles were also smooth, but some small particles gathered on the surfaces of BaTiO3/CeO2 samples.
The structure of BaTiO3/CeO2-3 sample was further investigated by HRTEM, SAED, and EDX elemental mappings, and results are shown in Fig. 2. Similar to the SEM results (Fig. 1(f)), Fig. 2(a) illustrates that small particles attached onto the surface of large particles. The HRTEM image (Fig. 2(b)) showed clear lattice fringes of the small and large particles. The measured spacing of the most obvious lattice fringe in the main particle was 0.3959 nm and comprised the (1 0 0) plane, whose d-spacing was 0.3994 nm in PDF#75-0460. The spacing measured in the adherent particle was 0.3100 nm and close to the d-spacing of the (1 1 1) plane, 0.3124 nm, in PDF#78-0694. The SEAD pattern (inset of Fig. 2(b)) was a periodic arrangement of two-dimensional diffraction points, which was the diffraction pattern characteristic of single crystal. When [−100] was set as the zone axis, the three diffraction spots closest to the transmission spot were calibrated to (1 1 0), (2 0 0), (1−10), respectively. This calibration result well matched PDF#75-0460. EDX elemental-mapping test was performed on the sample, and the images (Fig. 2(d)–(h)) showed that Ba, Ti, Ce, and O were uniformly distributed in the particles.
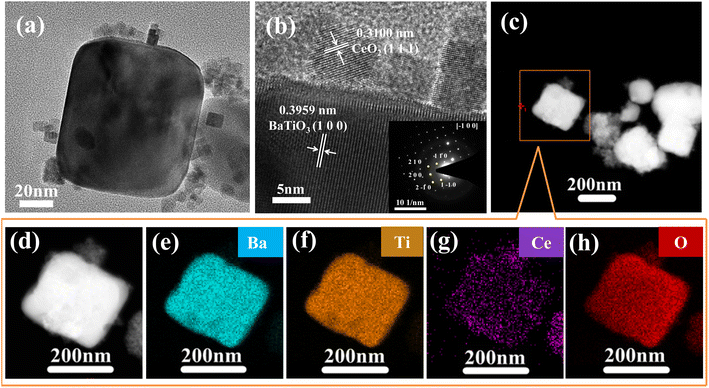 | ||
| Fig. 2 (a) and (b) HRTEM images (inset is the corresponding SEAD pattern). (c)–(h) Corresponding EDX elemental mappings of BaTiO3/CeO2-3 sample. | ||
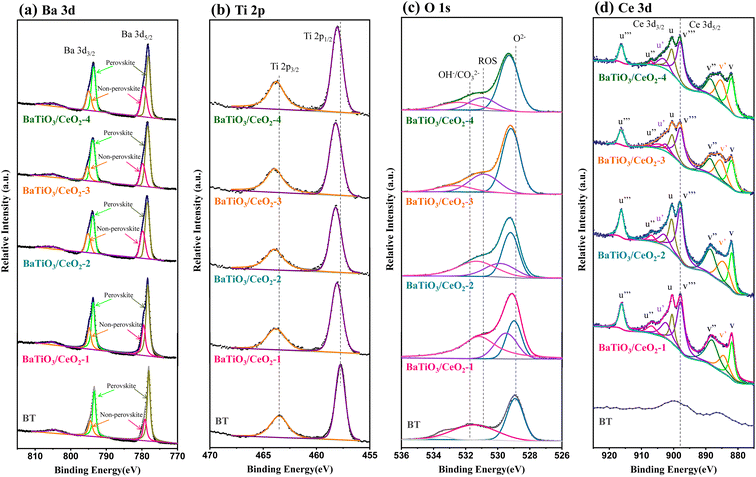
XPS analysis was conducted to evaluate the valence states in the near-surface region. The comparison results of high-resolution spectra for Ba 3d, Ti 2p, O 1s, and Ce 3d are shown in Fig. 3. Compared with pure BT, all Ba 3d, Ti 2p and O 1s spectra of products containing Ce shifted to higher values of binding energy possibly due to the lattice distortion and surface defects in BaTiO3/CeO2 heterogeneous structure.28 In the Ba 3d spectra (Fig. 3(a)), the peaks of Ba atoms in the perovskite and non-perovskite structures29 were deconvoluted in all samples, and the integral area proportion (36.3%, as shown in Table 1) of the nonperovskite structure peaks in BaTiO3/CeO2-3 was the largest. Only two peaks of Ti 2p were fitted in each sample (i.e., at around 458 and 464 eV) without splitting, indicating that Ti existed in the products only in the form of Ti4+. The deconvoluted O 1s spectra contained two peaks in BT but three peaks in the sample containing Ce (Fig. 3(c)). The peak of BT centered at 528.9 eV was attributed to lattice oxygen (O2−), and the one at 531.5 eV was assigned to surface OH−/CO32− due to the existence of –OH groups or absorbed H2O onto the surface of BT. Different from the spectra of BT, the peaks centering at 529–530.9 eV which were ascribed to surface ROS (O2−, O22−, or O−) appeared in the deconvoluted spectra of the other products.25 The ROS were primarily adsorbed onto the surface of oxygen vacancies, so the integral area ratio of the surface ROS can be used to indirectly estimate the number of oxygen vacancies on the catalyst surface.30 The calculation results are shown in Table 1. Meanwhile, the oxygen vacancies in BT and BaTiO3/CeO2-3 nanoparticles, which can be characterized by the EPR signal of electrons trapped in them, exhibited similar results (Fig. S4†). The slightly stronger signal response in BaTiO3/CeO2-3 nanoparticles indicated relatively larger oxygen-vacancy concentration than that in BT. Fig. 3(d) shows the Ce 3d XPS profiles. Two series of spin–orbit lines of Ce 3d spectra, u and v, were captured in the products containing Ce, which belonged to Ce 3d3/2 and Ce 3d5/2, respectively.31 Notably, the u′ and v′ peaks were indexed to Ce3+, whose existence implied that part of Ce entered the BT lattice or changed from +4 to +3 valence state in CeO2. Consequently, oxygen vacancies were generated, and the photocatalytic activity of the product would be enhanced if the amount of Ce3+ and oxygen vacancies was appropriate.31–33
| BT | BaTiO3/CeO2-1 | BaTiO3/CeO2-2 | BaTiO3/CeO2-3 | BaTiO3/CeO2-4 | ||
|---|---|---|---|---|---|---|
| Ba 3d | Perovskite | 70.8% | 67.8% | 64.2% | 63.7% | 72.5% |
| Non-perovskite | 29.2% | 32.2% | 35.8% | 36.3% | 27.5% | |
| O 1s | O2− | 49.39% | 24.98% | 40.38% | 61.28% | 63.14% |
| ROS | — | 24.54% | 22.80% | 27.49% | 19.43% | |
| OH−/CO32- | 50.61% | 50.48% | 36.82% | 11.23% | 17.43% | |
| Ce 3d | Ce4+ 3d | — | 78.17% | 79.59% | 80.01% | 80.09% |
| Ce3+ 3d | — | 21.83% | 20.41% | 19.99% | 19.91% |
3.2 Evaluation of catalytic activity
The catalytic performance of BaTiO3/CeO2 nanoparticles was evaluated by RhB degradation in water with different external environments provided, and the results are shown in Fig. 4. As an important organic dye in the textile industry, RhB is often used as the preferred simulated organic pollutant and an indicator to REDOX degradation reactions in many studies. In this work, the absorbance of initial RhB indicator (10 mg L−1) was set as C0 in Fig. 4(a), (d) and (g). The degradation data (Ct/C0) of RhB used in the corresponding figures were the average of three repeated experiments with each external stimulus, the kinetic numbers (−ln(Ct/C0)) in Fig. 4(b), (e) and (h) were converted by the average of Ct/C0, and the k numbers in Fig. 4(c), (f) and (i) were the slopes of the fitted lines in Fig. 4(b), (e) and (h).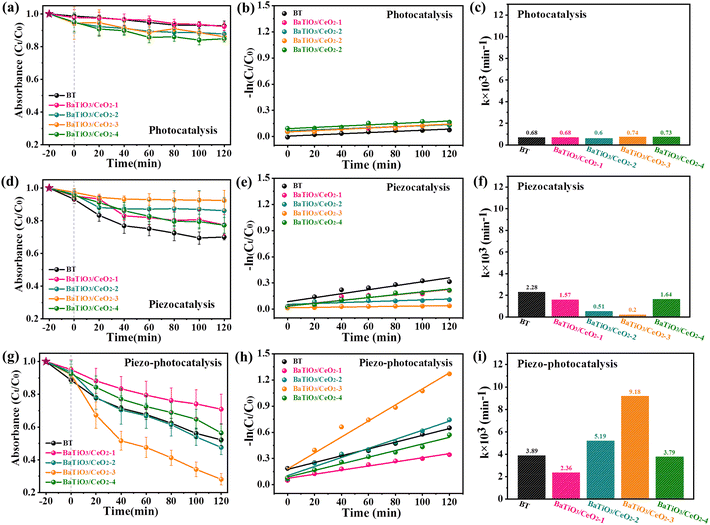 | ||
| Fig. 4 RhB degradation curves ((a), (d), (g)), kinetic curves ((b), (e), (h)), and comparison of degradation ability ((c), (f), (i)) of BaTiO3/CeO2 products in different external environments. | ||
After stirring for 20 min in dark, the adsorption amount of RhB on each sample did not show obvious rules, but was less than 10%. The photocatalytic ability of BaTiO3/CeO2 nanoparticles was evaluated under Xe-lamp irradiation with magnetic stirring (300 rpm). As shown in Fig. 4(a)–(c), RhB degradation was not obvious. The poor photocatalytic activity of BT is due to the high band gap. The inconspicuous photocatalysis of BaTiO3/CeO2 samples may be related to the small amount of Ce3+, even though it had been confirmed to be indeed present in BaTiO3/CeO2 nanoparticles by the fitting results of Ce 3d XPS spectra. In addition, it also may be related to the large initial concentration of RhB solution. Obviously different piezocatalytic abilities (Fig. 4(d)–(f)) were found on different BaTiO3/CeO2 nanoparticles. As a typical piezoelectric material, BT exhibited the best piezoelectric catalytic ability compared with all other samples containing Ce in this work. The variation in piezoelectric catalytic ability between samples was similar to that of tetragonal-phase and perovskite-structure content in samples observed in Fig. 1(b) and 3(a). When Xe-lamp irradiation and ultrasonication were simultaneously provided, all BaTiO3/CeO2 products showed better catalytic ability than only light irradiation or ultrasonic stimulated, as shown in Fig. 4(g) and (h). In particular, BaTiO3/CeO2-3 showed the best piezo-photocatalytic activity, degrading the RhB concentration to about 30% in 2 h with simulated light irradiation and ultrasonic vibration stimulated simultaneously. The oxidation reaction rate constant of BaTiO3/CeO2-3 (k × 103 = 9.18 min−1) was the largest one in this work, even 12.4 and 45.9 times as large as its own photocatalytic oxidation (k × 103 = 0.74 min−1) and piezocatalytic oxidation (k × 103 = 0.2 min−1), respectively.
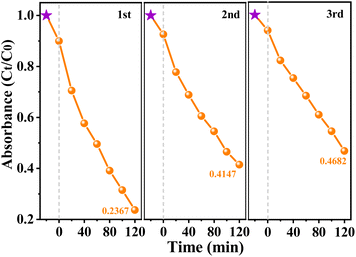
The stability of the piezo-photocatalysts were verified by repeating the piezo-photocatalysis experiment for three times via recycling BaTiO3/CeO2-3 sample with the best performance, and the results are shown in Fig. 5. In the same external environments, Xe-lamp irradiation and ultrasonication being provided simultaneously for 2 hours, about 18% decreasing catalytic performance was observed in the second cycle, but smaller reduction between the third and the second cycle. Meanwhile, changes in the phase and microstructures of BaTiO3/CeO2-3 sample were not observed before and after three piezo-photocatalytic cycles (Fig. S3†). These results imply that BaTiO3/CeO2-3 nanoparticles can be recycled and maintain a certain piezo-photocatalytic ability even after a long time of Xe-lamp irradiation and ultrasonic vibration.
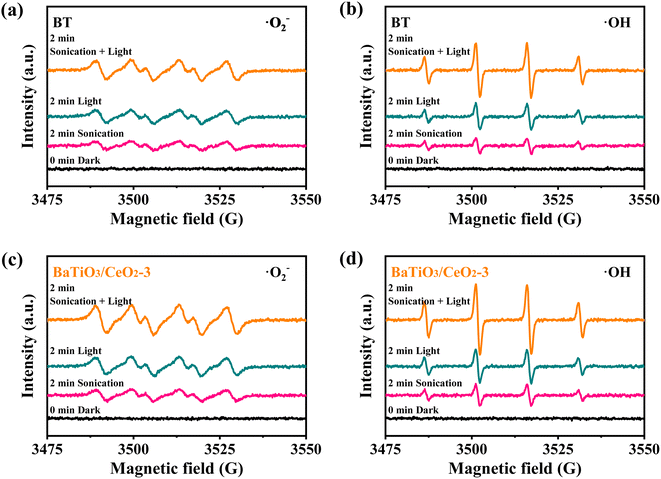
3.3 Mechanism analysis
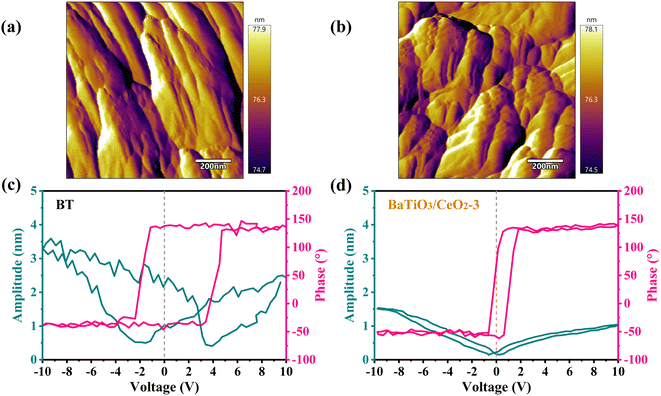
The ability of BT and BaTiO3/CeO2-3 to generate ˙O2− and ˙OH radicals under different excitations (dark, sonication for piezocatalysis, light for photocatalysis, and sonication + light for piezo-photocatalysis) were verified by ESR using DMPO as a spin trapper. As shown in Fig. 6, BT and BaTiO3/CeO2-3 almost had no radical signals in darkness without other excitations. Weak signals appeared only after 2 min of sonication and 2 min of light irradiation. The response with sonication and light applied simultaneously for 2 min was stronger, meaning that the contribution of a single incentive to the catalysis was actually weak. When the piezocatalysis was weaker but photocatalysis was stronger than that of BT, BaTiO3/CeO2-3 produced the highest radical signal while the illumination and ultrasonic excitation were simultaneously applied. This phenomenon was consistent with the results of RhB degradation by BT and BaTiO3/CeO2-3, and it also indicated that photocatalysis played a more important role in enhancing the catalytic ability of the product.The local nanoscale piezoelectric response of pure BT and BaTiO3/CeO2-3, which were spin coated on FTO conductive glass, was investigated by PFM. The topographic images, square phase hysteresis loops, and clear “butterfly shape” amplitude loops are shown in Fig. 7. The morphologies of BT (Fig. 7(a)) and BaTiO3/CeO2-3 (Fig. 7(b)) were similar to the SEM and TEM results, even if they were affected by the spin coating. The phase reversal of BT, (pink curve in Fig. 7(c)) was close to 180° with an applied voltage from +10 V to −10 V, suggesting the existence of 180° domain structures and polarization-conversion behaviors. The expanded “butterfly shape” amplitude loop (cyan curve in Fig. 7(c)) verified obvious piezoelectric response in BT. The deviation from the 0 axis of the “butterfly shape” amplitude loop also indicated the existence of spontaneous polarization and internal electric field in BT.34,35 However, the phase-reversal voltage (pink curve in Fig. 7(d)) and the maximum electrically induced displacements (cyan curve in Fig. 7(d)) of BaTiO3/CeO2-3 became lower than those of BT, although the “butterfly shape” amplitude loop also shifted toward a positive voltage more obviously as Fig. S5.† These results indicated the lower electroinduced deformation response of BaTiO3/CeO2-3 and weaker piezoelectric activity response to external stress than that of BT. These findings also explained the better piezoelectric catalytic degradation of RhB by BT than that by BaTiO3/CeO2-3.
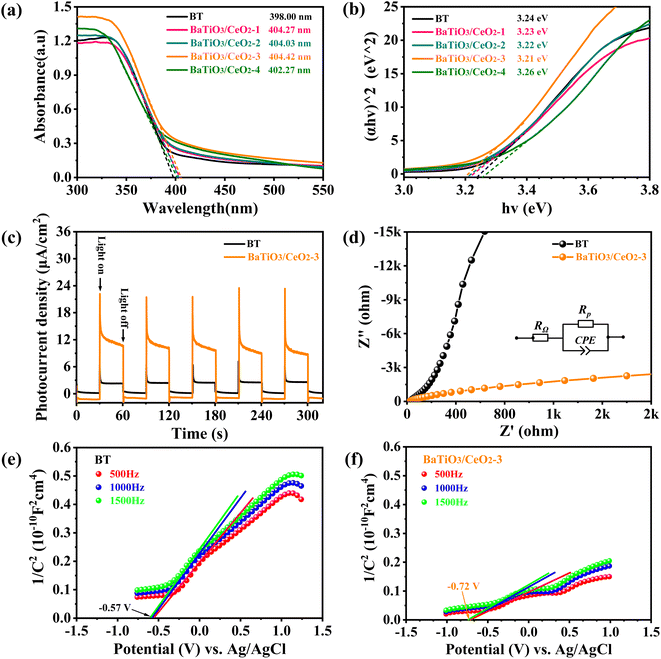
The UV-vis absorption spectra of BaTiO3/CeO2 products were obtained, and the results are shown in Fig. 8(a). The light-absorption edge of all samples were approximately 400 nm. Although the light-absorption edge and the light-absorption capacity in the visible region of the products were very close, those of BaTiO3/CeO2-3 was the optimum. Based on the UV-vis DRS data, the bandgaps (Eg) of BaTiO3/CeO2 products were calculated using the Tauc plot method according to the following formula:
| (αhν)1/n = A(hν − Eg) | (1) |
The photocurrent–time response curves and EIS curves of BT and BaTiO3/CeO2-3 observe are shown in Fig. 8(c) and (d). We observed that BaTiO3/CeO2-3 had significantly higher current density, more significant data jitter at the moment of light on or off, and smaller semicircle marking a smaller interfacial resistance. An appropriate amount of Ce3+ and oxygen vacancies existing in BT and CeO2 extended the absorption edge of product and separated the photoinduced e−–h+ pairs from recombination, so BaTiO3/CeO2-3 exhibited stronger light response and smaller interfacial impedance compared with BT.26,32,33
Mott–Schottky tests at 500, 1000, and 1500 Hz, respectively, were performed to calculate the energy-band structures of BT and BaTiO3/CeO2-3,29 and results are shown in Fig. 5(e) and (f). The slopes of Mott–Schottky plots were all positive in BT and BaTiO3/CeO2-3, indicating that both had the characteristics of an n-type semiconductor. Their flat-band potentials were obtained as −0.57 and −0.72 V (vs. Ag/AgCl), respectively, by extending the straight part of Mott–Schottky curves to intersect with the x-axis. Their ECBs were evaluated to be −0.37 and −0.52 eV (vs. NHE), converted by the formula ECB(NHE) = Efb(Ag/AgCl) + 0.197 eV.36 The Eg of pure BT and BaTiO3/CeO2-3 had been obtained as 3.24 and 3.21 eV, respectively, as shown in Fig. 8(b). Hence, the EVB of BT and BaTiO3/CeO2-3 were further estimated to be 2.87 and 2.69 eV, respectively, according to the formula EVB = ECB + Eg.
Based on the above estimation, the CB and VB of BT were located at −0.37 and 2.87 eV, respectively, and those of BaTiO3/CeO2-3 were at −0.52 and 2.69 eV, respectively. The energy-band structures of BT and BaTiO3/CeO2-3 are shown in Fig. 9(a). The possible catalytic degradation mechanism was speculated, as shown in Fig. 9(b). Pure BT nanoparticles possessed almost no catalytic activity with only light irradiation due to their intrinsic insulation and poor semiconducting activity. However, for BaTiO3/CeO2 nanoparticles synthesized by gel-assisted hydrothermal method, the transformation of the crystal phase in the XRD results and the existence of Ce3+ and ROS in the XPS results confirmed that part of Ce entered the ABO3 lattice or transformed from Ce4+ to Ce3+ in CeO2. Consequently, the piezoelectric properties and generation of oxygen vacancies in products decreased. When simulated sunlight irradiation was provided, many photoinduced e−'s were excited from the VB to the CB and then h+'s were abandoned in the VB of BaTiO3/CeO2 nanoparticles. Meanwhile, the built-in electric field created by the piezoelectric effect can provide a force to drive the separation of carriers, thereby promoting the migration of electrons e−–h+ pairs with continuous ultrasonic stimulation. Consequently, the recombination of internal carriers was suppressed, and the lifetime of photoinduced carries was prolonged. Thus, light stimulation was the key factor for the catalytic activity of BaTiO3/CeO2 nanoparticles, but external stress was more effective for that of BT. The coordination of piezoelectric effect and photocatalysis can significantly improve the piezo-photocatalytic activity of BT and BaTiO3/CeO2 nanoparticles. As shown in Fig. 9(a), compared with that of BT, the ECB of BaTiO3/CeO2-3 was also more negative than the standard redox potential of O2/˙O2− (−0.046 eV vs. NHE), and the EVB was closer to the redox potential of H2O/˙OH (2.27 eV vs. NHE).37–39 Therefore, the reduction reaction of O2 obtaining e− to form ˙O2− was more likely to occur and more h+ remained on the VB. The strong oxidation activity of ˙O2− and the high oxidizing ability of h+ benefited the degradation of organic pollutants.
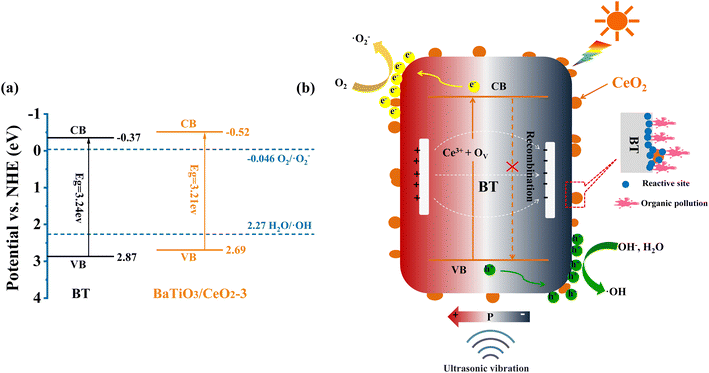 | ||
| Fig. 9 Energy-band structure of BT and BaTiO3/CeO2 (a). Possible piezo-photocatalytic degradation mechanism of BaTiO3/CeO2 (b). | ||
4. Conclusions
BaTiO3/CeO2 nanoparticles with heterogeneous structure were synthesized via a gel-assisted hydrothermal method. Ce3+ and vacancies were successfully formed in BaTiO3/CeO2 products, and their concentration can reach a proper state by adjusting the initial original ratio, resulting in better piezo-photocatalysis of the corresponding products. Compared with that of BT, the response of as-prepared BaTiO3/CeO2 composites to simulated light stimulation became stronger, inducing the products containing Ce to exhibit higher photocatalytic activity. In particular, BaTiO3/CeO2-3 with a Ti/Ce molar ratio of 0.875![[thin space (1/6-em)]](https://www.rsc.org/images/entities/char_2009.gif) :
:![[thin space (1/6-em)]](https://www.rsc.org/images/entities/char_2009.gif) 0.125 in the dried gel showed the best piezo-photocatalytic performance, degrading the RhB content to about 30% in 2 h with light irradiation and ultrasonic vibration stimulated simultaneously, even if its piezoelectricity became much weaker than that of pure BT. An appropriate amount of Ce3+ and vacancies was the key factor affecting photocatalytic enhancement because they extended the absorption edge of the product and separated the photoinduced e−–h+ pairs from recombination. The built-in electric field caused by the piezoelectric properties of the material and the external stress was the reason for the further improvement in catalytic activity.
0.125 in the dried gel showed the best piezo-photocatalytic performance, degrading the RhB content to about 30% in 2 h with light irradiation and ultrasonic vibration stimulated simultaneously, even if its piezoelectricity became much weaker than that of pure BT. An appropriate amount of Ce3+ and vacancies was the key factor affecting photocatalytic enhancement because they extended the absorption edge of the product and separated the photoinduced e−–h+ pairs from recombination. The built-in electric field caused by the piezoelectric properties of the material and the external stress was the reason for the further improvement in catalytic activity.
Author contributions
Xia Li: conceptualization, experiment, formal analysis, writing – original draft. Hongjuan Zheng: experiment, writing – review & editing. Jingjin Liu: writing – review & editing. Jing Wang: formal analysis, supporting. Kang Yan: formal analysis, supporting. Jinsong Liu: formal analysis, supporting. Feng Dang: formal analysis, supporting. Kongjun Zhu: conceptualization, funding acquisition, writing – review & editing.Conflicts of interest
The authors declare that they have no known competing financial interests or personal relationships that could have appeared to influence the work reported in this paper.Acknowledgements
This work is supported by the National Natural Science Foundation of China (NSFC No. U1904213 and 52202137), a Project Funded by the Priority Academic Program Development of Jiangsu Higher Education Institutions (PAPD), and State Key Laboratory of Mechanics and Control of Mechanical Structures (Nanjing University of Aeronautics and Astronautics) (MCMS-E-0521G02).References
- L. Persson, B. M. Carney Almroth, C. D. Collins, S. Cornell, C. A. de Wit, M. L. Diamond, P. Fantke, M. Hassellöv, M. MacLeod, M. W. Ryberg, P. Søgaard Jørgensen, P. Villarrubia-Gómez, Z. Wang and M. Z. Hauschild, Outside the Safe Operating Space of the Planetary Boundary for Novel Entities, Environ. Sci. Technol., 2022, 56, 1510–1521, DOI:10.1021/acs.est.1c04158.
- M. Brauer, B. Casadei, R. A. Harrington, R. Kovacs, K. Sliwa, M. Brauer, N. Davaakhuu, M. Hadley, D. Kass, M. Miller, M. C. Escamilla Nunez, D. P. Ta-Chen Su, I. C. H. Vaartijes and R. Vedanthan, Taking a Stand against Air Pollution—The Impact on Cardiovascular Disease, Circulation, 2021, 143, E800–E804, DOI:10.1161/CIRCULATIONAHA.120.052666.
- B. C. Hodges, E. L. Cates and J. H. Kim, Challenges and prospects of advanced oxidation water treatment processes using catalytic nanomaterials, Nat. Nanotechnol., 2018, 13, 642–650, DOI:10.1038/s41565-018-0216-x.
- M. Xing, W. Xu, C. Dong, Y. Bai, J. Zeng, Y. Zhou, J. Zhang and Y. Yin, Metal Sulfides as Excellent Co-catalysts for H2O2 Decomposition in Advanced Oxidation Processes, Chem, 2018, 4, 1359–1372, DOI:10.1016/j.chempr.2018.03.002.
- P. Wang, X. Zhou, Y. Zhang, L. Yang, K. Zhi, L. Wang, L. Zhang and X. Guo, Unveiling the mechanism of electron transfer facilitated regeneration of active Fe2+ by nano-dispersed iron/graphene catalyst for phenol removal, RSC Adv., 2017, 7, 26983–26991, 10.1039/c7ra04312k.
- S. Gligorovski, R. Strekowski, S. Barbati and D. Vione, Environmental Implications of Hydroxyl Radicals (˙OH), Chem. Rev., 2015, 115, 13051–13092, DOI:10.1021/cr500310b.
- M. Wang, J. Ioccozia, L. Sun, C. Lin and Z. Lin, Inorganic-modified semiconductor TiO2 nanotube arrays for photocatalysis, Energy Environ. Sci., 2014, 7, 2182–2202, 10.1039/c4ee00147h.
- M. Humayun, F. Raziq, A. Khan and W. Luo, Modification strategies of TiO2 for potential applications in photocatalysis: A critical review, Green Chem. Lett. Rev., 2018, 11, 86–102, DOI:10.1080/17518253.2018.1440324.
- S. K. Ray, J. Cho and J. Hur, A critical review on strategies for improving efficiency of BaTiO3-based photocatalysts for wastewater treatment, J. Environ. Manage., 2021, 290, 112679, DOI:10.1016/j.jenvman.2021.112679.
- N. Tian, C. Hu, J. Wang, Y. Zhang, T. Ma and H. Huang, Layered bismuth-based photocatalysts, Coord. Chem. Rev., 2022, 463, 214515, DOI:10.1016/j.ccr.2022.214515.
- A. Ali, L. Chen, M. S. Nasir, C. Wu, B. Guo and Y. Yang, Piezocatalytic removal of water bacteria and organic compounds: a review, Environ. Chem. Lett., 2023, 21, 1075–1092, DOI:10.1007/s10311-022-01537-3.
- Z. Jiang, X. Tan and Y. Huang, Piezoelectric effect enhanced photocatalysis in environmental remediation: State-of-the-art techniques and future scenarios, Sci. Total Environ., 2022, 806, 150924, DOI:10.1016/j.scitotenv.2021.150924.
- X. Zhou, B. Shen, A. Lyubartsev, J. Zhai and N. Hedin, Semiconducting piezoelectric heterostructures for piezo- and piezophotocatalysis, Nano Energy, 2022, 96, 107141, DOI:10.1016/j.nanoen.2022.107141.
- L. Pan, S. Sun, Y. Chen, P. Wang, J. Wang, X. Zhang, J. J. Zou and Z. L. Wang, Advances in Piezo-Phototronic Effect Enhanced Photocatalysis and Photoelectrocatalysis, Adv. Energy Mater., 2020, 10, 1–25, DOI:10.1002/aenm.202000214.
- D. Masekela, N. C. Hintsho-Mbita, S. Sam, T. L. Yusuf and N. Mabuba, Application of BaTiO3-based catalysts for piezocatalytic, photocatalytic and piezo-photocatalytic degradation of organic pollutants and bacterial disinfection in wastewater: A comprehensive review, Arabian J. Chem., 2023, 16, 104473, DOI:10.1016/j.arabjc.2022.104473.
- S. Gao, H. Xing, J. Zhang, Y. Liu, H. Du, Z. Zhu, J. Wang, X. Li, S. Zhang, Y. Yao and L. Ren, Oxalic acid functionalization of BaTiO3 nanobelts for promoting their piezo-degradation organic contaminants, J. Materiomics, 2021, 7, 1275–1283, DOI:10.1016/j.jmat.2021.03.002.
- R. Su, H. A. Hsain, M. Wu, D. Zhang, X. Hu, Z. Wang, X. Wang, F. tang Li, X. Chen, L. Zhu, Y. Yang, Y. Yang, X. Lou and S. J. Pennycook, Nano-Ferroelectric for High Efficiency Overall Water Splitting under Ultrasonic Vibration, Angew. Chem., Int. Ed., 2019, 58, 15076–15081, DOI:10.1002/anie.201907695.
- S. L. Guo, S. N. Lai and J. M. Wu, Strain-Induced Ferroelectric Heterostructure Catalysts of Hydrogen Production through Piezophototronic and Piezoelectrocatalytic System, ACS Nano, 2021, 15, 16106–16117, DOI:10.1021/acsnano.1c04774.
- Y. Li, R. Li, Y. Zhai, Y. Huang, S. Lee and J. Cao, Improved photocatalytic activity of BaTiO3/La2Ti2O7 heterojunction composites via piezoelectric-enhanced charge transfer, Appl. Surf. Sci., 2021, 570, 151146, DOI:10.1016/j.apsusc.2021.151146.
- J. Feng, J. Sun, X. Liu, J. Zhu, S. Tian, R. Wu and Y. Xiong, Coupling effect of piezomaterial and DSA catalyst for degradation of metronidazole: Finding of induction electrocatalysis from remnant piezoelectric filed, J. Catal., 2020, 381, 530–539, DOI:10.1016/j.jcat.2019.11.037.
- J. Shi, W. Zeng, Z. Dai, L. Wang, Q. Wang, S. Lin, Y. Xiong, S. Yang, S. Shang, W. Chen, L. Zhao, X. Ding, X. Tao and Y. Chai, Piezocatalytic Foam for Highly Efficient Degradation of Aqueous Organics, Small Sci., 2021, 1, 2000011, DOI:10.1002/smsc.202000011.
- L. Wan, W. Tian, N. Li, D. Chen, Q. Xu, H. Li, J. He and J. Lu, Hydrophilic porous PVDF membrane embedded with BaTiO3 featuring controlled oxygen vacancies for piezocatalytic water cleaning, Nano Energy, 2022, 94, 106930, DOI:10.1016/j.nanoen.2022.106930.
- W. Qian, K. Zhao, D. Zhang, C. R. Bowen, Y. Wang and Y. Yang, Piezoelectric Material-Polymer Composite Porous Foam for Efficient Dye Degradation via the Piezo-Catalytic Effect, ACS Appl. Mater. Interfaces, 2019, 11, 27862–27869, DOI:10.1021/acsami.9b07857.
- P. Senthilkumar, D. A. Jency, T. Kavinkumar, D. Dhayanithi, S. Dhanuskodi, M. Umadevi, S. Manivannan, N. V. Giridharan, V. Thiagarajan, M. Sriramkumar and K. Jothivenkatachalam, Built-in Electric Field Assisted Photocatalytic Dye Degradation and Photoelectrochemical Water Splitting of Ferroelectric Ce Doped BaTiO3 Nanoassemblies, ACS Sustain. Chem. Eng., 2019, 7, 12032–12043, DOI:10.1021/acssuschemeng.9b00679.
- K. Wu, Y. Sun, J. Liu, J. Xiong, J. Wu, J. Zhang, M. Fu, L. Chen, H. Huang and D. Ye, Nonthermal plasma catalysis for toluene decomposition over BaTiO3-based catalysts by Ce doping at A-sites: The role of surface-reactive oxygen species, J. Hazard. Mater., 2021, 405, 124156, DOI:10.1016/j.jhazmat.2020.124156.
- Y. Ma, W. Gao, Z. Zhang, S. Zhang, Z. Tian, Y. Liu, J. C. Ho and Y. Qu, Regulating the surface of nanoceria and its applications in heterogeneous catalysis, Surf. Sci. Rep., 2018, 73, 1–36, DOI:10.1016/j.surfrep.2018.02.001.
- W. Ren, D. Tang, M. Huang, J. Sun and K. Lv, Remarkable improved electro-Fenton efficiency by electric-field-induced catalysis of CeO2, J. Hazard. Mater., 2018, 350, 88–97, DOI:10.1016/j.jhazmat.2018.02.018.
- J. L. H. Clabel, I. T. Awan, G. Lozano, M. A. Pereira-Da-Silva, R. A. Romano, V. A. G. Rivera, S. O. Ferreira and E. Marega, Understanding the electronic properties of BaTiO3 and Er3+ doped BaTiO3 films through confocal scanning microscopy and XPS: The role of oxygen vacancies, Phys. Chem. Chem. Phys., 2020, 22, 15022–15034, 10.1039/d0cp01010c.
- X. Zhou, S. Wu, C. Li, F. Yan, H. Bai, B. Shen, H. Zeng and J. Zhai, Piezophototronic effect in enhancing charge carrier separation and transfer in ZnO/BaTiO3 heterostructures for high-efficiency catalytic oxidation, Nano Energy, 2019, 66, 104127, DOI:10.1016/j.nanoen.2019.104127.
- B. Liu, C. Li, G. Zhang, X. Yao, S. S. C. Chuang and Z. Li, Oxygen Vacancy Promoting Dimethyl Carbonate Synthesis from CO2 and Methanol over Zr-Doped CeO2 Nanorods, ACS Catal., 2018, 8, 10446–10456, DOI:10.1021/acscatal.8b00415.
- D. Yang, Y. Xu, K. Pan, C. Yu, J. Wu, M. Li, F. Yang, Y. Qu and W. Zhou, Engineering surface oxygen vacancy of mesoporous CeO2 nanosheets assembled microspheres for boosting solar-driven photocatalytic performance, Chin. Chem. Lett., 2022, 33, 378–384, DOI:10.1016/j.cclet.2021.06.035.
- S. Yuán, B. Xu, Q. Zhang, S. Liu, J. Xie, M. Zhang and T. Ohno, Development of the Visible-Light Response of CeO2−x with a high Ce3+ Content and Its Photocatalytic Properties, ChemCatChem, 2018, 10, 1267–1271, DOI:10.1002/cctc.201701767.
- B. Choudhury, P. Chetri and A. Choudhury, Oxygen defects and formation of Ce3+ affecting the photocatalytic performance of CeO2 nanoparticles, RSC Adv., 2014, 4, 4663–4671, 10.1039/c3ra44603d.
- B. Dai, H. Huang, F. Wang, C. Lu, J. Kou, L. Wang and Z. Xu, Flowing water enabled piezoelectric potential of flexible composite film for enhanced photocatalytic performance, Chem. Eng. J., 2018, 347, 263–272, DOI:10.1016/j.cej.2018.04.008.
- P. Zhu, Y. Chen and J. Shi, Piezocatalytic Tumor Therapy by Ultrasound-Triggered and BaTiO3-Mediated Piezoelectricity, Adv. Mater., 2020, 32, 1–8, DOI:10.1002/adma.202001976.
- M. Song, K. Qi, Y. Wen, X. Zhang, Y. Yuan, X. Xie and Z. Wang, Rational design of novel three-dimensional reticulated Ag2O/ZnO Z-scheme heterojunction on Ni foam for promising practical photocatalysis, Sci. Total Environ., 2021, 793, 148519, DOI:10.1016/j.scitotenv.2021.148519.
- D. Jiao, F. Chen, S. Wang, Y. Wang, W. Li and Q. He, Preparation and study of photocatalytic performance of a novel Z-scheme heterostructured SnS2/BaTiO3 composite, Vacuum, 2021, 186, 110052, DOI:10.1016/j.vacuum.2021.110052.
- J. Zhang, H. Maimaitizi, T. Zhang, Y. Tursun, D. Talifu and A. Abulizi, Facile one-step sonochemical synthesis of AgCl quantum dots with enhanced photocatalytic activity and its size effects, Funct. Mater. Lett., 2020, 13, 20511036, DOI:10.1142/S1793604720510364.
- K. Wei, B. Wang, J. Hu, F. Chen, Q. Hao, G. He, Y. Wang, W. Li, J. Liu and Q. He, Photocatalytic properties of a new Z-scheme system BaTiO3/In2S3 with a core-shell structure, RSC Adv., 2019, 9, 11377–11384, 10.1039/c8ra10592h.
Footnotes |
| † Electronic supplementary information (ESI) available. See DOI: https://doi.org/10.1039/d3ra04014c |
| ‡ Co-first author. |
| This journal is © The Royal Society of Chemistry 2023 |

