 Open Access Article
Creative Commons Attribution 3.0 Unported Licence
Molybdenum disulfide (MoS2) along with graphene nanoplatelets (GNPs) utilized to enhance the capacitance of conducting polymers (PANI and PPy)†
Saima Nawazab,
Yaqoob Khanb,
Sadia Khalidb,
Mohammad Azad Malik*c and
Muhammad Siddiq *a
*a
aDepartment of Chemistry, Quaid-i-Azam University, Islamabad 45320, Pakistan. E-mail: m_sidiq12@yahoo.com; Tel: +92 5190642147
bNanoscience and Technology Department, National Centre for Physics, QAU Campus, Shahdra Valley Road, Islamabad 45320, Pakistan
cDepartment of Chemistry, University of Zululand, Private Bag X1001 KwaDlangezwa, 3880, South Africa. E-mail: malikmohammad187@gmail.com; Tel: +44 7403781143
First published on 2nd October 2023
Abstract
Hybrid composites of molybdenum disulfide (MoS2), graphene nanoplatelets (GNPs) and polyaniline (PANI)/polypyrrole (PPy) have been synthesized as cost-effective electrode materials for supercapacitors. We have produced MoS2 from molybdenum dithiocarbamate by a melt method in an inert environment and then used a liquid exfoliation method to form its composite with graphene nanoplatelets (GNPs) and polymers (PANI and PPy). The MoS2 melt/GNP ratio in the resultant composites was 1![[thin space (1/6-em)]](https://www.rsc.org/images/entities/char_2009.gif) :
:![[thin space (1/6-em)]](https://www.rsc.org/images/entities/char_2009.gif) 3 and the polymer was 10% by wt. of the original composite. XRD (X-ray diffraction analysis) confirmed the formation of MoS2 and SEM (scanning electron microscopy) revealed the morphology of the synthesized materials. The electrochemical charge storage performance of the synthesized composite materials was assessed by cyclic voltammetry (CV), electrochemical impedance spectroscopy (EIS) and galvanostatic charge/discharge (GCCD) measurements. Resultant composites showed enhanced electrochemical performances (specific capacitance = 236.23 F g−1, energy density = 64.31 W h kg−1 and power density = 3858.42 W kg−1 for MoS2 melt 5 mPP at a current density of 0.57 A g−1 and had 91.87% capacitance retention after 10
3 and the polymer was 10% by wt. of the original composite. XRD (X-ray diffraction analysis) confirmed the formation of MoS2 and SEM (scanning electron microscopy) revealed the morphology of the synthesized materials. The electrochemical charge storage performance of the synthesized composite materials was assessed by cyclic voltammetry (CV), electrochemical impedance spectroscopy (EIS) and galvanostatic charge/discharge (GCCD) measurements. Resultant composites showed enhanced electrochemical performances (specific capacitance = 236.23 F g−1, energy density = 64.31 W h kg−1 and power density = 3858.42 W kg−1 for MoS2 melt 5 mPP at a current density of 0.57 A g−1 and had 91.87% capacitance retention after 10![[thin space (1/6-em)]](https://www.rsc.org/images/entities/char_2009.gif) 000 charge–discharge cycles) as compared to the produced MoS2; thus, they can be utilized as electrode materials for supercapacitors.
000 charge–discharge cycles) as compared to the produced MoS2; thus, they can be utilized as electrode materials for supercapacitors.
Introduction
Supercapacitors are the next generation of energy storage devices, which bridge the gap between capacitors and batteries. Due to the quick charging and discharging rates of energy storage while having enhanced power density, excellent long cycle life and intermediate specific energy, supercapacitors have huge potential to replace batteries in the energy sector. They are a better fit for work environments where the equipment need urgent power for a brief period, such as in electric automobiles (e.g., in emergency doors on the Air-bus A380). Supercapacitors are categorized into two types based on the mechanism of charge storage: pseudocapacitors and electric double-layer capacitors (EDLCs). Materials having energy storage as a consequence of quick and reversible redox phenomena fall under the category of pseudocapacitors, e.g., conducting polymers and oxides of transition metals. The energy storage mechanism of EDLCs is mainly an ion absorption phenomenon occurring at the electrical double layer present at the electrode/electrolyte interface. Carbon-based materials possessing higher surface areas are the most used ingredients in the supercapacitor domain and are included in EDLCs, which display lower specific capacitance in comparison to pseudocapacitors.1–10 Faradaic pseudocapacitors are typically categorized into two classes, i.e., redox pseudocapacitance (redox reactions occur at the surface/near-surface) and intercalation pseudocapacitance (counter-ions of electrolyte intercalate inside layers existing in the active material of the electrode along with faradaic charge-transfer without any phase transitions).11,12To accomplish better electrochemical performance, various chemical and structural changes have been made to traditional materials that were previously used in the supercapacitor industry or the hybridization of these materials is done, resulting in hybrid composite systems with the synergistic effects of each constituent material. These resultant nanocomposites/hybrids integrate the beneficial characteristics and compensate for the disadvantageous attributes linked with each component. Carbon and transition metal (oxides, hydroxides and dichalcogenides)-based materials are among the most studied materials for the active ingredients of electrodes for the supercapacitor domain.13
Carbon and its allotropes possess superior properties of larger surface area-to-weight ratios, higher electrical conductivities, better electrochemical stability and long cycle lives and, therefore, are widely used materials for electrodes of EDLC supercapacitors. From activated carbon to carbon nanotubes (CNTs), mesoporous carbon and hierarchical templated carbons, many evolutionary studies are being conducted to achieve better electrochemical storage performance.14 Graphene, being expensive, and reduced graphene oxide, being of relatively high cost and having significant defects in structure even after reduction, are not so promising as reinforcements of composites.15 Graphene nanoplatelets (GNPs) have emerged as the most promising, attractive and ideal reinforcing material because of their superior properties such as low cost, high structural integrity, high aspect ratio, extraordinary mechanical properties, and good electrical and thermal conductivity.16 The era of GNPs/polymer hybrid nanocomposites has just begun and appears to be a very small piece of a huge cake due to the cost-effective GNPs that have the benefits of reduced graphene oxide, carbon nanotubes and silicate layers.15 GNPs can transform plastic into an electrical capacitor, making it the ideal material for electronic devices.17
In contrast, pseudo-capacitive materials for electrodes of supercapacitors including some transition metal dichalcogenides (TMDs) and conducting polymers (CPs) store more electrochemical energy due to fast reversible redox phenomena (surface-controlled).18 TMDs typically exhibit large theoretical capacitance and higher specific surface area, which have been extensively researched in the field of high-performance supercapacitors.19–22 Among several TMDs, molybdenum disulfide (MoS2) is regarded as an exceptional electrode material. MoS2 has a layered structure akin to graphene and covalent bonding of S–Mo–S via van der Waals interactions inside its system, Pt-like electronic features and relatively high theoretical specific capacitance.23–25 High-performance charge storage and conversion devices require higher electron transfer efficiency and better electrolyte infiltration, both of which are made possible by the layered structure.26–28 However, weak conductivity along with a lack of sufficient electrochemically active sites severely limits its practical applicability. It has been proven by previous reports that doping of heteroatoms in the structure and phase engineering of MoS2 are efficient approaches to getting around its intrinsic constraints and ultimately improving its electrocatalytic and electrochemical charge storage performance.25
Among the several CPs, polyaniline (PANI) and polypyrrole (PPy) are notably appealing options because of their simple synthesis, environmental stability and controllable higher electrical conductivity (due to the presence of delocalized p-electrons along the backbone in its conjugated structure).29,30 Being a pseudocapacitive electrode material with a high theoretical specific capacitance carries several benefits. They also have short ionic transport path lengths that enable quicker ionic diffusion inside the network of the polymer due to which energy is ultimately supplied very quickly.31 The interaction of a large surface area of CPs with the electrolyte material enables relatively faster rates of charging and discharging. However, there is a disadvantage of volume change (swelling and shrinking) associated with the phenomena of doping-dedoping, which results in much reduced mechanical attributes and low cycling stability when CPs are utilized as the electrode material on their own (i.e. without any doping/hybridization) for supercapacitors.32,33 Sonication and irradiation techniques during manufacturing or hybridization with different types of fillers are among the methods employed to address this problem. These methods ultimately increase the volume of CPs, provide room for their swelling and improve porosity.31 Previous reports confirmed that compositing CPs with other materials (e.g. carbon-based materials, inorganic sulfides, oxides and hydroxides and various other metal compounds) enhances the capacitance and improves the cyclic stability of resultant composites.6,31,34–41
The novelty of this research is mainly the synthesis of hybrid composites of MoS2, GNPs and PANI/PPy as the cost-effective electrode materials for supercapacitors. The objective is to assess the effects of all constituent materials of the composites on the overall charge storage performance of the electrode. In this work, we produced MoS2 from molybdenum dithiocarbamate by a melt method in an inert environment and then used a liquid exfoliation method to form its composite with graphene nanoplatelets (GNPs) and polymers (polyaniline and polypyrrole). The resultant composites showed enhanced electrochemical performances as compared to the produced MoS2 so they can be utilized as electrode materials for supercapacitors.
Experimental
Materials
Analytical-grade chemical reagents were obtained from Sigma-Aldrich and were employed directly without any further modification. Graphene nanoplatelets, i.e., GNPs (M5 i.e. Grade M with average particle diameters of 5 microns) were purchased from XG Sciences.![[thin space (1/6-em)]](https://www.rsc.org/images/entities/char_2009.gif) :
:![[thin space (1/6-em)]](https://www.rsc.org/images/entities/char_2009.gif) 1) mixture and then sonicated for 1 h in an Elmasonic P70H sonicator (frequency = 37 kHz, amplitude = 40%) to ensure homogeneous mixing while cooling to maintain the temperature at 20 °C. Subsequently, to remove any unexfoliated material from the final dispersion, centrifugation was conducted for 30 min at 6000 rpm (3139 g). GNPs (M5) and polymer (mP or mPP) were dispersed separately in an IPA (isopropanol)/water (1
1) mixture and then sonicated for 1 h in an Elmasonic P70H sonicator (frequency = 37 kHz, amplitude = 40%) to ensure homogeneous mixing while cooling to maintain the temperature at 20 °C. Subsequently, to remove any unexfoliated material from the final dispersion, centrifugation was conducted for 30 min at 6000 rpm (3139 g). GNPs (M5) and polymer (mP or mPP) were dispersed separately in an IPA (isopropanol)/water (1![[thin space (1/6-em)]](https://www.rsc.org/images/entities/char_2009.gif) :
:![[thin space (1/6-em)]](https://www.rsc.org/images/entities/char_2009.gif) 1) mixture in the same manner as used for the MoS2 melt.
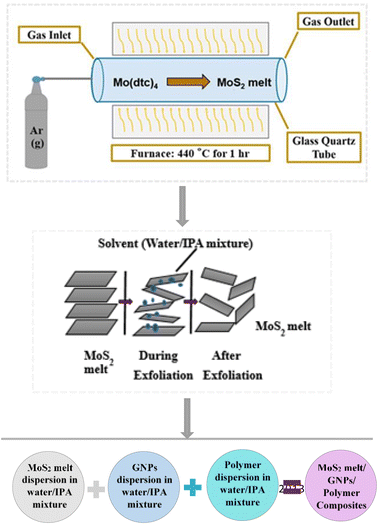
1) mixture in the same manner as used for the MoS2 melt.The three resultant dispersions (MoS2 melt dispersion, M5 dispersion and polymer dispersion) were combined and sonicated for another hour and the solvent was evaporated to obtain the dried composite. The composite with mP was designated as MoS2 melt 5 mP and that with mPP was named MoS2 melt 5 mPP. The MoS2 melt/GNPs ratio in the resultant composite was 1![[thin space (1/6-em)]](https://www.rsc.org/images/entities/char_2009.gif) :
:![[thin space (1/6-em)]](https://www.rsc.org/images/entities/char_2009.gif) 3 and the polymer was 10% by wt. of the original composite (Fig. 1).
3 and the polymer was 10% by wt. of the original composite (Fig. 1).
Characterizations
XRD diffraction patterns of the synthesized samples were obtained via a Bruker D8 Advance diffractometer. SEM was conducted using a field emission microscope of Hitachi Su-70 Schottky. Using the KBr pellet method at room temperature in the 400–4000 cm−1 range, FT-IR spectra were obtained on a Bio-Rad Excalibur FT-IR Spectrometer. The microanalytical lab at the University of Manchester carried out elemental studies by employing a Thermo Scientific Flash 2000 organic elemental analyzer. Thermogravimetric analysis was conducted utilizing a Seiko SSC/S200 model in an environment of nitrogen while maintaining a heating rate of 10 °C min−1. Raman spectra were obtained on a Renshaw 1000 system, utilizing a 514.5 nm solid-state laser (operating at 10% power). A 50× objective lens was utilised to focus the laser beam onto the synthesized samples. An air-cooled charge-coupled device (CCD) detector was used to detect the scattered signal.Electrochemical measurements
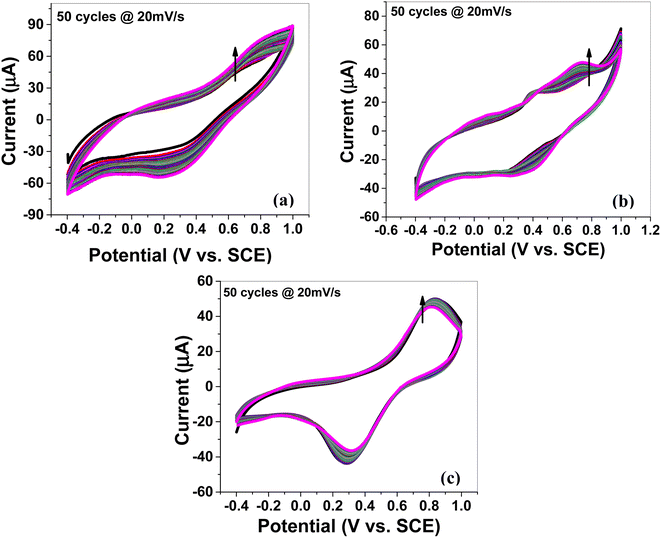
A three-electrode system along with an electrolyte of 1 M H2SO4 aqueous solution was utilized to study the electrochemical characteristics of the synthesized electrode materials. A saturated calomel electrode (SCE) was used as the reference electrode, while a graphite rod was used as the counter electrode. Polytetrafluoroethylene (PTFE), which serves as the binder, was combined with active materials to prepare the working electrodes. Cyclic voltammetry (CV), electrochemical impedance spectroscopy (EIS), and galvanostatic charge/discharge (GCCD) data were gathered by employing the Gamry REF3000 electrochemical workstation. At various scan rates, scans of CV were obtained within a potential window of −0.4–1 V. Moreover, at the scan rate of 20 mV s−1, the cyclic stability of each electrode material was tested for 50 cycles. By integrating the CV curve to obtain the average area under the curve for one complete CV cycle, the specific capacitance (Csp) can be computed by using the relation49 given in eqn (1):
 | (1) |
By employing the formula50 given in eqn (2), one can also estimate the specific capacitance of a three-electrode system using the obtained slope of the discharge curve from GCCD measurements.
 | (2) |
Results and discussion
X-ray diffraction (XRD) analysis
To examine the crystallographic structure of the synthesized electrode materials, X-ray powder diffraction (XRPD) analysis was executed and XRD patterns are shown in Fig. 2. The diffraction pattern of the MoS2 melt (Fig. 2d) corresponds to standard 2H-MoS2 (JCPDS no. 00-002-0132). The peaks related to the (101) and (110) diffraction planes of the MoS2 melt were rather intense but those associated with the (002) and (103) planes were significantly broadened (Fig. 2d). The pattern indicates that MoS2 crystallites might grow laterally in the phenomenon of thermolysis since the planes of (101) and (110) seem to be the preferred growth orientation. There is reduced bulk character in the direction of [00l], as evidenced by the weak reflection of the (002) diffraction plane. This again demonstrated that it was possible to synthesize MoS2 sheets with nanoscale thickness via this chemical reaction pathway. The mP (polyaniline) in Fig. 2b, displays the diffraction peaks at phase angles of 14.4°, 19.6°, and 25.4°, which are associated with the reflections of the (121), (113) and (322) planes, respectively, indicating that mP is in the emeraldine salt form.51,52 Fig. 2c (mPP) shows the characteristic amorphous peaks of typical polypyrrole prepared by using FeCl3 as the oxidant at 12.0°, and 26.1°, which shows that the synthesized mPP (polypyrrole) is amorphous. This was also reported in earlier literature.53,54 Such broad peaks are usually due to the short-range arrangement of polymer chains.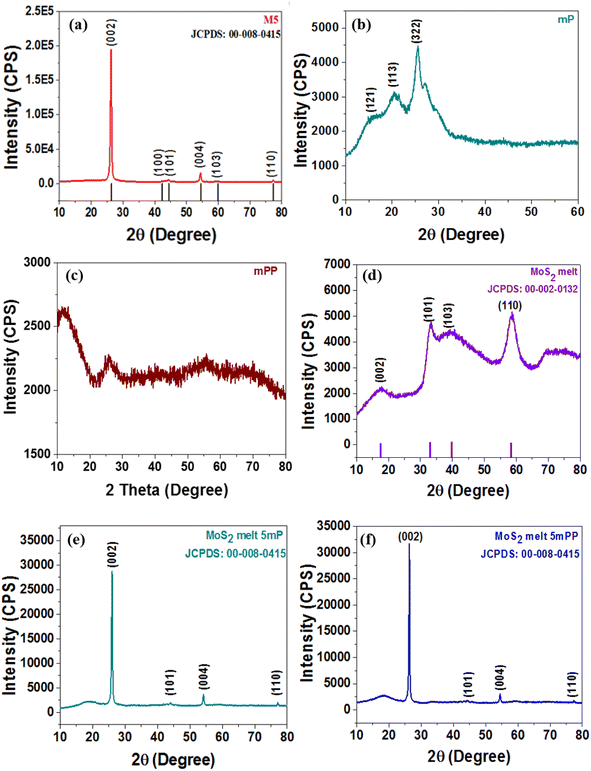 | ||
| Fig. 2 X-ray diffraction (XRD) patterns of (a) M5, (b) mP, (c) mPP, (d) MoS2 melt, (e) MoS2 melt 5 mP and (f) MoS2 melt 5 mPP. | ||
The (002), (100), (101), (004), (103) and (110) crystal planes of M5-GNPs respectively produced peaks at 2θ = 26.3°, 43.3°, 44.3°, 54°, 59.7° and 77.3° (JCPDS no. 00-008-0415) visible in the XRD pattern of M5 (Fig. 2a). The XRD patterns of the composites, MoS2 melt 5 mP (Fig. 2e) and MoS2 melt 5 mPP (Fig. 2f), mainly showed the peaks of M5-GNPs (which is also the major component of the composite electrode material) and the characteristic peaks for PANI/PPy and MoS2 melt seemed to be suppressed (disappeared) in the presence of the high-intensity peaks of M5. M5 is highly crystalline and there is a greater amount in composites as compared to MoS2 and polymers.
Scanning electron microscopy (SEM)
Fig. 3a displays the SEM image of the MoS2 melt, showing large crystallites embedded in the surface of an agglomerated mass formed by the accumulation of MoS2. SEM images of MoS2 melt 5 mP (Fig. 3b) and MoS2 melt 5 mPP (Fig. 3c) show uneven distribution of crystallite along GNPs. The overall appearances of both composites, MoS2 melt 5 mP (Fig. 3b) and MoS2 melt 5 mPP (Fig. 3c), are different, which might be due to the effects of polymers, i.e., mP and mPP, respectively, although no significant appearance of polymers can be seen in these images.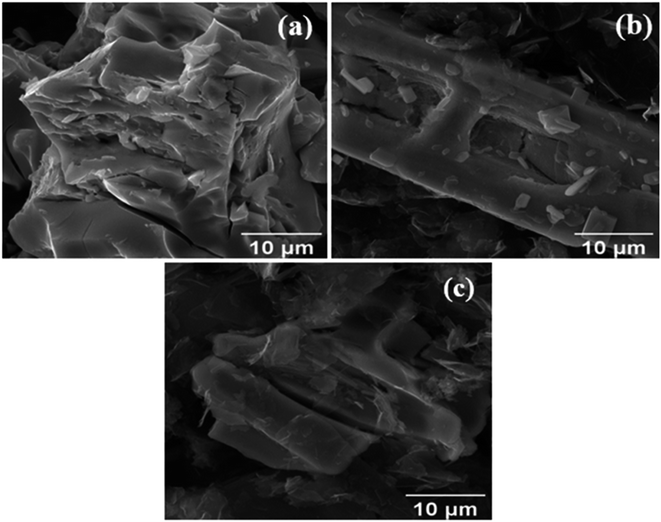 | ||
| Fig. 3 Scanning electron microscopy (SEM) images of the (a) MoS2 melt, (b) MoS2 melt 5 mP and (c) MoS2 melt 5 mPP. | ||
Electrochemical studies
CV at various scan rates. Cyclic voltammetry (CV) was performed in a 1 M aqueous solution of H2SO4 as an electrolyte to study the electrochemical storage performance of the synthesized electrode samples. The CV scans (Fig. 4a–f,) for all synthesized electrode materials (MoS2 melt 5 mPP, MoS2 melt 5 mP, MoS2 melt, M5, mPP and mP) were executed in the potential window of −0.4 to 1 V (versus SCE). The CV for each electrode material was processed at various scan rates in the range of 5 to 250 mV s−1 (i.e., 5, 10, 20, 50, 100, 150, 200 and 250 mV s−1).
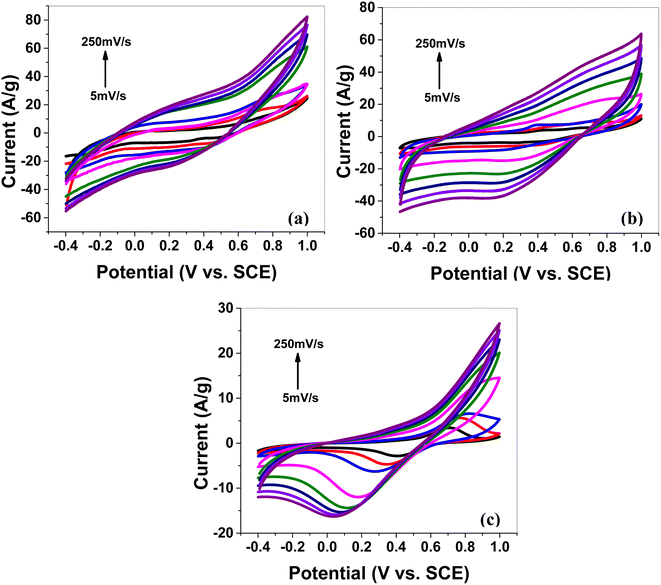 | ||
| Fig. 4 Cyclic voltammetry (CV) of (a) the MoS2 melt 5 mPP, (b) MoS2 melt 5 mP and (c) MoS2 melt at different scan rates on GCE in 1 M H2SO4 vs. SCE. | ||
The cyclic voltammogram of MoS2 melt 5 mPP (Fig. 4a) showed the characteristic square-shaped curve, which is indicative of EDLC at lower scan rates with no evident pseudocapacitance peaks. However, at higher scan rates, the curves diverged from the square shape and showed a combination of square and redox peaks, which implies the changed mechanism of charge storage to fast redox reactions due to pseudocapacitance.55–59
The specific capacitance decreases rapidly on increasing the scan rate, which also reflects the change in the storage mechanism of charge. The relatively slow phenomenon of ion adsorption contributes to the overall capacitive behavior of the electrode dominating at low scan rates but as the speed of the charging/discharging processes increases, a faster phenomenon also occurs, resulting in a lower double-layer capacitance value. This has been observed many times in earlier research on supercapacitors associated with transition metal dichalcogenides (TMDCs).60–63
Eqn (3) can be used to describe a non-faradaic process based on the phenomena of H+ ion adsorption and desorption on the surface and intra-sheets of MoS2, forming a double layer at the interface of the electrolyte/electrode material.
| (MoS2)surface + xH+ + xe− ↔ Hx (MoS2)surface | (3) |
The cyclic votammetry peaks of the MoS2-based electrode could be assigned to the redox phenomenon (given in eqn (4)) of insertion/extraction of H+ into/from the layered structure of the MoS2 material (i.e. Mo-IV ↔ Mo-V ↔ Mo-VI).55,64–66
| MoS2 + xe− + xH+ ↔ Hx (MoS2) | (4) |
The MoS2 melt 5 mPP composite (Fig. 4a) showed the same electrochemical response as the MoS2 melt 5 mP (Fig. 4b) and MoS2 melt (Fig. 4c), but the peak current of the MoS2 melt 5 mPP increased significantly, indicating a higher capacitance of the electrode. The enhanced electrochemical utilization of MoS2 melt 5 mPP is due to the availability of more electroactive sites as a consequence of the favourable configuration of the hybrid nanocomposite for electrochemical storage phenomena.
By comparing the shapes of the cyclic voltammograms of MoS2 melt 5 mPP, MoS2 melt 5 mP, and MoS2 melt (Fig. 4a–c), it was observed that the contribution of the MoS2 melt to the total capacitance of the composite electrodes of MoS2 melt 5 mPP and MoS2 melt 5 mP was of the double-layer type, which is also evident from the CV curves of the MoS2 melt (Fig. 4c). The cyclic voltammogram of M5 (Fig. S4a†) shows the characteristic square-shaped curve, which is indicative of EDLC behavior while CV curves of mPP (Fig. S4b†) and mP (Fig. S4c†) show typical pseudocapacitance behavior. Therefore, M5 contributed diffusion-controlled capacitance and mPP/mP contributed pseudocapacitance to the total capacitance achieved in the case of the hybrid composite of the MoS2 melt 5 mPP/MoS2 melt 5 mP. The GNPs (M5) are higher in composites so their contribution is greater, while that of the polymer (mPP/mP) is less so its pseudocapacitive contribution is less.
The electrochemical behavior of MoS2 melt 5 mPP (Fig. 4a) is better than MoS2 melt 5 mP (Fig. 4b), which might be because in the hybrid composite form, the mPP along with GNPs and MoS2 melt provide a more favourable configurational structure for the flow of charge inside the material as compared to the hybrid composite of the mP along with GNPs and MoS2 melt.
CV curves for synthesized samples (Fig. 4a–c and S4a–c†) are rectangular and are mirror images, indicating high electrochemical reversibility. The specific capacitances (Csp) calculated using eqn (1) for the composite electrodes of MoS2 melt 5 mPP, MoS2 melt 5 mP, and MoS2 melt were 145.39, 91.23 and 33.06 F g−1, respectively, at the scan rate of 5 mV s−1 and 1.4 V potential. The Csp of M5, mPP and mP are 75.48, 55.62 and 28.52 F g−1 respectively (potential = 1.4 V, scan rate = 5 mV s−1).
| i = avb | (5) |
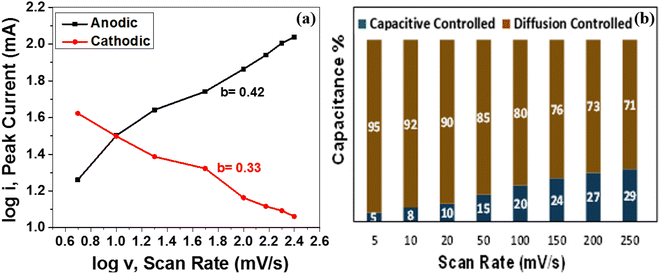 | ||
| Fig. 6 (a) Plot of log(i) versus log(v) for the anodic and cathodic current peaks of MoS2 melt 5 mPP (b) pseudocapacitive contribution (%) of MoS2 melt 5 mPP at different scan rates. | ||
According to the power law, the b-value attained from the slope of the plot of log(i) and log(v) may be used for the estimation of the governing energy storage mechanism of the active electrode material for supercapacitors. In the case of an electrode material being an ideal capacitor type, pseudocapacitive behaviour predominates and the value of b is near to 1. Whereas, for battery-type electrode materials, the b-value is close to 0.5 and has mainly diffusion-controlled behaviour that dominates as the charge storage mechanism. Fig. 6a depicts the plot of log(i) versus log(v) displaying cathodic and anodic peak currents for the MoS2 melt 5 mPP as shown in Fig. 4a. The b-value from the cathodic peak was 0.33, and that of the anodic peak was 0.42. This indicates that the resultant capacitance of the electrode material is primarily because of diffusion-controlled phenomenon and the MoS2 melt 5 mPP composite electrode displays mainly EDLC behaviour as the GNPs and MoS2 melt are the main constituents of hybrid composites so their storage mechanism is also dominant overall in the composite.73–75 By employing the Dunn method of differentiation,76 it was estimated that 5%, 8%, 10%, 15%, 20%, 24%, 27% and 29% of the total capacitance obtained for MoS2 melt 5 mPP is from the pseudocapacitive contribution and 95%, 92%, 90%, 85%, 80%, 76%, 73% and 71% is diffusion controlled behavior at scan rates of 5, 10, 20, 50, 100, 150, 200 and 250 mV s−1, respectively (Fig. 6b).
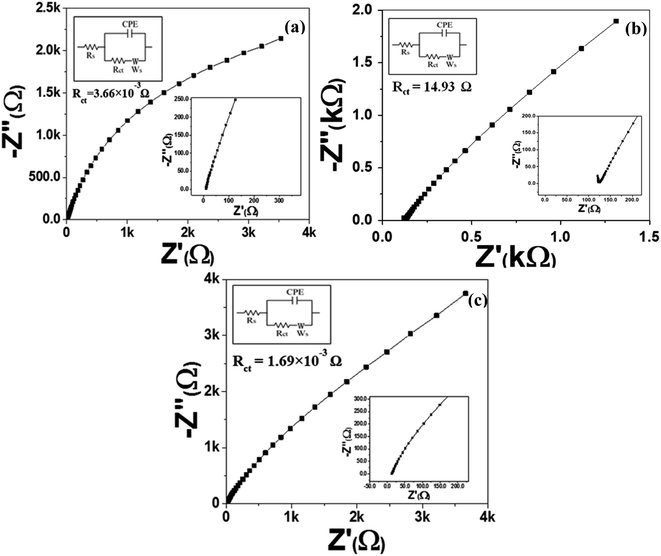 | ||
| Fig. 7 EIS Nyquist plots of (a) MoS2 melt 5 mPP, (b) MoS2 melt 5 mP and (c) MoS2 melt vs. OC in 1 M H2SO4 electrolyte, with equivalent circuit diagrams. | ||
The higher impedance witnessed for the electrode material of MoS2 melt 5 mP in Fig. 7b indicated a high Rct value (14.93 Ω), which may be because of a high hindrance to counter-ion flow inside the hybrid composite of MoS2/GNPs with mP as compared to that of mPP. The Rct value for the MoS2 melt in Fig. 7c is 1.69 × 10⁻³ Ω.
The steeper curve due to the decreased Warburg impedance in Fig. 7a (MoS2 melt 5 mPP) at the low-frequency region illustrates the accelerated rate of adsorption and diffusion phenomena for the counter-ions of electrolytes in/on the electrode material.
The reason for this observation is that the hybrid network of the mPP and MoS2 melt with GNPs has more electroactive sites and provides more spaces with equal and smaller diffusion path lengths used for the transportation of counter-ions of 1 M H2SO4 aqueous electrolyte, subsequently resulting in enhanced electrochemical charge storage performance.
The Nyquist plot (Fig. 7b) for the MoS2 melt 5 mP showed a larger Warburg impedance as compared to the MoS2 melt 5 mPP (Fig. 7a), which might be due to greater variations in path lengths for ion diffusion in the hybrid composite of MoS2/GNPs with mP than that of mPP.
The value of the slope for each synthesized electrode (Fig. 7a–c and S6a–c†) declined as the AC frequency (potential) increased, showing an increased Warburg resistance that, in turn, cuts down the performance of the electrode for effective charge storage.
All electrodes of MoS2 melt 5 mPP, MoS2 melt 5 mP, MoS2 melt, M5, mPP and mP follow the equivalent circuit model of CPE with diffusion as shown in the inset of Fig. 7a–c and S6a–c.†
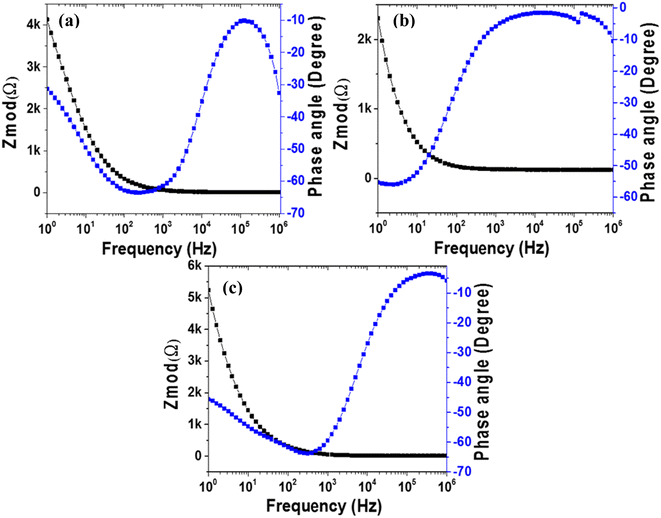
The Bode plot of MoS2 melt 5 mPP in Fig. 8a shows the phase angle of −30.78 in the lower frequency region confirming the pseudocapacitive properties of the electrode.78,82 Bode plots of MoS2 melt 5 mP, MoS2 melt, M5, mPP and mP in Fig. 8a–c and S7a–c† show the phase angles of −55.29, −45.68, −57.90, −59.20 and −59.49, respectively in the lower frequency region.
Significant drops below the value of Φ = −90° indicate that the dielectric layer is less effective at holding electric charge and releases the flow of electrons. This would be because of a decrease in the total impedance as a consequence of current leakage occurring at defective sites present in the heterogeneous dielectric layer.81
The impedance of a capacitor only contains the Z′′ component and is inversely related to the frequency value, so with an increase in frequency, the value of impedance will decrease.83,84 A small value for the impedance (i.e. |Z|) in the low-frequency section can denote the decrease in resistance of the electrode material and an enhanced flow of electrons through the electrode,85 while a high value of |Z| can also indicate suitable capacitive and insulating properties.78,86 Bode magnitude plots of capacitive materials have slopes near −1,87,88 while a slope close to 0 is representative of resistive behavior that might occur in the domain of high frequencies for capacitive behavior.89
The impedance Bode plots (Fig. 8a–c and S7a–c†) of all samples showed high values for the slope in the low-frequency region, which is probably because of resistive behavior occurring at the interfaces; the lowest values of the slope in the high-frequency regions portray the purely capacitive nature of the electrode.90,91
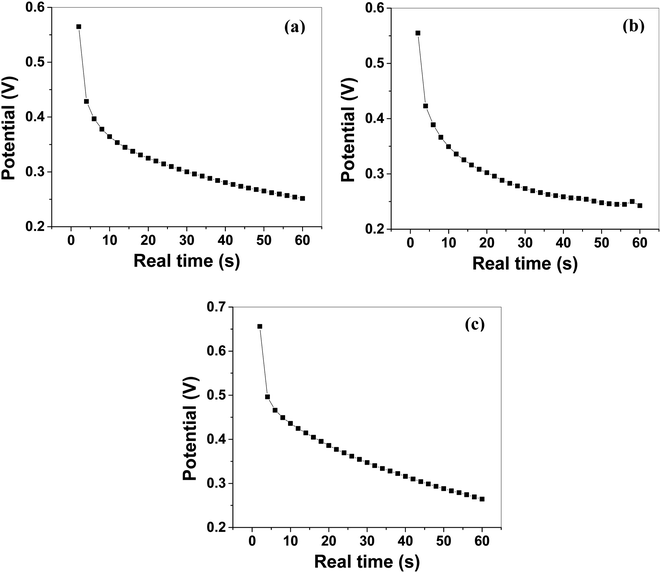
The Csp calculated by using eqn (2) from GCCD measurements for MoS2 melt 5 mPP was 236.23 F g−1 at a current density of 0.57 A g−1. The Csp calculated by GCCD measurement for MoS2 melt 5 mP was 117.15 F g−1 and for the MoS2 melt it was equal to 49.53 F g−1. The Csp calculated by GCCD measurements for M5, mPP and mP electrodes were 90.54, 34.62 and 23.13 F g−1, respectively.
The energy density and power density of MoS2 melt 5 mPP were 64.31 W h kg−1 and 3858.42 W kg−1 at the current density of 0.57 A g−1, and were calculated by using the relations92–94 given in eqn (6) and (7), respectively.
 | (6) |
 | (7) |
The electrochemical results show that in MoS2 melt 5 mPP and MoS2 melt 5 mP composites, GNPs with polymers (mP and mPP) along with MoS2 melt enhance the electroactive sites for charge storage mechanisms as compared to the pristine MoS2 melt and provide shorter and continuous pathways for ion diffusion or charge flow. MoS2 melt 5 mPP shows better electrochemical performance (larger Csp value) than MoS2 melt 5 mP, which shows that in hybrid composite form, mPP along with GNPs and MoS2 melt provides a more favourable configurational structure for the flow of charge inside the material as compared to the hybrid composite of mP along with GNPs and MoS2 melt.
Conclusions
We have reported a cost-effective and facile method for attaining electrode material for supercapacitors with enhanced electrochemical storage performance. We synthesized MoS2 by the thermal decomposition of molybdenum dithiocarbamate in an inert environment and then used a liquid exfoliation method to form their composites with graphene nanoplatelets (GNPs) and polymers (polyaniline and polypyrrole).The electrochemical results show that in the composites MoS2 melt 5 mPP and MoS2 melt 5 mP, GNPs with polymers (mP and mPP) along with MoS2 melt enhanced the electroactive sites for charge storage mechanisms as compared to the pristine MoS2 melt and provided shorter and continuous pathways for ion diffusion or charge flow. The MoS2 melt 5 mPP showed better electrochemical performance (larger Csp of 236.23 F g−1 at a current density of 0.57 A g−1) than the MoS2 melt 5 mP (Csp = 117.15 F g−1), which indicated that the hybrid composite from the mPP and GNPs and MoS2 melt provided a more favourable configurational structure for the flow of charge inside the material as compared to the hybrid composite of mP along with GNPs and MoS2 melt (Csp = 49.53 F g−1). Electrochemical results revealed that the diffusion-controlled contribution to the total achieved a specific capacitance of MoS2/GNPs/conducting polymer-based composites is dominant, which is due to the combined effect of higher quantities of GNPs and MoS2 melt. At a current density of 0.57 A g−1, MoS2 melt 5 mPP provided a specific capacitance of 236.23 F g−1, energy density of 64.31 W h kg−1 and power density of 3858.42 W kg−1. The MoS2 melt 5 mPP composite electrode has a 91.87% capacitance retention after 10![[thin space (1/6-em)]](https://www.rsc.org/images/entities/char_2009.gif) 000 charge–discharge cycles.
000 charge–discharge cycles.
The enhanced electrochemical storage behaviour is credited to the synergistic effect between the constituent materials of hybrid composites. This research work puts forward a facile scalable development route for MoS2 and GNPs-based polymer hybrid composites as potential candidates for scale-up applications in the supercapacitor industry.
Author contributions
MS and MAM: conceptualization, supervision, administration, resources, reviewing and editing, YK: supervision, administration and resources, SK: methodology and investigation, SN: methodology, investigation, formal analysis, writing – original draft preparation, validation and data curation.Conflicts of interest
There are no conflicts to declare.Acknowledgements
Ms. Saima Nawaz acknowledges HEC Pakistan for the six months fellowship (IRSIP) at the University of Manchester. Ms. Saima Nawaz would also like to acknowledge Dr Mark A. Bissette (School of Materials/National Graphene Institute, University of Manchester, UK) for his valuable discussion and support.Notes and references
- P. Simon and Y. Gogotsi, Nat. Mater., 2008, 7, 845–854 CrossRef CAS PubMed.
- Y. Wang, J. Guo, T. Wang, J. Shao, D. Wang and Y.-W. Yang, Nanomaterials, 2015, 5, 1667–1689 CrossRef CAS PubMed.
- Y. Wang, Y. Song and Y. Xia, Chem. Soc. Rev., 2016, 45, 5925–5950 RSC.
- M. F. El-Kady, Y. Shao and R. B. Kaner, Nat. Rev. Mater., 2016, 1, 16033 CrossRef CAS.
- A. Borenstein, O. Hanna, R. Attias, S. Luski, T. Brousse and D. Aurbach, J. Mater. Chem. A, 2017, 5, 12653–12672 RSC.
- J. Yang, Y. Liu, S. Liu, L. Li, C. Zhang and T. Liu, Mater. Chem. Front., 2017, 1, 251–268 RSC.
- E. Pomerantseva and Y. Gogotsi, Nat. Energy, 2017, 2, 17089 CrossRef CAS.
- M. Schalenbach, Y. E. Durmus, H. Tempel, H. Kungl and R.-A. Eichel, Sci. Rep., 2022, 12, 3375 CrossRef CAS PubMed.
- R. Ramkumar and M. Minakshi Sundaram, New J. Chem., 2016, 40, 2863–2877 RSC.
- S. Nawaz, Y. Khan, S. A. M. Abdelmohsen, S. Khalid, E. M. Björk, M. A. Rasheed and M. Siddiq, RSC Adv., 2022, 12, 17228–17236 RSC.
- P. Gao, R. J. Koch, A. C. Ladonis and S. T. Misture, J. Electrochem. Soc., 2020, 167, 160523 CrossRef CAS.
- J. Liu, J. Wang, C. Xu, H. Jiang, C. Li, L. Zhang, J. Lin and Z. X. Shen, Advanced Science, 2018, 5, 1700322 CrossRef PubMed.
- P. Gao, Y. Zeng, P. Tang, Z. Wang, J. Yang, A. Hu and J. Liu, Adv. Funct. Mater., 2022, 32, 2108644 CrossRef CAS.
- A. Yu, A. Sy and A. Davies, Synth. Met., 2011, 161, 2049–2054 CrossRef CAS.
- G. Shi, S. Araby, C. T. Gibson, Q. Meng, S. Zhu and J. Ma, Adv. Funct. Mater., 2018, 28, 1706705 CrossRef.
- A. L. Pang, M. R. Husin, A. Arsad and M. Ahmadipour, J. Mater. Sci.: Mater. Electron., 2021, 32, 9574–9583 CrossRef CAS.
- P. Cataldi, A. Athanassiou and I. S. Bayer, Appl. Sci., 2018, 8, 1438 CrossRef.
- B. Devadas and T. Imae, ACS Sustain. Chem. Eng., 2018, 6, 127–134 CrossRef CAS.
- Y. Liu, P. Hu, H. Liu, J. Song, A. Umar and X. Wu, Inorg. Chem. Front., 2019, 6, 2824–2831 RSC.
- Y. Liu, D. Zhao, H. Liu, A. Umar and X. Wu, Chin. Chem. Lett., 2019, 30, 1105–1110 CrossRef CAS.
- A. Liang, Y. Zhang, F. Jiang, W. Zhou, J. Xu, J. Hou, Y. Wu, Y. Ding and X. Duan, J. Phys. Chem. C, 2019, 123, 25428–25436 CrossRef CAS.
- A. Liang, D. Li, W. Zhou, Y. Wu, G. Ye, J. Wu, Y. Chang, R. Wang, J. Xu and G. Nie, J. Electroanal. Chem., 2018, 824, 136–146 CrossRef CAS.
- M. A. Khan, S. Rathi, C. Lee, D. Lim, Y. Kim, S. J. Yun, D.-H. Youn and G.-H. Kim, ACS Appl. Mater. Interfaces, 2018, 10, 23961–23967 CrossRef CAS PubMed.
- M. Mohiuddin, Y. Wang, A. Zavabeti, N. Syed, R. S. Datta, H. Ahmed, T. Daeneke, S. P. Russo, A. R. Rezk and L. Y. Yeo, Chem. Mater., 2018, 30, 5593–5601 CrossRef CAS.
- K. Le, X. Zhang, Q. Zhao, Y. Liu, P. Yi, S. Xu and W. Liu, ACS Appl. Mater. Interfaces, 2021, 13, 44427–44439 CrossRef CAS PubMed.
- Z. Zhu, Y. Tang, W. R. Leow, H. Xia, Z. Lv, J. Wei, X. Ge, S. Cao, Y. Zhang and W. Zhang, Angew. Chem., 2019, 131, 3559–3564 CrossRef.
- Q. Chen, F. Xie, G. Wang, K. Ge, H. Ren, M. Yan, Q. Wang and H. Bi, Ionics, 2021, 27, 4083–4096 CrossRef CAS.
- Y. Zhang, P. Chen, F. Wen, C. Huang and H. Wang, Ionics, 2016, 22, 1095–1102 CrossRef CAS.
- L. Yu, M. Gan, L. Ma, H. Huang, H. Hu, Y. Li, Y. Tu, C. Ge, F. Yang and J. Yan, Synth. Met., 2014, 198, 167–174 CrossRef CAS.
- Z. Lei, Z. Chen and X. S. Zhao, J. Phys. Chem. C, 2010, 114, 19867–19874 CrossRef CAS.
- G. A. Snook, P. Kao and A. S. Best, J. Power Sources, 2011, 196, 1–12 CrossRef CAS.
- P. Naskar, A. Maiti, P. Chakraborty, D. Kundu, B. Biswas and A. Banerjee, J. Mater. Chem. A, 2021, 9, 1970–2017 RSC.
- R. Ramkumar and M. M. Sundaram, New J. Chem., 2016, 40, 7456–7464 RSC.
- Q. Wu, Y. Xu, Z. Yao, A. Liu and G. Shi, ACS Nano, 2010, 4, 1963–1970 CrossRef CAS PubMed.
- K. Wang, J. Huang and Z. Wei, J. Phys. Chem. C, 2010, 114, 8062–8067 CrossRef CAS.
- T. Liu, L. Finn, M. Yu, H. Wang, T. Zhai, X. Lu, Y. Tong and Y. Li, Nano Lett., 2014, 14, 2522–2527 CrossRef CAS PubMed.
- M. E. Abdelhamid, A. P. O'Mullane and G. A. Snook, RSC Adv., 2015, 5, 11611–11626 RSC.
- A. Eftekhari, L. Li and Y. Yang, J. Power Sources, 2017, 347, 86–107 CrossRef CAS.
- Q. B. Le, T.-H. Nguyen, H. Fei, C. Bubulinca, L. Munster, N. Bugarova, M. Micusik, R. Kiefer, T. T. Dao, M. Omastova, N. E. Kazantseva and P. Saha, Sci. Rep., 2022, 12, 664 CrossRef CAS PubMed.
- M. Rapisarda, F. Marken and M. Meo, Commun. Chem., 2021, 4, 169 CrossRef CAS PubMed.
- Y. Zhang, Q. Wan and N. Yang, Small, 2019, 15, 1903780 CrossRef CAS PubMed.
- M. Decoster, F. Conan, J. Guerchais, Y. Le Mest, J. S. Pala, J. Jeffery, E. Faulques, A. Leblanc and P. Molinié, Polyhedron, 1995, 14, 1741–1750 CrossRef CAS.
- N. Zeng, D. G. Hopkinson, B. F. Spencer, S. G. McAdams, A. A. Tedstone, S. J. Haigh and D. J. Lewis, Chem. Commun., 2019, 55, 99–102 RSC.
- M. Nandi, R. Gangopadhyay and A. Bhaumik, Microporous Mesoporous Mater., 2008, 109, 239–247 CrossRef CAS.
- S. Machida, S. Miyata and A. Techagumpuch, Synth. Met., 1989, 31, 311–318 CrossRef CAS.
- G. Cunningham, M. Lotya, C. S. Cucinotta, S. Sanvito, S. D. Bergin, R. Menzel, M. S. P. Shaffer and J. N. Coleman, ACS Nano, 2012, 6, 3468–3480 CrossRef CAS PubMed.
- A. O'Neill, U. Khan and J. N. Coleman, Chem. Mater., 2012, 24, 2414–2421 CrossRef.
- J. N. Coleman, M. Lotya, A. O'Neill, S. D. Bergin, P. J. King, U. Khan, K. Young, A. Gaucher, S. De and R. J. Smith, Science, 2011, 331, 568–571 CrossRef CAS PubMed.
- M. R. Biradar, A. V. Salkar, P. P. Morajkar, S. V. Bhosale and S. V. Bhosale, New J. Chem., 2021, 45, 5154–5164 RSC.
- Y. Zhao, Y. Xu, J. Zeng, B. Kong, X. Geng, D. Li, X. Gao, K. Liang, L. Xu, J. Lian, S. Huang, J. Qiu, Y. Huang and H. Li, RSC Adv., 2017, 7, 55513–55522 RSC.
- J. Zhou, L. Yu, W. Liu, X. Zhang, W. Mu, X. Du, Z. Zhang and Y. Deng, Sci. Rep., 2015, 5, 17858 CrossRef CAS PubMed.
- L. Ren, G. Zhang, J. Wang, L. Kang, Z. Lei, Z. Liu, Z. Liu, Z. Hao and Z. h. Liu, Electrochim. Acta, 2014, 145, 99–108 CrossRef CAS.
- H. K. Chitte, G. N. Shinde, N. V. Bhat and V. E. Walunj, J. Sens. Technol., 2011, 1, 47 CrossRef CAS.
- H. Eisazadeh, World J. Chem., 2007, 2, 67–74 Search PubMed.
- J. M. Soon and K. P. Loh, Electrochem. Solid-State Lett., 2007, 10, A250 CrossRef CAS.
- X. Cao, Y. Shi, W. Shi, X. Rui, Q. Yan, J. Kong and H. Zhang, Small, 2013, 9, 3433–3438 CrossRef CAS PubMed.
- L. Cao, S. Yang, W. Gao, Z. Liu, Y. Gong, L. Ma, G. Shi, S. Lei, Y. Zhang and S. Zhang, Small, 2013, 9, 2905–2910 CrossRef CAS PubMed.
- S. Patil, A. Harle, S. Sathaye and K. Patil, CrystEngComm, 2014, 16, 10845–10855 RSC.
- N. Savjani, E. A. Lewis, M. A. Bissett, J. R. Brent, R. A. W. Dryfe, S. J. Haigh and P. O'Brien, Chem. Mater., 2016, 28, 657–664 CrossRef CAS.
- S. Ratha and C. S. Rout, ACS Appl. Mater. Interfaces, 2013, 5, 11427–11433 CrossRef CAS PubMed.
- A. Ramadoss, T. Kim, G.-S. Kim and S. J. Kim, New J. Chem., 2014, 38, 2379–2385 RSC.
- A. Winchester, S. Ghosh, S. Feng, A. L. Elias, T. Mallouk, M. Terrones and S. Talapatra, ACS Appl. Mater. Interfaces, 2014, 6, 2125–2130 CrossRef CAS PubMed.
- M. A. Bissett, I. A. Kinloch and R. A. Dryfe, ACS Appl. Mater. Interfaces, 2015, 7, 17388–17398 CrossRef CAS PubMed.
- M. M. Baig, E. Pervaiz, M. Yang and I. H. Gul, Front. Mater. Sci., 2020, 7, 580424 CrossRef.
- Y. Tian, X. Song, J. Liu, L. Zhao, P. Zhang and L. Gao, Adv. Mater. Interfaces, 2019, 6, 1900162 CrossRef.
- H. Sun, H. Liu, Z. Hou, R. Zhou, X. Liu and J.-G. Wang, Chem. Eng. J., 2020, 387, 124204 CrossRef.
- P. Sharma, M. Minakshi Sundaram, T. Watcharatharapong, S. Jungthawan and R. Ahuja, ACS Appl. Mater. Interfaces, 2021, 13, 56116–56130 CrossRef CAS PubMed.
- R. Wang, J. Lang, P. Zhang, Z. Lin and X. Yan, Adv. Funct. Mater., 2015, 25, 2270–2278 CrossRef CAS.
- S. Saha, K. Arole, M. Radovic, J. L. Lutkenhaus and M. J. Green, Nanoscale, 2021, 13, 16543–16553 RSC.
- S. Saha, P. Samanta, N. C. Murmu, A. Banerjee, R. S. Ganesh, H. Inokawa and T. Kuila, Chem. Eng. J., 2018, 339, 334–345 CrossRef CAS.
- S. Saha, P. Samanta, N. C. Murmu, N. H. Kim, T. Kuila and J. H. Lee, J. Ind. Eng. Chem., 2017, 52, 321–330 CrossRef CAS.
- J. Wang, J. Polleux, J. Lim and B. Dunn, J. Phys. Chem. C, 2007, 111, 14925–14931 CrossRef CAS.
- M. Jana, S. Saha, P. Samanta, N. C. Murmu, J. H. Lee and T. Kuila, Mater. Chem. Phys., 2015, 151, 72–80 CrossRef CAS.
- S. Saha, P. Samanta, N. Chandra Murmu and T. Kuila, Phys. Chem. Chem. Phys., 2017, 19, 28588–28595 RSC.
- J. Chen, Y. Xia, J. Yang and B. Chen, Appl. Phys. A, 2018, 124, 1–8 CrossRef CAS.
- J. Ning, M. Xia, D. Wang, X. Feng, H. Zhou, J. Zhang and Y. Hao, Nano-Micro Lett., 2020, 13, 2 CrossRef PubMed.
- N. Ogihara, Y. Itou, T. Sasaki and Y. Takeuchi, J. Phys. Chem. C, 2015, 119, 4612–4619 CrossRef CAS.
- N. O. Laschuk, E. B. Easton and O. V. Zenkina, RSC Adv., 2021, 11, 27925–27936 RSC.
- V. K. Mariappan, K. Krishnamoorthy, P. Pazhamalai, S. Sahoo and S.-J. Kim, Electrochim. Acta, 2018, 265, 514–522 CrossRef CAS.
- V. Simi and N. Rajendran, Mater. Charact., 2017, 129, 67–79 CrossRef CAS.
- F. Matemadombo and T. Nyokong, Electrochim. Acta, 2007, 52, 6856–6864 CrossRef CAS.
- S. N. Khatavkar and S. D. Sartale, New J. Chem., 2020, 44, 6778–6790 RSC.
- L. Manjakkal, E. Djurdjic, K. Cvejin, J. Kulawik, K. Zaraska and D. Szwagierczak, Electrochim. Acta, 2015, 168, 246–255 CrossRef CAS.
- A. R. Bredar, A. L. Chown, A. R. Burton and B. H. Farnum, ACS Appl. Energy Mater., 2020, 3, 66–98 CrossRef CAS.
- B. P. Silva, B. Tosco, D. Z. de Florio, V. Stepanenko, F. Würthner, J. F. Q. Rey and S. Brochsztain, J. Phys. Chem. C, 2020, 124, 5541–5551 CrossRef CAS.
- S. A. Pauline, U. K. Mudali and N. Rajendran, Mater. Chem. Phys., 2013, 142, 27–36 CrossRef.
- B. P. Silva, D. Z. de Florio and S. Brochsztain, J. Phys. Chem. C, 2014, 118, 4103–4112 CrossRef CAS.
- J. Zhang, H. Feng, Q. Qin, G. Zhang, Y. Cui, Z. Chai and W. Zheng, J. Mater. Chem. A, 2016, 4, 6357–6367 RSC.
- D. Nkosi, J. Pillay, K. I. Ozoemena, K. Nouneh and M. Oyama, Phys. Chem. Chem. Phys., 2010, 12, 604–613 RSC.
- R. Ramachandran, M. Saranya, C. Santhosh, V. Velmurugan, B. P. C. Raghupathy, S. K. Jeong and A. N. Grace, RSC Adv., 2014, 4, 21151–21162 RSC.
- R. Rajalakshmi, K. P. Remya, C. Viswanathan and N. Ponpandian, Nanoscale Adv., 2021, 3, 2887–2901 RSC.
- J. Zhu, W. Sun, D. Yang, Y. Zhang, H. H. Hoon, H. Zhang and Q. Yan, Small, 2015, 11, 4123–4129 CrossRef CAS PubMed.
- S. Saha, M. Jana, P. Khanra, P. Samanta, H. Koo, N. Chandra Murmu and T. Kuila, RSC Adv., 2016, 6, 1380–1387 RSC.
- S. Saha, W. Jang, N. C. Murmu, H. Koo and T. Kuila, ChemistrySelect, 2019, 4, 589–599 CrossRef CAS.
Footnote |
† Electronic supplementary information (ESI) available: Fig. S1: Fourier transform infrared (FT-IR) spectroscopy of Mo(dtc)4. Fig. S2: thermogravimetric analysis (TGA) of Mo(dtc)4. Fig. S3: Raman analysis of MoS2 melt. Fig. S4: cyclic voltammetry (CV) of (a) M5, (b) mPP and (c) mP at different scan rates on GCE in 1 M H2SO4 vs. SCE. Fig. S5: cyclic voltammetry (CV): cyclic stability of (a) M5, (b) mPP and (c) mP at scan rate of 20 mV s−1 for 50 cycles on GCE in 1 M H2SO4 electrolyte vs. SCE. Fig. S6: EIS Nyquist plots of (a) M5, (b) mPP and (c) mP vs. OC in 1 M H2SO4 electrolyte with equivalent circuit diagram. Fig. S7: EIS (Electrochemical Impedance Spectroscopy): Bode plots of (a) M5, (b) mPP and (c) mP vs. OC (open circuit) at 10 mV rms AC perturbation (in 1 M H2SO4 electrolyte). Fig. S8: GCCD (galvanostatic cyclic charge discharge): discharge curve of (a) M5, (b) mPP and (c) mP potential vs. real time (at charge density = 0.57 A g−1) in 1 M H2SO4 electrolyte. Fig. S9: GCCD (galvanostatic cyclic charge discharge): discharge curve of (a) MoS2 melt 5 mPP, (b) MoS2 melt 5 mP and (c) MoS2 melt potential vs. real time at different charge densities in 1 M H2SO4 electrolyte. Fig. S10: GCCD: capacitance retention of MoS2 melt 5 mPP vs. cycle number for 10![[thin space (1/6-em)]](https://www.rsc.org/images/entities/char_2009.gif) 000 cycles (in 1 M H2SO4 electrolyte). Fig. S11: Raman analysis of M5. See DOI: https://doi.org/10.1039/d3ra04153k 000 cycles (in 1 M H2SO4 electrolyte). Fig. S11: Raman analysis of M5. See DOI: https://doi.org/10.1039/d3ra04153k |
| This journal is © The Royal Society of Chemistry 2023 |

