 Open Access Article
Protein profile analysis of tear fluid with hyphenated HPLC-UV LED-induced fluorescence detection for the diagnosis of dry eye syndrome
Sphurti S. Adigala,
Sulatha V. Bhandaryb,
Nagaraj Hegdec,
V. R. Nidheesha,
Reena V. Johna,
Alisha Rizvib,
Sajan D. George d,
V. B. Karthaa and
Santhosh Chidangil
 *a
*a
aCentre of Excellence for Biophotonics, Department of Atomic and Molecular Physics, Manipal Academy of Higher Education, Manipal, Karnataka, India 576104. E-mail: santhosh.cls@manipal.edu
bDepartment of Ophthalmology, Kasturba Medical College, Manipal, Karnataka, India 576104
cAto-gear BV, Schimmelt 28, 5611 ZX Eindhoven, Netherlands
dCentre for Applied Nanotechnology, Department of Atomic and Molecular Physics, Manipal Academy of Higher Education, Manipal, Karnataka, India 567104
First published on 26th July 2023
Abstract
Tear fluid contains organic and inorganic constituents, variations in their relative concentrations could provide valuable information and can be useful for the detection of several ophthalmological diseases. This report describes the application of the lab-assembled light-emitting diode (LED)-based high-performance liquid chromatography system for protein profiling of tear fluids to diagnose dry eye disease. Principal Component Analysis (PCA), match/no-match, and Artificial Neural Network (ANN) based binary classification of protein profile data were performed for disease diagnosis. Results from the match/no-match test of the protein profile data showed 94.4% sensitivity and 87.8% specificity. ANN with the leaving one out procedure has given 91.6% sensitivity and 93.9% specificity.
1. Introduction
Dry eye is a multifactorial eye disease with symptoms of discomfort, visual disturbance, and tear film instability with potential damage to the ocular surface. It is accompanied by increased osmolarity of the tear film and inflammation of the ocular surface.1 Dry eye is one of the most common diseases for which no well-defined drug is available today, and the means of its emergence is unclear.2 Vision loss, scarring, perforation of the cornea, and secondary bacterial infection can be the causes of dry eye.3 Dry eye has several identified risk factors, amongst which the advanced age of the patient is the most common one.4 The severity of the disease can differ in signs and symptoms from mild to severe pain in the eyes combined with the fading of visual function.5 Overall, age-related dry eyes are reported to be 8.4% for those <60 years, 15% between 70 and 79 years, and 20% for subjects over 80 years.6 The incidence of dry eye is increasing in the younger population who are spending more of their time in front of digital displays in “smart” phones, e-learning, computer games, etc.7Tear fluid analysis plays an important role in understanding the molecular mechanism of different eye diseases. It contains molecules of different types; proteins, lipids, salts, and other organic molecules.8 The ocular tear film function is to maintain the lubrication and ocular surface health, guaranteeing normal vision and immune defense of the eye.9 Major tear proteins are lysozyme, lipocalin, lactoferrin, IgA, albumin, immunoglobulin (G), transferrin, and Immunoglobulin M (IgM).10 Lysozyme and lactoferrin are the primary tear proteins that perform antimicrobial functions in the body.11 Many of the proteins in tear fluid change from the very beginning of the induction of disease, and keep changing throughout the progression, and regression under therapy, as well as in any recurrence.11 The protein changes may be very small during the initial stages of any of these processes, and it can be quite difficult to measure accurately by using the current techniques.
Changes in tear film composition have already been explored in many ocular diseases such as age-related macular degeneration, dry eye disease, glaucoma or diabetic retinopathy using ‘Omics’ and Mass Spectrometry approaches.12 The current methods for the diagnosis and therapy of eye diseases like dry eye syndrome involve the Dynamic Meibomian Imager (DMI), Standard Patient Evaluation of Eye Dryness (SPEED) questionnaire, epithelial staining, Schirmer test, and phenol red thread test.13 To adequately assess/predict the severity of dry eye, more than one test or procedure must be performed by clinicians. For effective therapy, dry eye disease should be detected at the subclinical level to initiate necessary treatment; therefore, a reliable and fast tear fluid-based method that has the potential application of tear protein analysis is highly desirable.14
Analytical techniques such as Liquid Chromatography-Tandem Mass Spectrometry (LC-MS/MS), Isobaric Tags for Relative and Absolute Quantitation (iTRAQ) technology combined with LC and MS, Surface-Enhanced Laser Desorption/Ionization (SELDI) with Time-of-Flight (TOF) protein chip arrays are very sensitive approaches to analyze or identify the variations in the protein profile of control and DES patients.15,16 Over the last three decades, different HPLC techniques have been used with various detection methods for tear fluid analysis. A few groups have reported tear protein studies using optical methods like UV, IR, and Raman spectroscopy.17 Even though mass spectrometry is one of the best techniques for the early detection of diseases, it involves high cost, takes considerable time, and needs complex lab-based instrumentation, and qualified professionals as operators, making it less suitable in terms of affordability, accessibility, and availability.17 Recent studies have shown that AI-based techniques can be very useful to prevent eye diseases via early detection before the disease progresses to a pathological condition.18,19 Also, AI/ML-based pattern analysis methods applied to the protein profiles can give diagnostic results with a high degree of sensitivity and specificity.
An ultra-sensitive HPLC-protein separation-UV laser-induced fluorescence detection system has been developed in our laboratory. The system can detect proteins at sub-femtomole levels and its success stories for many clinical applications have been demonstrated.20 Commercial HPLC systems use deuterium/xenon/mercury lamps and measure the absorption of the eluents from the HPLC column.14,21 All these sources require relatively large power supplies and absorption measurements are much less sensitive compared to fluorescence, especially at very low concentrations, since absorption measures a very small change in a large signal, whereas fluorescence measures a small signal, where there was none before. UV LED-based fluorescence-HPLC systems are of much lower cost, small, need less complexity in the instrumentation, have good stability and reproducibility, and can give sensitivity better than that of commercial systems with conventional detectors.
We have improvised the HPLC system with a UV LED-based fluorescence excitation source at a much lower cost, small size, and less complexity, providing good stability and reproducibility, compared to commercial systems which use slightly bulky UV continuum lamps for absorption measurements. We have evaluated the performance of the system for diagnostic applications in non-communicable diseases such as myocardial infarction (MI).22 This system gives high sensitivity almost like commercial systems which use conventional UV lamp-based absorption for detection.
This manuscript reports the application of the HPLC-LED-fluorescence system for tear fluid sample analysis. The primary objective of this study is to obtain a high-quality protein profile of tear fluid samples using the HPLC-LED-fluorescence system and subsequently apply different multivariate analysis techniques to classify the protein profile data of normal and dry eye samples leading to diagnostic applications with high sensitivity, and specificity.
2. Materials and methods
2.1. Sample collection and processing
The tear fluid samples were collected from the Department of Ophthalmology, Kasturba Medical College (KMC), Manipal, India. Ethical clearance has been obtained from the Institutional Ethics Committee (IEC 230/2019) and the Indian Council of Medical Research (ICMR) for collection and measurements. There were 69 tear samples (33 control and 36 dry eye subjects) subjected to the study (Table 1).| Clinical diagnosis | Gender | Subject number | Habits |
|---|---|---|---|
| Control | Female | 1 to 18 | None |
| Male | 19 to 33 | None | |
| Dry eye | Female | 34 to 51 | None |
| 52–54 | Tobacco chewing | ||
| Male | 55–64 | None | |
| 65 | Tobacco chewing | ||
| 66–68 | Alcohol | ||
| 69 | Alcohol and smoke |
The samples from volunteers were collected using Schirmer strips. Volunteers were requested to position their heads slightly inclined in such a way that tears are driven outside of the lower fornix avoiding reflex tearing. The lower eyelid (left eye) was gently pulled down and the tip of the strip was placed in contact with the tear meniscus without irritating the conjunctiva. The strip was observed to be wet by greater than 15 mm in all 33 control subjects and 5 to 10 mm in 36 dry eye cases.
Strips were placed in Eppendorf tubes (1.5 mL) and immersed in 150 μL of HPLC grade water separately and immediately centrifuged at 503g (3000 rpm) for 5 minutes, the resulting solutions were stored at −80 °C until analysis. Low centrifugal force was set to centrifuge the sample to reduce the chance of protein loss.
The gradient elution method was followed in this study to record the chromatograms with a binary eluent of HPLC-grade water (eluent A) with 0.1% of Tri Fluro Acetic acid (TFA), and acetonitrile (eluent B) with 0.1% TFA. The flow rate for all the gradient runs was 200 μL min−1. After each run, the column was regenerated with A for 10 minutes. The gradient optimized to record chromatograms of tear fluid samples and standard tear proteins is shown in Table 2.
| Time (minutes) | A + 0.1% TFA | B + 0.1% TFA |
|---|---|---|
| 0 | 90% | 10% |
| 15 | 65% | 35% |
| 30 | 60% | 40% |
| 55 | 45% | 55% |
| 75 | 25% | 75% |
2.2. Experimental set up
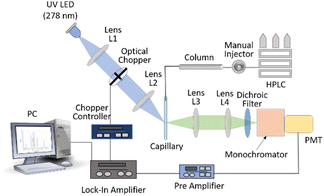
HPLC system (Agilent 1260 infinity II) includes a manual injector coupled to a reverse-phase ZORBAX 300SB-C8 column (4.6 × 250 mm, 5 mm) of pore size 300 Å. The proteins separated by the column were eluted and flown through a 500-micron inner diameter UV fused silica capillary (FS-175 Upchurch Scientific, USA) flow cell. The flow cell was precisely mounted on (precision) mounts to maintain the reproducibility of both excitation and fluorescence collection over long periods. The proteins were excited with 278 nm LED (LEUVA66H70HF00, LG-Innotek, angle of beam spread 110°) of power 18 mW. The fluorescence from the eluted sample was collected and focused onto a monochromator-photomultiplier (Hamamatsu R750) assembly. The monochromator was set for fluorescence detection at 340 nm and PMT was set at 800 V in combination with a pre-amplifier (EG&G Model 5113) and lock-in amplifier (EG&G Model 7265). The output of the lock-in amplifier was connected to a data processing computer. A detailed description of the setup is mentioned elsewhere.22 The schematic of the HPLC-LED-fluorescence setup is shown in Fig. 1.2.3. Absorption and fluorescence study of tear proteins
UV absorption of control and moderate dry eye tear fluid samples (10 each) were recorded using JASCO UV/Visible Spectrophotometer V-650. The samples (250 μL) were taken in a 360 μL cuvette with a 3 mm path length. This experiment was conducted to select a suitable source wavelength to excite the proteins in the tear fluid. The fluorescence spectra of the same samples were recorded using JASCO Spectrofluorometer FP 8500 to set the wavelength for the monochromator to collect fluorescence thereby detecting the eluted proteins.2.4. Evaluation of HPLC-LED-IF system performance
The performance of the system in terms of its capability to detect ultra-trace (picomole) levels of proteins in tears and its linearity of response was studied by selecting lactoferrin (LF) (Sigma Aldrich (USA)), a standard protein, which is one of the major proteins in tear fluid samples of dry eye and other eye diseases. The calibration curve of this protein was prepared by recording chromatograms of standard proteins in different known concentrations. HPLC-grade water was used to prepare the protein solutions. Using the calibration curve, the limit of detection (LOD) and correlation uncertainty were calculated.232.5. Tear fluid analysis
The tear fluid chromatograms were preprocessed for statistical analysis to reduce any random variations, noise, and background signals, using GRAMS/32 (Galactic Inc., USA) software.25 The first preprocessing included baseline correction. The individual proteins retention time in the chromatogram may differ slightly from one run to the next due to the possibility of small variations in sample injection speed, pump speed, room temperature etc. To reduce the shift in peak positions, the protein profiles were calibrated by assigning the mean values of protein peaks common in all samples along the time scale. All the protein profiles were subjected to vector normalization. Descriptive statistics and Principal Component Analysis (PCA) were performed using Unscrambler X (version 10.4 CAMO, Norway) software.26 “Descriptive statistics is an important part of biomedical research which is used to extract the basic features of the data in the study”.27 In this study, based on mean and standard deviation values, box plots have been drawn accordingly to determine the variations in the different regions of both control and moderate dry eye protein profiles.
Another approach is based on “standard calibration sets”. For this study, calibration sets (control calibration set and disease (moderate dry eye calibration set)) are prepared with a statistically significant number of clinically certified samples. All the control and disease samples were tested against the disease standard set for the match/no-match test (GRAMS/32 (Galactic Inc., USA) software). Statistical parameters such as spectral residuals and M-distance are calculated for all members of the standard sets.31 M-distance, offers an effective means of evaluating the similarity of a set of parameters for an unknown test sample to a calibration set of standard samples, enabling accurate classification of the unknown material based on the closest match observed. Upon comparing the unknown sample against various models or calibration sets, it is possible to categorize the material by identifying the closest match and assigning it to the corresponding class. The Mahalanobis method is extremely responsive to changes between variables in the calibration datasets, and we have utilized it as a discriminant in the match/no match technique. M-Distance is calculated based on how many standard deviations away a given data point is from the average value of the training set.32 The computed matching scores not only offer a highly precise way of distinguishing between different samples but also provide statistical information about the similarity between an unknown sample and the training data. The scores can give an indication of how closely the characteristics of the unknown sample align with the patterns present in the original training data.
The samples to be tested are added to the calibration set and PCA was performed. To check whether the test sample parameters match with match/no-match condition with standard set parameters; M-distance and spectral residual are compared to the parameters derived from the standard set, within a desired standard deviation for the standard set values. The spectral residual, which is a measure of the variations between the observed spectrum and simulated spectrum, is obtained by summing up the squares of the differences between the intensities at each point. By comparing each chromatogram to a reference set, it is possible to generate “match/no-match” outcomes to evaluate their similarity.32
For our dataset, PCA generates scores and residuals for every individual sample. Using a standard calibration set, such as tear fluid from control samples, the variations in these parameters can be utilized to construct the Mahalanobis matrix [M] in the following manner. Initially, the N × (F + 1) matrix [S], consisting of F scores and a spectral residual for the N individuals of the calibration set, is constructed. Subsequently, the Mahalanobis matrix [M] is determined using the following formula.
| M = S′S/(N − 1) | (1) |
| MTEST = S′TEST [M] − 1 STEST, in units of standard deviation | (2) |
| Std. Cal set | Test set | Match (count) | M distance range | Spectral residual range | S1c (%) | S2d (%) | Ae (%) |
|---|---|---|---|---|---|---|---|
| a C – control.b D – dry eye.c S1 – sensitivity [TP/(TP + FN)] × 100%.d S2 – specificity [TN/(TN + FP)] × 100%.e A – accuracy [(TP + TN)/(TP + TN + FP + FN)] × 100%. | |||||||
| Ca | Ca | Yes (15) | 0.1–0.79 | 0.016–0.08 | 83.3 | 86.1 | 85.1 |
| No (3) | 0.84–5.8 | 0.08–0.34 | |||||
| Db | Yes (5) | 0.43–0.67 | 0.06–0.07 | ||||
| No (31) | 0.8–4.94 | 0.07–0.4 | |||||
| Db | Ca | Yes (4) | 0.9–1.4 | 0.02–0.04 | 94.4 | 87.8 | 90.1 |
| No (29) | 0.92–25.9 | 0.06–0.54 | |||||
| Db | Yes (17) | 0.3–1.8 | 0.01–0.07 | ||||
| No (1) | 2.02 | 0.06 | |||||
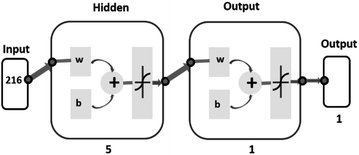
To develop a machine learning model, a multi-layer perceptron (MLP) model was used. It is a feed-forward artificial neural network that maps the set of inputs to the desired output.33,34 In this study, the MLP model was trained using a stand-alone version of the Artificial Neural Network Library from Math Works.35 The network architecture of 1 hidden layer with 5 hidden neurons was formed experimentally as the simplest network which has produced satisfactory results. Levenberg–Marquardt's back-propagation was used for training the network.36 The network architecture for the dry eye data analysis is shown in Fig. 2.
As one can see from the network diagram, a total of 216-time instances are used to train the model for the specific protein retention time region from 2285 s to 2761 s. The leave-one-out procedure was used for training the classification models. In this method, one subject's data was used for training and determining the model parameters, and the remaining subjects were used only for validation. Results are reported with a confusion matrix (Table 4) with sensitivity, specificity, and accuracy. A confusion matrix serves as a useful tool for assessing the effectiveness of a classification model by presenting how many true and false positive and negative predictions were made when compared to the actual target values.34 Both match/no-match and ANN tests were performed as a cross-validation method for PCA.
| Actual class | ||||
|---|---|---|---|---|
| 1 | 0 | |||
| Output class | 1 | True positive (T.P.) 33 | False negative (F.N.) 3 | Sensitivity 91.6% |
| 0 | False positive (F.P.) 2 | True negative (TN) 31 | Specificity 93.9% | |
| Precision 94.2% | Negative predictive value 91.1% | Accuracy 92.7% | ||
3. Experimental results
Tear fluid contains different components as mentioned earlier, and proteins are one of the groups among them. Fig. 3(a) and (b) represent the average of 10 control and 10 moderate dry eye tear fluid absorption and fluorescence spectra. From the absorption and fluorescence study, it was observed that the proteins in both control and moderate dry eye tear fluid samples have absorption and fluorescence maxima at 280 nm and 338 nm respectively. It is also observed that absorption and fluorescence intensities were found to be lower in the case of dry eye tear fluid samples.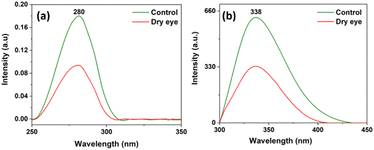 | ||
| Fig. 3 (a) Absorption and (b) fluorescence spectra of control and moderate dry eye tear fluid samples. | ||
We have shown in our earlier studies, that BSA injected under the same conditions of the column, flow rate, excitation power etc. as used in the present studies, can be easily detected from femtomoles to very high concentration levels values with linear response.37 It has also been shown that serum chromatograms, on dilution from 1![[thin space (1/6-em)]](https://www.rsc.org/images/entities/char_2009.gif) :
:![[thin space (1/6-em)]](https://www.rsc.org/images/entities/char_2009.gif) 500 to 1
500 to 1![[thin space (1/6-em)]](https://www.rsc.org/images/entities/char_2009.gif) :
:![[thin space (1/6-em)]](https://www.rsc.org/images/entities/char_2009.gif) 16
16![[thin space (1/6-em)]](https://www.rsc.org/images/entities/char_2009.gif) 000 showed a very good linear variation in intensities of individual protein peaks with dilution,38 demonstrating the capability of the experimental system and technique, like that in present studies will provide faithful protein profiles for any kind of clinical sample, over very wide concentration ranges.
000 showed a very good linear variation in intensities of individual protein peaks with dilution,38 demonstrating the capability of the experimental system and technique, like that in present studies will provide faithful protein profiles for any kind of clinical sample, over very wide concentration ranges.
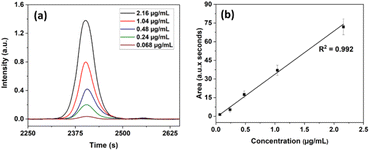
To ensure the capability of the present system and technique to detect, and quantitatively estimate individual proteins we prepared a set of solutions of lactoferrin (LF) and recorded the HPLC profile for each of them. Overlaid chromatograms of lactoferrin (LF) with different concentrations (2.16, 1.04, 0.48, 0.24, and 0.068 μg mL−1) and their corresponding linear calibration plot are shown in Fig. 4(a) and (b) respectively. The calibration curve was constructed by plotting the area under the protein peak of the chromatogram for each sample against its corresponding concentration. The LOD calculated using regression analysis for LF is, 0.015 μg mL−1. For leave one out method, 1.04 μg mL−1 was chosen as an “unknown” concentration, and its predicted concentration obtained from the linear plot is 1.1 μg mL−1. The correlation uncertainty of LF was 6.3%. It is thus seen that the present system with LED excitation can detect proteins at concentrations of the order of sub-pico-moles per mL to much higher levels and hence can be used for tear protein analysis. The detection limits can be lowered further by the multi-passing of the excitation beam and collection of the fluorescence signal from back-reflection and other directions.
From Fig. 4, it is seen that the working curve has very good linearity from high concentrations to very low (0.068 μg mL−1) concentrations, indicating that the column size and eluent flow rate do not influence the quantitative elution of individual proteins even when the protein content of the sample is very low.
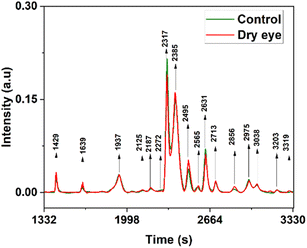
Averaged overlaid tear fluid chromatograms of 33 control and 36 moderate dry eyes are shown in Fig. 5 respectively. As can be seen from Fig. 5, out of the more than 1700 proteins reported by Jung et al.39 from pooled samples, a much smaller number only is observed from single samples, presumably because they may be present only in extremely small quantities. But what is important is that they are seen in all samples, normal and dry eye; that is, the chromatograms are sample, separation process, or concentration independent, so long as the same technique is followed throughout since it is highly unlikely that all the samples have the same composition. Almost all the observed proteins are up-regulated, except the very strong 2317 and weak 2631 seconds peaks, which are down-regulated. A few, very weak, peaks (1685, 1937, 2272, and 3038 seconds) seem to be unchanged. In the 16 marker proteins, selected from the 1700 total observed by Jung et al.,39 3 were up-regulated from Tear Fluid (TF) and 8 up-regulated and 5 down-regulated from Lacrimal Fluid (LF), indicating that most of the markers were up-regulated.
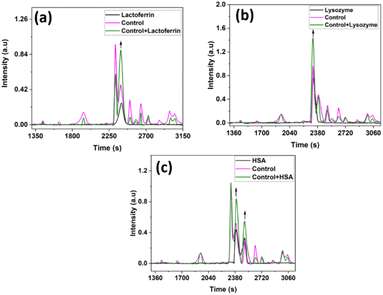
Conventional protein estimation methods determine the total proteins in a sample. Any diagnostic technique, which depends on identifying all these proteins individually will take a very long time and will involve complex methods like HPLC-MS-MS. Moreover, all such methods depend on an initial separation of the proteins by HPLC, followed by further steps like immunoassay, dye binding etc., making them highly unsuitable for routine applications.40 But if and when the specific identity of any component is required, it can also be done directly in the current technique, by either running the required protein alone separately and determining its peak position in the chromatogram so that it can be identified in the sample chromatogram, or still better, by the “co-injection” method, which is similar to the “Standard Addition Method”, in the quantitative analysis.41 We have done this here to identify the peaks and elution times of LF, Lyz, and HSA in the tear fluid sample.
The protein peaks in the tear samples were confirmed by comparing the co-injected chromatograms with chromatograms of these standard proteins. At 2317 s – lysozyme is eluted and is less in the dry eye when compared with the control, at 2385 s – lactoferrin is eluted, and serum albumin is eluted at 2385 s and 2495 s. In the case of lactoferrin and HSA at 2385 seconds, overlapping of these proteins were observed and its intensity was high in the dry eye when compared with the control (Fig. 5) which is also reported.42
It is thus possible to identify the peak in the chromatogram corresponding to any possible markers when desired. Fig. 6(a–c) show the results when proteins LF, LYZ, and HSA were mixed and co-injected with the control tear fluid samples. A few other studies also reported similar results.43,44
In brief, the focus in the current studies is not on protein identification, but development of a cost-effective HPLC-LED-IF system and technique for the diagnosis of dry eye syndrome. Using the HPLC-LED-IF system we can obtain high-quality chromatograms and observe the variations related to dry eye conditions in protein peak intensity pattern. These variations, combined with various multivariate analysis techniques such as PCA, match/no-match, and Artificial Neural Networks have improved the classification and discrimination of control and dry eye conditions.
Fig. 7 shows the box plots from descriptive statistics analysis representing the mean and standard deviation values of the control and the moderate dry eye tear fluid samples. Subtle distinctions were observed between the chromatograms of the control and moderate dry eye samples within the protein retention time range of 2285 s to 2761 s.
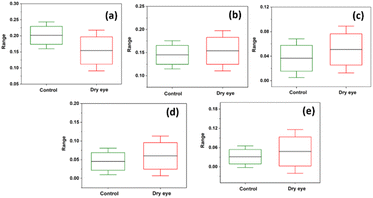 | ||
| Fig. 7 Box plots representing descriptive statistics of the protein peaks at (a) 2317 s, (b) 2385 s, (c) 2495 s (d) 2631 s and (e) 2713 s of control and moderate dry eye. | ||
3.1. PCA analysis and match/no-match test
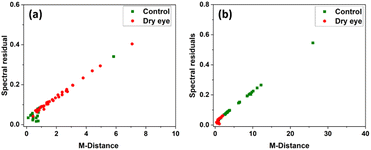
PCA was performed by using the whole region of the chromatogram. Fig. 8 shows the PC1 versus PC2 score plot. Scatter plots for PC1 vs. PC2 for the specific protein retention time region (2285 s to 2761 s) in the X-axis is shown in Fig. 9 illustrating the improved discrimination of control and dry eye samples. PCA results showed a better classification of moderate dry eye from control for the selected protein retention time region from 2285 s to 2761 s in the X-axis. Based on PCA results, match/no-match test was performed for specific protein retention time regions. The M-distance acceptance value for the test against the control standard set was 0.78. Here, “5” moderate dry eye tear fluid samples matched with the control standard set, and “3” control tear fluid samples did not match with the standard set. The M-distance acceptance value for match/no-match test against the moderate dry eye standard set was 1.9. In this test, 4 control tear fluid samples matched with the moderate dry eye standard set, and 1 moderate dry eye did not match with the moderate dry eye standard set. Fig. 10(a) and (b) show the plots of the spectral residual vs. M-distance obtained from the match/no-match test against control and moderate dry eye standard set for the specific protein retention time region. The sensitivity, specificity, and accuracy calculated for this study are mentioned in Table 3.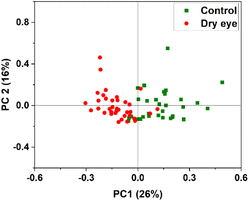 | ||
| Fig. 8 PC1 vs. PC2 score plot of control and moderate dry eye data for whole protein retention time region in the X-axis. | ||
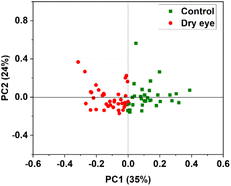 | ||
| Fig. 9 PC1 vs. PC2 score plot of control and moderate dry eye data selected in the protein retention time region 2285 s to 2761 s of the X-axis. | ||
The confusion matrix along with sensitivity, specificity, and accuracy for the specific protein retention time region 2285 s to 2761 s, obtained from ANN-based binary classification using the leave-one-out cross-validation method is shown in Table 4.
4. Discussion
Severe ocular disorders can become a huge socio-economic burden and hence, there is a necessity for the implementation of an “evidence-based, predictive” method for early detection, prognosis, therapy planning, and follow-up, for dry eye syndrome using a home build HPLC-LED-IF technique for protein profile recording of tear fluid collected by Schirmer strip. The recorded protein profiles were analyzed for the classification followed by the disease diagnosis with high sensitivity, specificity, and accuracy by selecting suitable regions in the tear fluid chromatogram to diagnose dry eye condition.Tear fluid analysis has already been determined to be used as a diagnostic tool for ocular diseases as well as different non-communicable diseases.17 The molecular components in a tear fluid profile can be used for detailed qualitative and quantitative analysis that significantly improves the detection and prediction of ocular disorders. Generally, the diagnosis of dry eye is based on the symptoms, clinical tests, and questionnaires. Currently, available quantitative assessment on dry eye suggests that just clinical tests may not be enough for the treatment of dry eye patients; instead, there is a need to establish a method to understand the changes at the biochemical level, say protein patterns or identification of multiple protein markers in the dry eye disease that lead to the identification of new therapeutic targets and improved prognosis.45
In current diagnostic practices, one or two of these marker proteins are usually only measured. Obviously, in this “reactive” approach, early detection, prognosis, follow-up, regression, or recurrence can be very difficult to monitor. But in a protein profile pattern analysis, one is looking at the pattern of many protein species, and with a sensitive detection technique, like fluorescence, this component-specific simultaneous variation in multiple components will be easily observable.46 Such variations will be highly characteristic of the stage and type of disease, and the personal nature of the individual (lifestyle, age, disease status etc.). Identifying the biomarkers and quantitatively measuring these changes is unnecessary, which is what current “reactive” diagnostic techniques do.
In tune with the study of Choy et al. on dry eye samples,12 we also observed that the intensities of absorption and fluorescence maxima are lower in tear samples from dry eye compared to control which may be due to the depletion of tryptophan/tyrosine molecules (Fig. 2(a) and (b)) under disease condition. More studies are essential to establish this observation. Glinska et al. reported the use of fluorescence measurements of tear fluid as a non-invasive diagnostic method for the diagnosis of diabetes by confirming the changes in the protein profile pattern in diabetes tear fluid compared to the healthy condition.47 Though these methods are used for non-destructive analyses of tears, composite data of multi-component systems, like UV-absorption and fluorescence, cannot provide information on the role of individual molecular components present in tear fluid that are responsible for the observed differences among two or more groups when compared with sensitive and reliable molecular profiles obtained in techniques like HPLC-LED-IF. Also, the absorption and fluorescence spectra alone cannot decide whether a disease condition is dry eye or some other eye condition, because it is quite likely that the overall fluorescence or absorption will be dominated by the major components, while the disease condition may produce only minor changes in some of them, and may produce small amounts of new proteins, and different disease conditions may produce more or less similar spectral changes, while protein profiles will be very different for different disease conditions.
The protein profiles recorded using the HPLC-LED-IF system showed noticeable differences between control and moderate dry eye syndrome tear fluid samples with varying peak intensities. Descriptive statistics showed relatively minor differences in the specific protein retention time region 2285 s to –2761 s (Fig. 7). The aim of the work was to test the potential of the recorded chromatogram using the HPLC-LED-IF system for the classification, obtaining high sensitivity, specificity, and, accuracy by selecting a suitable protein retention time region in the tear fluid chromatogram to diagnose dry eye condition. It was observed that optimum sensitivity and specificity were achieved by fixing the M-distance at a relevant value. Match/no-match test summary results for the protein retention time region 2285 s to 2761 s showed 94.4% sensitivity, 87.8% specificity, and 90.1% accuracy for M-distance value 1.9. ANN-based binary classification showed improved values: 91.6% sensitivity, 93.9% specificity, and 91.3% accuracy. The study also showed that ANN-based binary classification with a leave-one-out procedure is a strong cross-validation method for the PCA analysis in this study.
The advantage of the tear fluid analysis technique is its minimally non-invasive feature of the sample collection. Since tear fluid samples can be collected from individuals of any age group, at any place, and at any time, the present method is highly suitable for point-of-care (POC)/bedside diagnostic tests for clinical/pathological conditions. It is also important to note that care must be taken during sample collection, since various factors such as tear collection, storage, handling, and processing can influence the results such as protein patterns, detection of individual proteins, etc. Pattern analysis of tear chromatograms using the statistical tools (PCA, match/no-match test, and ANN) demonstrated the capability of the method to differentiate control and moderate dry eye condition.
Protein profiling is often a key step in the development of specific assays that specifically target the protein markers for diagnostic use. It can contribute to the diagnostic process by providing additional information about the underlying pathophysiology of dry eye syndrome and can be used in conjunction with other tests and clinical evaluations to help diagnose and manage the condition. The system's detection capability for lactoferrin, a significant biomarker present in tears was verified as it could identify concentrations as low as 0.015 μg mL−1. The proteins' peak positions in the tear chromatogram due to LF, Lyz and HSA were identified using the co-injection technique. This study successfully achieved its main objective of obtaining high-quality protein profile chromatograms of tear fluid samples using the HPLC-LED-IF method and demonstrated good sensitivity and specificity in classifying dry eye and control samples based on their protein profile pattern.
5. Conclusion
The study demonstrated that the HPLC system with 278 nm LED excitation exhibits remarkable sensitivity in detecting proteins at extremely low levels and can generate protein profiles that can be utilized for a multitude of clinical applications, such as diagnosis, prognosis, and therapy follow-up. The HPLC-LED-IF system has the limit of detection at the μg mL−1 level for the protein lactoferrin. The system's ability to differentiate between moderate dry eye and control subjects has been demonstrated through the implementation of various data processing techniques such as PCA, match/no-match test, and ANN, with the latter achieving a high sensitivity of 91.6%, specificity of 93.9%, and accuracy of 91.3% utilizing a binary classification approach and leave-one-out procedure.Author contributions
Sphurti S. Adigal: methodology, validation, data collection, formal analysis, writing – original draft; Sulatha V. Bhandary: providing samples and reviewing the manuscript; Nagaraj Hegde: involved in data analysis and reviewing the manuscript; Nidheesh V. R.: involved in preparing the manuscript; Reena V. John: helped in the experiments; Alisha Rizvi: involved in sample collection; Sajan D. George: involved in reviewing the manuscript; Vasudevan Baskaran Kartha: involved in manuscript review and editing; Santhosh Chidangil: conceptualized, supervised, reviewed and edited the manuscript.Conflicts of interest
The authors are not involved with any organization or entity with a financial interest or financial conflict of interest.Acknowledgements
The authors are thankful to VGST (GRD No. 459), Govt. of Karnataka, for sanctioning a grant to establish an HPLC facility under the scheme Centre of Excellence in Science. Ms Sphurti S. Adigal is thankful to Manipal Academy of Higher Education for the Dr TMA Pai PhD Scholarship. The authors are also thankful to the Department of Ophthalmology, Kasturba Medical College, Manipal Academy of Higher Education, Manipal.References
- M. A. Lemp and G. N. Foulks, The definition and classification of dry eye disease, Ocul. Surf., 2007, 5(2), 75–92 CrossRef.
- M. Azharuddin, J. Khandelwal, H. Datta, A. K. Dasgupta and S. O. Raja, Dry eye: a protein conformational disease, Invest. Ophthalmol. Visual Sci., 2015, 56(3), 1423–1429 CrossRef CAS.
- B. Li, M. Sheng, L. Xie, F. Liu, G. Yan, W. Wang, A. Lin, F. Zhao and Y. Chen, Tear proteomic analysis of patients with type 2 diabetes and dry eye syndrome by two-dimensional nano-liquid chromatography coupled with tandem mass spectrometry, Invest. Ophthalmol. Visual Sci., 2014, 55(1), 177–186 CrossRef CAS.
- F. Stapleton, M. Alves, V. Y. Bunya, I. Jalbert, K. Lekhanont, F. Malet, K. S. Na, D. Schaumberg, M. Uchino, J. Vehof and E. Viso, Tfos dews ii epidemiology report, Ocul. Surf., 2017, 15(3), 334–365 CrossRef PubMed.
- M. Yazdani, K. B. Elgstøen and T. P. Utheim, Eye make-up products and dry eye disease: a mini review, Curr. Eye Res., 2022, 47(1), 1 CrossRef PubMed.
- A. J. Paulsen, K. J. Cruickshanks, M. E. Fischer, G. H. Huang, B. E. Klein, R. Klein and D. S. Dalton, Dry eye in the beaver dam offspring study: prevalence, risk factors, and health-related quality of life, Am. J. Ophthalmol., 2014, 157(4), 799–806 CrossRef PubMed.
- S. Barabino, Is dry eye disease the same in young and old patients? A narrative review of the literature, BMC Ophthalmol., 2022, 22(1), 1–6 CrossRef PubMed.
- C. Salvisberg, N. Tajouri, A. Hainard, P. R. Burkhard, P. H. Lalive and N. Turck, Exploring the human tear fluid: Discovery of new biomarkers in multiple sclerosis, Proteomics: Clin. Appl., 2014, 8(3–4), 185–194 CAS.
- M. Yazdani, K. B. Elgstøen, H. Rootwelt, A. Shahdadfar, Ø. A. Utheim and T. P. Utheim, Tear metabolomics in dry eye disease: a review, Int. J. Mol. Sci., 2019, 20(15), 3755 CrossRef CAS.
- X. Zhan, J. Li, Y. Guo and O. Golubnitschaja, Mass spectrometry analysis of human tear fluid biomarkers specific for ocular and systemic diseases in the context of 3P medicine, EPMA J., 2021, 12, 449–475 CrossRef PubMed.
- J. Brunmair, A. Bileck, D. Schmidl, G. Hagn, S. M. Meier-Menches, N. Hommer, A. Schlatter, C. Gerner and G. Garhöfer, Metabolic phenotyping of tear fluid as a prognostic tool for personalised medicine exemplified by T2DM patients, EPMA J., 2022, 13(1), 107–123 CrossRef PubMed.
- C. K. Choy, P. Cho and I. F. Benzie, Antioxidant content and ultraviolet absorption characteristics of human tears, Optom. Vis. Sci., 2011, 88(4), 507–511 CrossRef.
- M. Tamhane, S. Cabrera-Ghayouri, G. Abelian and V. Viswanath, Review of biomarkers in ocular matrices: challenges and opportunities, Pharm. Res., 2019, 36(3), 40 CrossRef PubMed.
- H. Venugopalan, UVC LEDs enable cost-effective spectroscopic instruments, Laser Focus World, 2015, 51, 81–85 CAS.
- G. Jones, T. J. Lee, J. Glass, G. Rountree, L. Ulrich, A. Estes, M. Sezer, W. Zhi, S. Sharma and A. Sharma, Comparison of Different Mass Spectrometry Workflows for the Proteomic Analysis of Tear Fluid, Int. J. Mol. Sci., 2022, 23(4), 2307 CrossRef CAS PubMed.
- P. Ramamoorthy, S. Khanal and J. J. Nichols, Inflammatory proteins associated with contact lens-related dry eye, Cont. Lens Anterior Eye., 2022, 45(3), 101442 CrossRef.
- S. S. Adigal, A. Rizvi, N. V. Rayaroth, R. V. John, A. Barik, S. Bhandari, S. D. George, J. Lukose, V. B. Kartha and S. Chidangil, Human tear fluid analysis for clinical applications: progress and prospects, Expert Rev. Mol. Diagn., 2021, 21(8), 767–787 CrossRef CAS.
- T. C. Quek, K. Takahashi, H. G. Kang, S. Thakur, M. Deshmukh, R. M. Tseng, H. Nguyen, Y. C. Tham, T. H. Rim, S. S. Kim and Y. Yanagi, Predictive, preventive, and personalized management of retinal fluid via computer-aided detection app for optical coherence tomography scans, EPMA J., 2022, 13(4), 547–560 CrossRef PubMed.
- A. M. Storås, I. Strümke, M. A. Riegler, J. Grauslund, H. L. Hammer, A. Yazidi, P. Halvorsen, K. G. Gundersen, T. P. Utheim and C. J. Jackson, Artificial intelligence in dry eye disease, Ocul. Surf., 2022, 23, 74–86 CrossRef.
- A. Patil, S. Bhat, K. M. Pai, L. Rai, V. B. Kartha and S. Chidangil, Ultra-sensitive high performance liquid chromatography–laser-induced fluorescence-based proteomics for clinical applications, J. Proteomics, 2015, 127, 202–210 CrossRef CAS PubMed.
- X. Geng, N. Wang, Y. Gao, H. Ning and Y. Guan, A novel HPLC flow cell integrated UV light emitting diode induced fluorescence detector as alternative for sensitive determination of aflatoxins, Anal. Chim. Acta, 2018, 1033, 81–86 CrossRef CAS PubMed.
- V. J. Reena, D. Tom, S. Sphurti, J. Adigal and V. B. Lukose, Kartha1 and Santhosh Chidangil, Serum protein profile study of Myocardial Infraction using HPLC-LED-Induced Fluorescence, J. Chromatogr. B: Anal. Technol. Biomed. Life Sci., 2023, 1217, 123616 CrossRef PubMed.
- V. R. Nidheesh, A. K. Mohapatra, R. Nayak, V. K. Unnikrishnan, V. B. Kartha and S. Chidangil, UV laser-based photoacoustic breath analysis for the diagnosis of respiratory diseases: Detection of Asthma, Sens. Actuators, B, 2022, 370, 132367 CrossRef.
- N. S. Lakka and C. Kuppan, Principles of chromatography method development. Intech Open, 2019 Search PubMed.
- A. Patil, K. S. Choudhari, V. K. Unnikrishnan, N. Shenoy, R. Ongole, K. M. Pai, V. B. Kartha and S. Chidangil, Salivary protein markers: a noninvasive protein profile-based method for the early diagnosis of oral premalignancy and malignancy, J. Biomed. Opt., 2013, 18(10), 101317 CrossRef PubMed.
- R. Swathi, J. Reena, P. Ajeetkumar, O. Ravikiran, D. Tom, V. B. Kartha and C. Santhosh, Optical biopsy and optical pathology: affordable health care under low-resource settings, J. Biomed. Photonics Eng., 2020, 6(2), 20309 Search PubMed.
- P. Mishra, C. M. Pandey, U. Singh, A. Gupta, C. Sahu and A. Keshri, Descriptive statistics and normality tests for statistical data, Ann. Card. Anaesth., 2019, 22(1), 67 CrossRef PubMed.
- A. Detroyer, V. Schoonjans, F. Questier, Y. Vander Heyden, A. P. Borosy, Q. Guo and D. L. Massart, Exploratory chemometric analysis of the classification of pharmaceutical substances based on chromatographic data, J. Chromatogr. A, 2000, 897(1–2), 23–36 CrossRef CAS PubMed.
- J. F. Cotte, H. Casabianca, S. Chardon, J. Lheritier and M. F. Grenier-Loustalot, Chromatographic analysis of sugars applied to the characterisation of monofloral honey, Anal. Bioanal. Chem., 2004, 380, 698–705 CrossRef CAS PubMed.
- F. Kherif and A. Latypova, Principal component analysis, InMachine Learning, Academic Press, 2020, pp. 209–225 Search PubMed.
- N. VR, A. K. Mohapatra, U. VK, J. Lukose, V. B. Kartha and S. Chidangil, Post-COVID syndrome screening through breath analysis using electronic nose technology, Anal. Bioanal. Chem., 2022, 414(12), 3617–3624 CrossRef CAS PubMed.
- M. P. Chandra, On the generalized distance in statistics. In Proceedings of the National Institute of Sciences of India, Vol. 2, No. 1, 1936, pp. 49–55 Search PubMed.
- S. Haykin Neural networks and learning machines, 3/E. Pearson Education India, 2009 Search PubMed.
- N. Hegde, M. Bries, T. Swibas, E. Melanson and E. Sazonov, Automatic recognition of activities of daily living utilizing insole-based and wrist-worn wearable sensors, IEEE J. Biomed. Health Inform., 2017, 22(4), 979–988 Search PubMed.
- https://in.mathworks.com/help/deeplearning/ref/trainlm.html, Accessed on 03 September 2022.
- F. Amin and M. Mahmoud, Confusion Matrix in Binary Classification Problems: A Step-by-Step Tutorial, J. Eng. Res., 2022, 6(5), T1–T12 Search PubMed.
- K. Venkatakrishna, V. B. Kartha, K. M. Pai, C. M. Krishna, O. Ravikiran, J. Kurian, M. Alexander and G. Ullas, HPLC-LIF for early detection of oral cancer, Curr. Sci., 2003, 551–557 CAS.
- S. Bhat, Protein profile and LASER Fluorescence spectroscopic studies of clinical samples for early detection of cervical cancer, Doctoral thesis submitted to Manipal University, Manipal, India, 2009.
- J. H. Jung, Y. W. Ji, H. S. Hwang, J. W. Oh, H. C. Kim, H. K. Lee and K. P. Kim, Proteomic analysis of human lacrimal and tear fluid in dry eye disease, Sci. Rep., 2017, 7(1), 13363 CrossRef PubMed.
- N. Abdulrazzaq Hasan, Protein assay methods, Lecture material at the Al-Nahrain University, 2019, DOI:10.13140/RG.2.2.29809.53604.
- I. G. Zenkevich and I. O. Klimova, Use of the standard addition method in quantitative chromatographic analysis, J. Anal. Chem., 2006, 61, 967–972 CrossRef CAS.
- F. H. Grus and A. J. Augustin, High-performance liquid chromatography analysis of tear protein patterns in diabetic and non-diabetic dry-eye patients, Eur. J. Ophthalmol., 2001, 11(1), 19–24 CrossRef CAS PubMed.
- R. J. Boukes, A. Boonstra, A. C. Breebaart, D. Reits, E. Glasius, L. Luyendyk and A. Kijlstra, Analysis of human tear protein profiles using high performance liquid chromatography (HPLC), Doc. Ophthalmol., 1987, 67, 105–113 CrossRef CAS.
- R. J. Fullard, Identification of proteins in small tear volumes with and without size exclusion HPLC fractionation, Curr. Eye Res., 1988, 7(2), 163–179 CrossRef CAS.
- T. Suárez-Cortés, N. Merino-Inda and J. M. Benitez-del-Castillo, Tear and ocular surface disease biomarkers: A diagnostic and clinical perspective for ocular allergies and dry eye disease, Exp. Eye Res., 2022, 109121 CrossRef PubMed.
- S. Bhat, A. Patil, L. Rai, V. B. Kartha and S. Chidangil, Application of HPLC combined with laser induced fluorescence for protein profile analysis of tissue homogenates in cervical cancer, Sci. World J., 2012, 2012 Search PubMed.
- G. Glinská, K. Krajčíková, K. Zakutanská, O. Shylenko, D. Kondrakhova, N. Tomašovičová, V. Komanický, J. Mašlanková and V. Tomečková, Noninvasive diagnostic methods for diabetes mellitus from tear fluid, RSC Adv., 2019, 9(31), 18050 RSC.
| This journal is © The Royal Society of Chemistry 2023 |

