 Open Access Article
A novel HBI-based ratiometric fluorescent probe for rapid detection of trifluoroborate†
Gao Lianga,
Zheng Minghaob,
Liu Haiyic,
Xiao Junb,
Gong Tianhaob,
Liu Kunming *b,
Li Juanhua*b and
Liu Jinbiao
 *b
*b
aGanzhou Teacher's College, Ganzhou, Jiangxi 341000, P. R. China
bJiangxi Provincial Key Laboratory of Functional Molecular Materials Chemistry, Faculty of Materials Metallurgy and Chemistry, Jiangxi University of Science and Technology, 86 Hongqi Road, Ganzhou 341000, P. R. China. E-mail: liukunming@jxust.edu.cn; lijuanhua@jxust.edu.cn; liujinbiao@jxust.edu.cn
cGanzhou No. 3 Middle School, Ganzhou, Jiangxi 341000, China
First published on 9th August 2023
Abstract
A 2-(2′-hydroxyphenyl)benzimidazole (HBI)-based ratiometric fluorescent probe, known as BTEP, was synthesized using 5-bromosalicylaldehyde as the raw material via Sonogashira coupling and condensation reaction. This probe was designed for rapid detection of boron trifluoride solutions and gases. The N and O coordination atoms in the probe undergo a boron difluoride addition with BF3, which affects the process of excited state intramolecular proton transfer (ESIPT) leading to a blue shift of fluorescence emission. Obvious changes in the fluorescence signal can be observed within 60 seconds. The introduction of an acetylene trimethylsilane fragment increases the conjugate plane and is beneficial to improving the selectivity of the probe. The I408/I479 fluorescence ratio of the probe displays a linear relationship with the concentration of BF3 in the range of 5–50 μM, with a detection of limit as low as 69.5 nM. Furthermore, the probe demonstrates specific and selective recognition of BF3 among eight common interference substances. Test strips prepared using BTEP have the capability of real-time naked-eye detection of trace BF3 gas.
1. Introduction
As an important chemical raw material, trifluoroborate (BF3) is widely used not only in the synthesis of inorganic and organic boron compounds,1–3 but also as a Lewis acid catalyst for esterification, alkylation, sulfurization, nitration, and polymerization.4–8 In addition, BF3 is also an important precursor for gas phase deposition in the semiconductor industry.9 However, BF3 has strong corrosion and toxicity, and even minor leakage can lead to environmental pollution and harm to organisms.10 Due to its high activity, BF3 can react with metals, organic substances, and other materials. When exposed to water or moisture, it will explode violently and release hydrogen fluoride gas, causing serious irritation to the respiratory tract, eyes, and skin, and even leading to death.11 Therefore, developing highly sensitive and rapid response BF3 detection methods for real-time monitoring during production, transportation, storage, and use is of great significance for environmental protection and human health.Currently, several detection technologies have been developed, including Fourier transform infrared spectroscopy (FT-TR),12 quartz crystal microbalance (QCMB),13 and chemically impregnated test papers.14 Fluorescent probe are appealing tools in trace pollutant detection due to high sensitivity, simple operation, and obvious signal changes.15–19 However, the examples of BF3 fluorescent probes are limited, and mostly obtained through chemical modification of fluorophores such as rhodamine,20 1,3-diphenyl-1,3-propanedione (DBM),21 isobutylene ketone,22 and coumarin.23
As one of the important fluorescent dyes with excited state intramolecular proton transfer (ESIPT) effect, substituted 2-(2′-hydroxyphenyl)benzimidazole (HBI) presented superior fluorescent properties such as large fluorescence quantum yields in solution, as compared to oxygen or sulfur analogues.24 Pariat et al. synthesized a series of HBI derivatives mono- or bisfunctionalized with ethynyltriisopropylsilane substituents at various positions, demonstrated that the nature of the benzimidazole ring and incorporation of rigid ethynyl-extended moieties at the periphery of the H-bond donor (phenol ring) could afford the fluorophores strong luminescence emission.25 In addition, the synthesis of imidazolium fluorescent materials is simple, cost-effective, and easy to modify. These advantages make HBI have broad application prospects in the field of fluorescent sensing.
In this paper, the HBI segment was used as the main structural backbone and ethynyltrimethylsilane (TMSA) was introduced in the para site of recognition unit (–OH). A novel probe BTEP for rapidly identifying BF3 was designed based on the ESIPT mechanism. On the one hand, due to the formation of a larger conjugate plane between the ethynyl group and HBI skeleton, the elevation in fluorescent efficiency can help to improve the sensitivity of the probe. On the other hand, the electron-withdrawing properties of the TMSA group can be used to adjust the binding ability of the probe with the boron atom, achieving selective recognition of BF3.
2. Experimental section
2.1 Materials and methods
5-Bromosalicylaldehyde, ethyltrimethylsilane, o-phenylenediamine, PdCl2(PPh3)2, PPh3, CuI, trifluoroborate ethyl ether solution, bis(pinacolato)diboron, boric acid, phenylboronic acid, allyl trifluoroborate potassium, hydrogen fluoride, trifluoroacetic acid, potassium fluoride, tetrabutylammonium fluoride and related organic solvents were purchased from Shanghai Aladdin Bio-Chem Technology Co, LTD and used as received.2.2 General instrumentation
Emission spectra were performed on a Fluorescence spectrometer (F-4600). Error limits were estimated: λ (±1 nm); τ (±10%); φ (±10%). Absorption spectra were recorded on UV-6300 spectrophotometer. IR spectra were recorded on Vario EL III Fourier transform infrared spectrometer (Elementar, Germany). 1H NMR (400 MHz) and 13C NMR (100 MHz) spectra were recorded on Bruker Avance AV400 spectrometer (Bruker, Billerica, MA, USA) unless otherwise noted. The chemical shifts (δ) were quoted in parts per million from tetramethylsilane for 1H and CDCl3 for 13C spectroscopy.2.3 Synthesis and characterization of BTEP
![[thin space (1/6-em)]](https://www.rsc.org/images/entities/char_2009.gif) :
:![[thin space (1/6-em)]](https://www.rsc.org/images/entities/char_2009.gif) EA = 40
EA = 40![[thin space (1/6-em)]](https://www.rsc.org/images/entities/char_2009.gif) :
:![[thin space (1/6-em)]](https://www.rsc.org/images/entities/char_2009.gif) 1) to obtained HTEB as a light yellow solid (2.86 g, yield of 88%). IR (KBr, cm−1): 3210, 2876, 2150, 1667, 1476, 848; 1H NMR (400 MHz, CDCl3) δ 11.04 (s, 1H), 9.78 (s, 1H), 7.64 (d, J = 2.1 Hz, 1H), 7.53 (dd, J = 8.7, 2.1 Hz, 1H), 6.87 (d, J = 8.7 Hz, 1H), 0.18 (s, 9H); 13C NMR (400 MHz, CDCl3) δ 196.2, 161.6, 140.2, 137.5, 120.4, 118.0, 115.2, 103.2, 93.9, 0.0.
1) to obtained HTEB as a light yellow solid (2.86 g, yield of 88%). IR (KBr, cm−1): 3210, 2876, 2150, 1667, 1476, 848; 1H NMR (400 MHz, CDCl3) δ 11.04 (s, 1H), 9.78 (s, 1H), 7.64 (d, J = 2.1 Hz, 1H), 7.53 (dd, J = 8.7, 2.1 Hz, 1H), 6.87 (d, J = 8.7 Hz, 1H), 0.18 (s, 9H); 13C NMR (400 MHz, CDCl3) δ 196.2, 161.6, 140.2, 137.5, 120.4, 118.0, 115.2, 103.2, 93.9, 0.0.![[thin space (1/6-em)]](https://www.rsc.org/images/entities/char_2009.gif) :
:![[thin space (1/6-em)]](https://www.rsc.org/images/entities/char_2009.gif) EA = 40
EA = 40![[thin space (1/6-em)]](https://www.rsc.org/images/entities/char_2009.gif) :
:![[thin space (1/6-em)]](https://www.rsc.org/images/entities/char_2009.gif) 1) to obtain a white solid BTEP (2.32 g, yield of 76%). IR (KBr, cm−1): 3288, 2152, 1585, 1498, 1255; 1H NMR (400 MHz, DMSO-d6) δ 13.62 (s, 1H), 13.36 (s, 1H), 8.27 (d, J = 1.9 Hz, 1H), 7.67–7.72 (m, 2H), 7.30–7.46 (m, 3H), 7.04 (d, J = 8.5 Hz, 1H), 0.25 (s, 9H); 13C NMR (400 MHz, DMSO-d6) δ 158.0, 156.6, 150.2, 149.8, 140.0, 134.2, 133.5, 129.3, 127.9, 119.0, 117.3, 114.1, 112.4, 104.5, 91.9, 0.5 (Fig. 1).
1) to obtain a white solid BTEP (2.32 g, yield of 76%). IR (KBr, cm−1): 3288, 2152, 1585, 1498, 1255; 1H NMR (400 MHz, DMSO-d6) δ 13.62 (s, 1H), 13.36 (s, 1H), 8.27 (d, J = 1.9 Hz, 1H), 7.67–7.72 (m, 2H), 7.30–7.46 (m, 3H), 7.04 (d, J = 8.5 Hz, 1H), 0.25 (s, 9H); 13C NMR (400 MHz, DMSO-d6) δ 158.0, 156.6, 150.2, 149.8, 140.0, 134.2, 133.5, 129.3, 127.9, 119.0, 117.3, 114.1, 112.4, 104.5, 91.9, 0.5 (Fig. 1).
2.4 Fluorescence detection of BF3
The experimental details of fluorescent and colorimetric detecting condition optimization were provided in the ESI file.† As for sensitivity testing, BTEP (50 μM) and a various concentrations of BF3 (0–100 μM) were added in a cuvette sequentially. After the above mixed solutions reacted for 60 s, fluorescence spectra were measured and recorded using a Fluorescence spectrophotometer.The limit of detection (LOD) is calculated according to the following formula:
| LOD = 3σ/k |
3. Results and discussion
Since most fluorescent materials are sensitive to external environments, we first studied the effect of BTEP on BF3 recognition in different solvent systems. Common organic solvents such as dichloromethane (DCM), acetonitrile (ACN), N,N-dimethylformamide (DMF) and dimethylsulfoxide (DMSO) were selected as detection solutions, and the fluorescence spectra of probe BTEP before and after adding BF3 were measured. As shown in Fig. 2, the blank probe showed a larger fluorescence intensity in all four solutions. After adding BF3, there was no significant fluorescence change in the ACN, DMF and DMSO detection systems. However, in the DCM detection solution, the maximum fluorescence emission peak shifted from 479 nm to 408 nm. This significant difference in fluorescence signal helps to accurately determine BF3, so DCM was chosen as the detection solvent in subsequent experiments.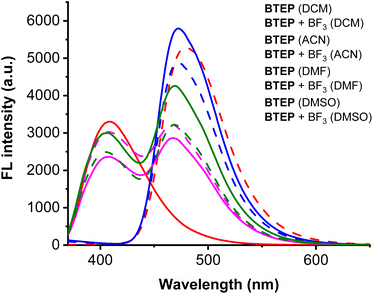 | ||
| Fig. 2 The effect of BTEP (100 μM) on BF3 (200 μM) response under different solvent conditions, λex = 345 nm, rt for 60 s. | ||
The response time is an important indicator for the response capability of probe. The alteration of fluorescence against various incubation time was examined. As shown in Fig. 3, the fluorescence intensity at 408 nm can reach the plateau peak within 60 seconds, and fluorescent intensity enhanced upon to 75 times, indicating that the probe has the ability to detect BF3 in real-time. Hence, the reaction time was selected as 60 seconds in subsequent experiments.
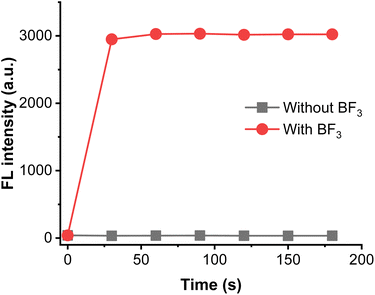 | ||
| Fig. 3 Time-dependent the fluorescent emission of BTEP (100 μM) at 408 nm with BF3 (200 μM), λex = 345 nm. | ||
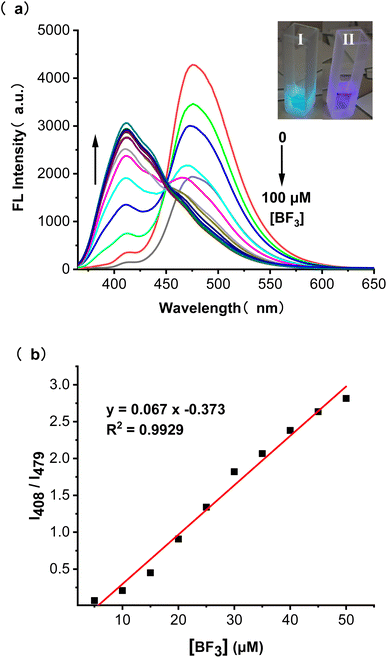
In order to establish the linear relationship between BF3 concentration and fluorescence intensity, we conducted fluorometric titration experiments with different concentrations of BF3 solutions. The fluorescence spectrum is shown in Fig. 4a. When BF3 was added, the emission peak at 479 nm of BTEP gradually weakened, while a new emission peak appeared at 408 nm and its intensity gradually increased. The ratio of the intensity of the two emission peaks (I408/I479) to the concentration of BF3 was plotted, and it was found that there was a good linear relationship at a concentration range of 5–50 μM BF3, resulting in a linear equation of I408/I479 = 0.067[BF3] − 0.373 (R2 = 0.9929). A limit of detection (LOD) was calculated as low as 69.5 nM limit according to LOD = 3σ/k (where σ is the standard deviation of blank measurement, k is the slope between the fluorescence intensity versus BF3 concentration) (Fig. 4b). Additionally, under ultraviolet light, it can be observed that the probe solution changed from light blue to dark blue before and after adding BF3, demonstrating the naked-eye recognition potential of the probe.
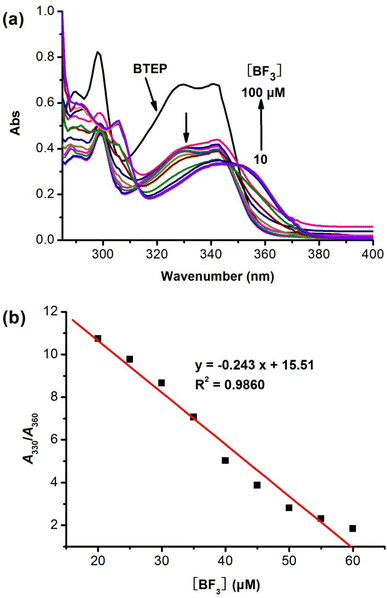
The effect of adding BF3 on the absorption behaviour of BTEP was also investigated. DCM was found to be the most suitable solution for selective colorimetric detection of BF3 (Fig. S7†). The BTEP has a distinct absorption peak at 330 nm in UV-vis spectrum, which gradually disappeared with increasing the concentration of BF3. Simultaneously, the absorption at 360 nm occurred and increased significantly (Fig. 5a). The probe BTEP exhibited an excellent linearity between the absorbance ratio (A330/A360) and the concentration of BF3 from 20 to 60 μM, R2 = 0.9860 (Fig. 5b). Thus, BTEP could be promising as a naked eye colorimetric sensor for BF3 detection.
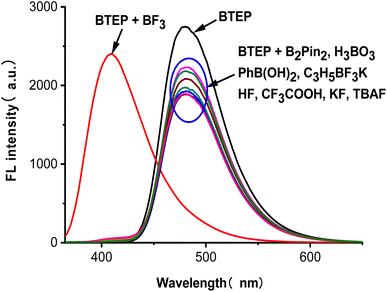
High selectivity to analyte over potentially competing species is an important indicator for the anti-interference capability of probe. To examine the selectivity of BTEP, we chose eight common borates and fluorides to add to the probe solution and performed fluorescence spectra measurements. As shown in Fig. 6, the addition of common borates and fluorides such as bis(pinacolato)diboron, boric acid, phenylboronic acid, allyl trifluoroborate potassium, hydrogen fluoride, trifluoroacetic acid, potassium fluoride, and tetrabutylammonium fluoride only resulted in a slight decrease of fluorescence. Nevertheless, the addition of BF3 leaded to a significant blue shift in the fluorescent emission peak, indicating that BTEP has a specific recognition ability for BF3.
The addition of BF3 to the N, O ligand atoms in a typical ESIPT molecule such as 2-(2′-hydroxyphenyl)benzothiazole (HBT), the C–C bond configuration connecting the benzothiazole and phenol moieties will be locked. This process is often accompanied by a significant difference in fluorescence signal.26,27 The 1H NMR spectra of BTEP before and after the addition of BF3 shows in Fig. 7. The most significant change is the disappearance of the peaks at 13.36 ppm and 13.62 ppm, accompanied by the emergence of peak at 11.71 ppm, which is due to the addition between BF3 and hydroxyl groups of BTEP. This process also affects the chemical shift of –NH in benzimidazole unit. Therefore, it can be indicates that the blue shift of fluorescent emission is caused by the formation of BTEP–BF2 adducts.
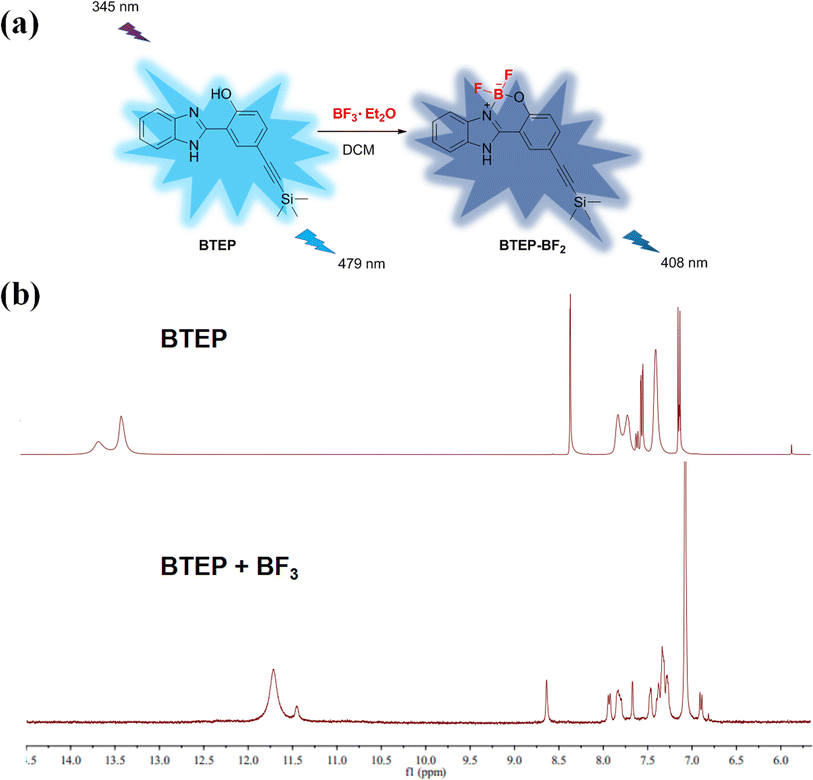 | ||
| Fig. 7 (a) Proposed detection mechanism; (b) 1H NMR spectra of BTEP before and after the addition of BF3. | ||
Given the high sensitivity, selectivity, and rapid response ability of probe BTEP for detecting trifluoroborate ethyl ether solution, we have prepared a test strip based on it and attempted to use it for naked-eye identification of BF3 gas. The test strip was encapsulated in different concentrations of BF3 vapor as shown in Fig. 8. Under UV light at 365 nm, the test strip emitted bright blue fluorescence. At room temperature, the test strip responded quickly within 5 minutes for BF3 gas concentrations within the range of 10 μM to 10 mM. As the concentration of BF3 gas increased, the test strip gradually changed from bright blue to deep blue fluorescence through naked-eye observation, indicating that the BTEP test strip has potential application value for real-time early warning of trace BF3 gas in the environment.
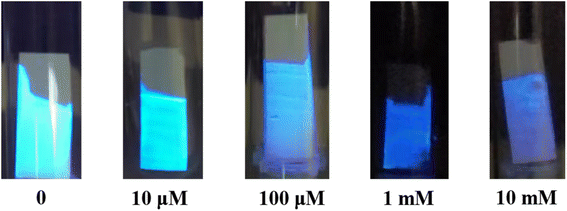 | ||
| Fig. 8 Photographs of fluorescent response of BTEP test strips in the different concentrations of BF3 gas. | ||
4. Conclusions
In this work, a rapid ratiometric fluorescent probe BTEP for the selective detection of BF3 has been synthesized. By forming a BF2 adduct in the HBI skeleton through the coordination of N and O atoms with BF3, the ESIPT process of the probe is affected, resulting in blue shift of fluorescence emission. Within a range of 5–50 μM concentration of BF3 in dichloromethane solution, the linear increase of fluorescence ratio at I408/I479 exhibits LOD as low as 69.5 nM. The absorbance response of BF3 at BTEP was linear in the wide range of 20–60 μM. Additionally, test strips for real-time naked-eye identification of BF3 gas have been prepared.Conflicts of interest
The authors declare that they have no known competing financial interests or personal relationships that could have appeared to influence the work reported in this paper.Acknowledgements
Financial support from the Jiangxi Provincial Natural Science Foundation (20212BAB203013), the Science and Technology Project Founded by the Education Department of Jiangxi Province (GJJ2200820, GJJ181187), National College Students' Innovation and Entrepreneurship Training Program (202110407006) is gratefully acknowledged.References
- K. Chansaenpak, M. Z. Wang, H. Wang, B. C. Giglio, F. P. Gabbaï, Z. H. Wu and Z. Li, RSC Adv., 2017, 7, 17748–17751 RSC.
- N. An, H. Pi, L. Liu, W. Du and W. Deng, Chin. J. Chem., 2011, 29, 947–950 CrossRef CAS.
- B. Köksoy, E. N Kaya, F. Hacıvelioğlu, S. Yeşilot and M. Durmuş, Dyes Pigm., 2017, 140, 384–391 CrossRef.
- S. Sultana, S. M. B. Maezono, M. S. Akhtar, J. Shim, Y. Wee, S. H. Kim and Y. R. Lee, Adv. Synth. Catal., 2018, 360, 751–761 CrossRef CAS.
- P. Costa, I. Trosien, J. Mieres-Perez and W. Sander, J. Am. Chem. Soc., 2017, 139, 13024–13030 CrossRef CAS PubMed.
- M. M. Huang, L. Z. Hu, S. Hang, Q. Liu, M. I. Hussain, J. Pan and Y. Xiong, Green Chem., 2016, 18, 1874–1879 RSC.
- X. G. Yang, K. K. Wu and Z. K. Yu, Tetrahedron Lett., 2015, 56, 4490–4493 CrossRef CAS.
- H. Shen, J. Li, Q. Liu, J. Pan, R. F. Huang and Y. Xiong, J. Org. Chem., 2015, 80, 7212–7218 CrossRef CAS PubMed.
- S. Gene, G. Gordon, P. Timothy and S. Michael, J. Mater. Res., 2018, 33, 4233–4240 CrossRef.
- G. M. Rusch, G. M. Hoffman, R. F. McConnell and W. E. Rinehart, Toxicol. Appl. Pharmacol., 1986, 83, 69–78 CrossRef CAS PubMed.
- Y. Minoru, T. Kazuhiro, I. Keisuke, G. Kenta, T. Fumito and O. Hideki, Photochem. Photobiol. Sci., 2019, 18, 2884–2892 CrossRef PubMed.
- M. M. Roshani, E. Rostaminikoo, E. Joonaki, A. M. Dastjerdi, B. Najafi, V. Taghikhani and A. Hassanpouryouzband, Fuel, 2022, 313, 122998 CrossRef CAS.
- Y. M. Liu, J. Y. Zhang, Y. Z. Wang, C. Y. Liu, G. L. Zhang and W. S. Liu, Sens. Actuators, B, 2017, 243, 940–945 CrossRef CAS.
- B. A. Denenberg and R. Kriesel, Am. Ind. Hyg. Assoc. J., 1976, 37, 246–250 CrossRef CAS PubMed.
- Q. X. Ye, S. F. Ren, H. Huang, G. G. Duan, K. M. Liu and J. B. Liu, ACS Omega, 2020, 5, 20698–20706 CrossRef CAS PubMed.
- L. Q. Li, M. H. Zheng, X. Y. Yan, H. Huang, S. X. Cao, K. M. Liu and J. B. Liu, J. Photoch. Photobio. A-Chem., 2022, 432, 114069 CrossRef CAS.
- D. D. Jiang, M. H. Zheng, X. Y. Yan, B. Huang, H. Huang, T. H. Gong, K. M. Liu and J. B. Liu, RSC Adv., 2022, 12, 31186–31191 RSC.
- L. Q. Li, M. H. Zheng, D. D. Jiang, S. X Cao, K. M. Liu and J. B. Liu, Prog. Chem., 2022, 34, 1815–1830 CAS.
- C. T. Shi, Z. Y. Huang, A. B. Wu, Y. X. Hu, N. C. Wang, Y. Zhang, W. M. Shu and W. C. Yu, RSC Adv., 2021, 11, 29632–29660 RSC.
- Y. Z. Wang, Y. Yang, F. Z. Qiu, Y. Feng, X. R. Song, G. l. Zhang and W. S. Liu, Sens. Actuators, B, 2018, 276, 166–172 CrossRef CAS.
- P. Banet, L. Legagneux, P. Hesemann, J. Moreau, L. Nicole, A. Quach, C. Sanchez and T. Tranthi, Sens. Actuators, B, 2008, 130, 1–8 CrossRef CAS.
- Z. L. Wang, Y. Zhang, J. Song, Y. Y. Wang, M. X. Li, Y. Q. Yang, X. Xu, H. J. Xu and S. F. Wang, Sens. Actuators, B, 2020, 304, 127083 CrossRef CAS.
- H. Zhao, T. Wu, Y. Sun, L. Duan and Y. Ma, Chem. Res. Chin. Univ., 2021, 42, 2422–2427 CAS.
- S. K. Behera, G. Sadhuragiri, P. Elumalai, M. Sathiyendiran and G. Krishnamoorthy, RSC Adv., 2016, 6, 59708–59717 RSC.
- T. Pariat, M. Munch, M. Durko-Maciag, J. Mysliwiec, P. Retailleau, P. M. Vérité, D. Jacquemin, J. Massue and G. Ulrich, Chem.–Eur. J., 2021, 27, 3483–3495 CrossRef CAS PubMed.
- V. S. Padalkar and S. Seki, Chem. Soc. Rev., 2016, 45, 169–202 RSC.
- X. Li and Y. A. Son, Dyes Pigm., 2014, 107, 182–187 CrossRef CAS.
Footnote |
| † Electronic supplementary information (ESI) available. See DOI: https://doi.org/10.1039/d3ra04474b |
| This journal is © The Royal Society of Chemistry 2023 |


