 Open Access Article
Mechanism of synergistic removal of NO and SO2 by sodium bicarbonate
Song Shuab,
Yiqi Huangc,
Longhua Zoud,
Xinyi Zhangc and
Jianjun Li *ab
*ab
aCollege of Carbon Neutrality Future Technology, Sichuan University, Chengdu 610065, China. E-mail: jjli@scu.edu.cn
bNational Engineering Research Center for Flue Gas Desulfurization, Chengdu 610065, China
cCollege of Architecture and Environment, Sichuan University, Chengdu 610065, China
dCollege of Food and Biological Engineering, Chengdu University, Chengdu 610106, China
First published on 6th November 2023
Abstract
Sodium bicarbonate (NaHCO3) is considered to be an effective alkaline adsorbent for SO2 removal and surprisingly, the concentration of NO is significantly reduced along with the generation of NO2 during its desulfurization. Unfortunately, the mechanism of NO interaction with NaHCO3, SO2 and O2 is ambiguous. In this work, the effects of absorption gas and absorber composition on SO2/NO absorption performance were explored, the absorption products were characterized using XPS and SEM, and the Gibbs free energy of the inferred reaction path was calculated based on density functional theory (DFT). The results showed that SO2 and O2 synergistically promoted the absorption and removal of NO by NaHCO3, which could completely remove SO2 and absorb 90% of NO at 160 °C. Sodium metabisulfite (Na2S2O5) and sodium dithionate (Na2S2O6) were identified as the active substances responsible for efficient NO absorption, and the oxidation of Na2S2O5 to Na2S2O6 is the controlling step of the NO removal reaction. Specifically, Na2S2O5 is an intermediate produced by the reaction of NaHCO3 with SO2, and subsequently reacts with O2 to produce Na2S2O6, which releases reactive oxygen species to oxidize NO to NO2. In addition, when the S/N ratio is greater than 1 and the O2 content is greater than 5%, both SO2 and NO can maintain removal efficiency higher than 90%, indicating that the absorption reaction of SO2 and NO by NaHCO3 is highly adaptable to the flue gas composition.
1. Introduction
As the world's population and energy demand increase, continued industrialization will undoubtedly raise the levels of atmospheric pollutants, such as SO2 and NO, which are harmful to the environment and human health. Flue gas desulfurization (FGD) and ammonia-based selective catalytic reduction (NH3-SCR) denitrification are simultaneously applied for controlling pollutant emissions in power plants.1–3 However, desulfurization performed using wet sorbents requires large installation space, large amounts of water and high capital as well as operating costs,4–6 and research has shifted toward dry methods of SO2 removal. Various types of solid sorbents/catalysts are being used for dry FGD, like calcium based,2 sodium based,7,8 activated carbon,9,10 and metal oxide.11 Among the dry sorption, sodium bicarbonate (NaHCO3) has attracted particular interest because of its ability to produce valuable solid compounds with SO2, such as sodium sulfite and sulfate, which can be used as alkali agent, anti-caking agent and neutralizer. In addition, NaHCO3 as a SO2 dry-sorbent can couple cost-effectiveness and environmental compatibility in practical engineering applications, and it has been implemented in a great number of plants in Europe.12–15Surprisingly, the concentration of NOx was simultaneously reduced during the desulfurization with NaHCO3,16 providing the possibility to realize integrated removal of multiple pollutants in a single system. Barbara Walawska et al. stated that the efficiency of NaHCO3 for NOx removal was about 21% at 300 °C,17 but failed in the absence of SO2. It was presumed that the intermediate of Na/SOx generated by the desulfurization reaction plays a key role in NO removal, especially sodium metabisulfite (Na2S2O5). Unfortunately, the efficient Na/SOx intermediates are still ambiguous and the synergistic removal mechanisms of SO2 and NOx are currently lacking in research.
In this work, the effect of gas composition on the absorption of SO2 and NO by NaHCO3 was investigated using a fixed-bed reactor. The Na/SOx intermediates generated by the FGD process were characterized by scanning electron microscopy (SEM) and X-ray photoelectron spectroscopy (XPS), and then the adsorption properties of a series of possible Na/SOx on SO2 and NO were examined. Furthermore, the effects of O2 in NO oxidation and Na/SOx formation was evaluated. Most interestingly, the reaction paths were inferred from density functional theory (DFT) calculations of Gibbs freedom to elucidate the mechanism of NO and SO2 removal by Na/SOx. Overall, we pave the way for the development of NaHCO3 for simultaneous desulfurization and denitrification.
2. Materials and methods
2.1 Materials
The analytical grade of NaHCO3 with mean diameter of 50–100 μm, sodium carbonate (Na2CO3), sodium bisulfite (NaHSO3), sodium sulfite (Na2SO3) and Na2S2O5 were all purchased by Kelong Company. Na2S2O6, which is in science labs, was synthesized by the following chemical method:| MnO2 + 2SO2 = MnS2O6 | (1) |
| MnS2O6 + Na2CO3 = Na2S2O6 + MnCO3 | (2) |
2.2 Experimental sections
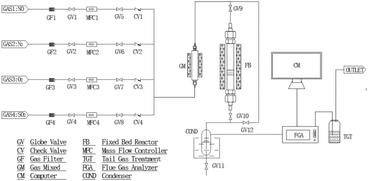
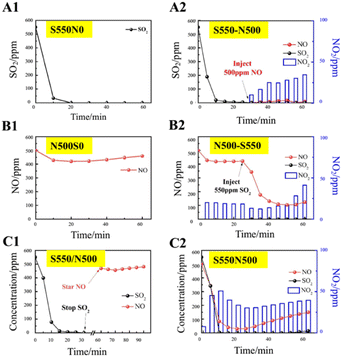
The experiments were carried out in the fixed-bed reactor with a diameter of 2 cm and a height of 1.6 cm at ambient, depicted schematically in Fig. 1. The simulated flue gas consisted of SO2, NO, O2 and N2, supplied by a compressed cylinder and metered by a mass flow controller. The concentration of the gas compositions in the inlet and outlet flows was monitored by a flue gas analyzer (Testo 350, Germany). The temperature inside the bed was controlled by thermocouples.To investigate the synergy effects on the adsorption of SO2 and NO by NaHCO3, individual and simultaneous sorption process were designed. The uniform reaction conditions set for SO2 and NO adsorption by NaHCO3 included T = 160 °C, GHSV = 10![[thin space (1/6-em)]](https://www.rsc.org/images/entities/char_2009.gif) 000 h−1, flow rate = 1 L min−1, 5 vol% O2 and adsorption residence time of 60 min. The composition of the adsorption gas was adjusted as a variable and its specific names are listed in Table 1.
000 h−1, flow rate = 1 L min−1, 5 vol% O2 and adsorption residence time of 60 min. The composition of the adsorption gas was adjusted as a variable and its specific names are listed in Table 1.
| Sample | Gas compositions | |
|---|---|---|
| 0–30 min | 31–60 min | |
| S550N0 | 550 ppm SO2 | |
| N500S0 | 500 ppm NO | |
| S550/N500 | 550 ppm SO2 | 500 ppm NO |
| S550-N500 | 550 ppm SO2 | 550 ppm SO2 + 500 ppm NO |
| N500-S550 | 500 ppm NO | 500 ppm NO + 550 ppm SO2 |
| S550N500 | 550 ppm SO2 + 500 ppm NO | |
The desulfurization and denitration properties of the possibility Na/SOx included Na2CO3, NaHSO3, Na2SO3, Na2S2O5, and Na2S2O6 were than examined, respectively. Since NaHSO3 and Na2S2O5 would release SO2 at 160 °C according to the results of pre-experiments, NaHSO3 and Na2S2O5 as additives were set in the ratios of 1![[thin space (1/6-em)]](https://www.rsc.org/images/entities/char_2009.gif) :
:![[thin space (1/6-em)]](https://www.rsc.org/images/entities/char_2009.gif) 4 with NaHCO3 to measure their effects on NO removal. In addition, the role of O2 in the oxidation of NO was investigated by coexisting/not coexisting O2 in the sorption gas.
4 with NaHCO3 to measure their effects on NO removal. In addition, the role of O2 in the oxidation of NO was investigated by coexisting/not coexisting O2 in the sorption gas.
2.3 Characterization methods
The thermal decomposition properties were characterized using an SDTQ600 instrument (TA Instruments, USA) at a heating rate of 5 °C min−1 to 200 °C and a N2 flow rate of 100 mL min−1. The specific surface areas were calculated by the Brunauer–Emmett–Teller (BET) method, and the pore sizes and pore capacities were calculated by the Barrett–Joyner–Halenda (BJH) method. SEM images of sorbent particle were performed using a JSM-7500F scanning electron microscope (JEOL Japan) at an acceleration voltage of 5 kV. X-ray photoelectron spectra (XPS) with Al Kα source carried out on a Thermo ESCALAB250Xi instrument was used to characterize and semi-quantify the chemical compositions of reacted Na/SOx.2.4 Computational section
To identify the differences in Gibbs free energy (ΔG) of the reactions involved, Density Functional Theory (DFT) calculations were performed with VASP 5.3.5 code.18,19 Generalized gradient approximation with Perdew–Burke–Ernzerhof exchange and correlation functional were used.20 A plane-wave basis set of 400 eV cut off energy was employed in the framework of projector-augmented wave method.21 The Gaussian smearing with a width of 0.2 eV was used. The convergence criteria for the energy and force were set to 10−5 eV and 0.01 eV Å−1. ΔG is calculated as the following:| ΔG = Gproduct − Greactant | (3) |
| Gg(T,P) = EDFT(K0,P0)+ΔHg(K0 → T,P0) − TSg(T,P0) | (4) |
3. Results and discussion
3.1 Thermal decomposition properties of NaHCO3
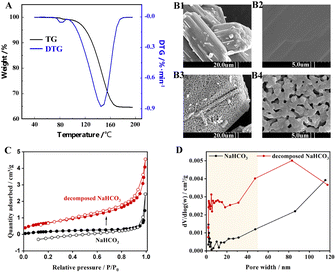
The Fig. 2A shows that NaHCO3 decomposes at 80–160 °C, with the fastest rate of decomposition at 145 °C, while the weight loss at 80 °C corresponds to the separation of bound water.23 The thermal decomposition process of NaHCO3 is an active development, which is shown in the SEM images (Fig. 2B). As seen in Fig. 2B1 and B2, the physical structure of the initial NaHCO3 particles is nonporous, while the decomposed NaHCO3 in Fig. 2B3 and B4 produces some visible micro-grade pores of about 1 μm. BET measurements were further carried out to characterize the pore structure of NaHCO3. The N2 adsorption–desorption isotherm results of are shown in Fig. 2C, where the specific surface area of NaHCO3 increases from 0.7 to 2.4 m2 g−1 after thermal decomposition at 160 °C, which is consistent with the shrinkage nucleation model.24 The results of the pore size distribution in Fig. 2D indicate that the thermal decomposition of NaHCO3 favours the formation of multistage pores, and these well-developed pore structures are expected to provide channels and sites for the physical and chemisorption of SO2/NO.3.2 Performance of NaHCO3 in absorbing SO2/NO
To investigate the effect of SO2 on the absorption of NO by NaHCO3, a series of single-component absorption experiments were first carried out and the results correspond to Fig. 3. In Fig. 3A1, the concentration of SO2 drops sharply to 0 at the beginning of the reaction for 10 min, and remains complete absorption until the end of the reaction, indicating the dominance of NaHCO3 in desulfurization. However, the concentration of NO in Fig. 3B1 decreases from 500 to 400 ppm at most and then rises to 500 ppm, implying that the individual uptake of NO by NaHCO3 is weak and occurs mainly through physical adsorption and the spontaneous reaction of NO oxidation to NO2. On this basis, a performance test (Fig. 3C1) was conducted with pre-sorption of SO2 followed by NO adsorption, resulting in no decrease in NO concentration after stopping SO2 injection. The above results show that NaHCO3 has good SO2 absorption performance, but it is ineffective for single NO absorption, and pre-absorption of SO2 has no effect on NO absorption by NaHCO3.The sorption performance of the S550-N500, N500-S550 and S550N500 samples with SO2 and NO coexisting was shown in Fig. 3A2, B2 and C2. It is easily found that the coexistence of SO2 significantly promotes the absorption and conversion of NO and increase the production of NO2, inferring that the Na/SOx intermediates produced by the reaction of SO2 with NaHCO3 as active substances stimulate the absorption of NO. When NO is exposed to 550 ppm of SO2 (Fig. 3A2), the NO concentrations immediately decrease to 0 ppm, while a maximum of about 35 ppm of NO2 is detected in 30 min. The date in Fig. 3B2 show that when SO2 is introduced into the NO being absorbed, the concentration of SO2 rapidly drops to 0 ppm and the concentration of NO followed down to a minimum of 100 ppm accompanied by an increase in the concentration of NO2 from 20 to 40 ppm. Similarly, as shown in Fig. 3C2, the concentration of SO2 decreases faster than that of NO when SO2 and NO are in contact with NaHCO3 at the same time, and the absorption of SO2 is significantly higher than that of NO, which indicates that NaHCO3 preferentially absorbs SO2 relative to NO.
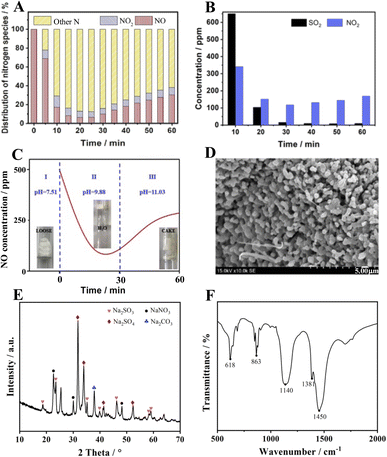
Another finding is that the amount of NO2 present is much smaller than the amount of NO absorbed, implying that a large number of nitrogenous species are stored in the absorber. The distribution of nitrogen species given in Fig. 4A for other nitrogenous species exceeds 60% of the NO feeding, indicating that the S550N500 absorber removes NO mainly through the formation of other nitrogenous species. However, it is uncertain whether NO2 is an active intermediate species for NO removal, so experiments of mixed NO2 and SO2 removal were conducted. The results in Fig. 4b show that the NO2 concentration is reduced from 360 to 140 ppm with 60% removal when SO2 is coexisted and this implies that NaHCO3 has good absorption properties for NO2. Therefore, NO2 is an important intermediate for NO removal, and it is the unabsorbed NO2 that is detected in the gas.
In addition, the changes in absorber morphology and pH were also recorded, and the results are shown in Fig. 4C. The unreacted NaHCO3 is a loose, weakly basic salt with a pH of 7.51. When the reaction proceeds for 30 min, a large amount of water mist appears in the tube due to the release of water molecules from the thermal decomposition of NaHCO3, at which time the pH is 9.88. It is noteworthy that the best NO removal efficiency is achieved at this time. As the reaction is prolonged, the absorber gradually condenses into lumps as the pH increases to 11.0, leading to a decrease in NO absorption performance. The SEM image of S550N500 after reaction with SO2 and NO is shown in Fig. 4D. Unlike the morphology of NaHCO3 after thermal decomposition, crystalline products cover the surface of S550N500, confirming the occurrence of the chemisorption reaction.
The XRD data of the absorption products are shown in Fig. 4E, and not surprisingly, Na2CO3, the thermal decomposition product of NaHCO3, is detected at 37.8°. The characteristic peaks of Na2SO3 (JCPD 37-1488) appear at 18.7°, 23.5°, 35.2°, 40.0°, 46.4°, 58.3° and 59.1°, which are easily oxidized to Na2SO4 with 2θ = 31.8°, 33.9°, 41.4°, and 52.3° (JCPD 37-1475). In addition, diffraction peaks located at 22.6°, 30.1° and 48.2° are attributed to NaNO3 according to JCPD 36-1474, confirming the chemical reaction between NO and the absorbent.
Fig. 4F shows the FTIR spectra of the samples after the absorption reaction. In addition to the peaks of Na2CO3 at 863 and 1450 cm−1, the characteristic peaks corresponding to Na2SO4 appear at 618 and 1140 cm−1, while that of NaNO3 is at 1381 cm−1, implying that the reaction products of NaHCO3 with SO2 and NO mainly include Na2CO3, Na2SO4 and NaNO3.25–27
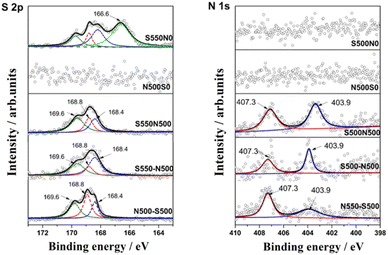
The reaction products were then characterized by XPS, and the high-resolution spectra of S 2p and N 1s were illustrated in Fig. 5. For S 2p, the peaks with binding energy located at 166.7 ± 0.2 eV can be attributed to Na2SO3 and NaHSO3, while the peaks at 168.8 eV correspond to the mixed Na2S2O5 and Na2S2O6,28–30 which are generated by the following eqn (6)–(13).31 In addition, two characteristic peaks corresponding to the product Na2SO4 (Na2SO4 (1) and Na2SO4 (2)) are found at 168.4 eV and 169.6 eV, respectively.32 This is consistent with Tim C. Keener that NaHCO3 can react directly with SO2 or with SO2 after thermal decomposition, which gives rise to a multi-path reaction scheme between NaHCO3 and SO2 with temperature-sensitive properties.24,33 When the reaction temperature reaches 413 K, the formation of Na2SO4 (1) by SO2 uptake occurs mainly in the Na2CO3 micropores produced by the thermal decomposition of NaHCO3,8 and the amount of this Na2SO4 production is huge, accounting for 61% of the total S of S550N0. Moreover, Na2SO4 (2) located at 169.6 eV can be reasonably attributed to the direct reaction generation at the S550N0 surface with a percentage of about 4.4%.
For S550-N500, N500-S550 and S550N500, four forms of sulfur species existed after simultaneously absorption of SO2 and NO, including two types of Na2SO4, Na2S2O5 and Na2S2O6, with Na2S2O6 and Na2SO4 (2) predominating. However, the introduction of NO affects the distribution of sulfur species. Notably, when NO is present in the absorbed gas, Na2SO3/NaHSO3 disappears while Na2SO4 (2) is enriched, indicating that the conversion of SO32− to SO42− is promoted.
The N 1s XPS spectra given in Fig. 5B can distinguish two typical components with peaks located at 407.3 eV and 403.9 eV, which belong to sodium nitrate (NaNO3) and sodium nitrite (NaNO2), respectively.34,35 Combined with the absorption performance of NO in the coexistence of SO2 in Fig. 3, it is confirmed that the main products of NO conversion are nitrate nitrogen (NO2− and NO3−).
3.3 Performance of Na/SOx in absorbing NO
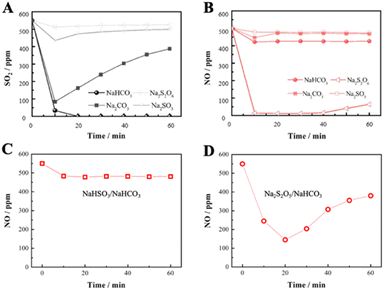
Based on the above, the desulfurization/denitrification performance of specific intermediates was further investigated, including Na2CO3, Na2SO3 and Na2S2O6. From Fig. 6A, NaHCO3 is the best absorbent for desulfurization, and Na2CO3 is easily saturated by SO2 adsorption, while the desulfurization efficiency of Na2SO3 and Na2S2O6 is poor. During denitrification, as shown in Fig. 6B, Na2S2O6 is the only effective absorber that can immediately react with NO and maintain prolonged uptake of NO. This indicates that Na2S2O6 generated by the desulfurization is mainly responsible for the absorption reaction of NO. Further, an absorber with a 1![[thin space (1/6-em)]](https://www.rsc.org/images/entities/char_2009.gif) :
:![[thin space (1/6-em)]](https://www.rsc.org/images/entities/char_2009.gif) 4 ratio of NaHSO3 or Na2S2O5 to NaHCO3 was configured for probing its absorption activity of NO. As shown in Fig. 6C and D, NaHSO3 has almost no denitrification activity, while Na2S2O5 performs well in absorbing NO, reducing the concentration from 550 to 150 ppm. According to eqn (7)–(12), Na2S2O5 as a reactant can produce Na2S2O6, which promotes the absorption and conversion of NO.
4 ratio of NaHSO3 or Na2S2O5 to NaHCO3 was configured for probing its absorption activity of NO. As shown in Fig. 6C and D, NaHSO3 has almost no denitrification activity, while Na2S2O5 performs well in absorbing NO, reducing the concentration from 550 to 150 ppm. According to eqn (7)–(12), Na2S2O5 as a reactant can produce Na2S2O6, which promotes the absorption and conversion of NO.
3.4 Effect of O2 on the absorption of SO2 and NO
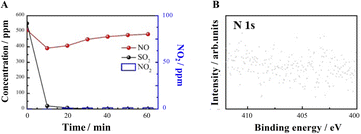
The role of O2 in NO and SO2 adsorption and removal was further investigated. The results in Fig. 7A show that without O2, SO2 sorption is not affected, but NO removal and NO2 generation are significantly inhibited. XPS results (Fig. 7B) show that both NO2− and NO3− are not generated in the absence of O2, speculating O2 is necessary for the synergistic removal of NO by SO2 and NaHCO3.3.5 Gibbs free energy of reactions
For the possible intermediate species and reaction pathways involved in the process of SO2 and NO uptake by NaHCO3, the following schematic diagram 8 and eqn (5)–(14) are described, and the relevant Gibbs free energy (ΔG) is calculated.Overall reaction:
| NaHCO3 + NO + SO2 + O2 → Na2SO4 + NO2 + NaNO3 + H2O + CO2 | (5) |
Step A:
| NaHCO3 + SO2 = NaHSO3 + CO2 | (6) |
| 2NaHSO3 = Na2S2O5 + H2O | (7) |
Step B:
| 2NaHCO3 ≜ Na2CO3 + H2O + CO2 | (8) |
| NaCO3 +SO2 = Na2SO3 + CO2 | (9) |
| 2Na2CO3 + 3SO2 = Na2SO3 + Na2S2O5 + 2CO2 | (10) |
Step C:
2Na2S2O5 + O2 ![[left over right harpoons]](https://www.rsc.org/images/entities/char_21cb.gif) 2Na2S2O6 2Na2S2O6
| (11) |
| Na2S2O6 + NO = Na2S2O5 + NO2 | (12) |
| Na2S2O5 = Na2SO3 + SO2 | (13) |
Step D:
| 2NaHCO3 + 2NO2 = NaNO2 + NaNO3 + 2CO2 + H2O | (14) |
The generation of Na2S2O5 from NaHCO3 during desulfurization is thermodynamically favorable, and steps A and B are considered as two possible reactions with ΔG of −3276 and −5105 kJ mol−1, respectively. Step B shows that the generation of Na2S2O5 from Na2CO3 is also thermodynamically feasible, which ΔG is about −1281 kJ mol−1. This indicates that NaHCO3 can be directly or thermally decomposed into Na2CO3 to react with SO2 to form Na2S2O5. Steps C and D, as key steps in NO removal, describe the oxidation of NO to NO2 by O2 and Na2S2O5 and further conversion of NO2 to NOX− with ΔG of 675 kJ mol−1 (11), −158 kJ mol−1 (12), −858 kJ mol−1 (13) and −1721 kJ mol−1 (14), respectively. This means that the oxidation of Na2S2O5 to Na2S2O6 is the controlling step of the whole reaction (Table 2).
| Structure | ΔfG° kJ mol−1 | Structure | EDFT eV | ΔHg(0 K → 500 K,P0) kJ mol−1 | Sg(T,P0) J mol−1 K−1 | Gg(500 K,P0) kJ mol−1 |
|---|---|---|---|---|---|---|
| NaHCO3 | −852 | O2 | −9.8 | 4.34 | 172.20 | −1031.2 |
| Na2CO3 | −1048 | SO2 | −11.0 | 8.76 | 270.49 | −1200 |
| Na2SO3 | −1012 | NO | −12.2 | 6.06 | 226.26 | −1290.4 |
| Na2SO4 | −1270 | NO2 | −15.5 | 8.1 | 260.64 | −1626.4 |
| NaNO2 | −285 | H2O | −13.6 | 6.92 | 206.53 | −1415.8 |
| NaNO3 | −367 | CO2 | −22.7 | 8.30 | 234.90 | −2304.9 |
| Na2S2O5 | −1354 | N2 | −16.4 | 5.91 | 206.74 | −1683.7 |
| Na2S2O6 | −1532 |
In summary, pathways A and B describe the chemical interaction between NaHCO3 and SO2 to produce the intermediate Na2S2O5. According to path C, the reaction properties of NaHCO3 with NO depend on the formation of Na2S2O6 from Na2S2O5. The NO molecule acts as a Lewis acid and reacts on the surface of Na2S2O6 to form NO2.37 Gradually, the generated NO2 achieves a dynamic equilibrium of adsorption–desorption, and then reacts with NaHCO3 to form NOx−. The removal mechanism and reaction pathway are shown in Fig. 8.
Considering that SO2 and O2 are the key factors that synergistically promote NO absorption, it is necessary to optimize the content of coexisting SO2 and O2 for improving the NO absorption performance. The ration of SO2 and NO (S/N) of the absorbed gases are set to 0.5, 1, 2, 3, and 4, respectively, where the NO concentration is fixed at 500 ppm and the SO2 concentration corresponds to 250, 500, 1000, 1500, and 2000 ppm. The results in Fig. 9A show that S/N has a small effect on the SO2 removal, which is maintained above 95%. However, the efficiency of NO removal is only 34% when S/N is 0.5, which is considered that the oxidative absorption of NO is limited by the small number of reactive intermediates generated on the absorber surface. With S/N higher than 1, the absorption efficiency of NO is stabilized at about 90%. As the S/N increases to 1, the NO removal stabilizes to about 90%, emphasizing the necessity of SO2 for NO absorption. As shown in Fig. 9B, the O2 concentration does not affect the SO2 absorption efficiency, which is always maintained at about 100%. However, when the O2 content is increased from 0 to 5%, the NO removal efficiency dramatically increases from 11% to about 91%, and increasing the content of O2 to 20% has no significant effect on the NO removal. Therefore, the NO removal by NaHCO3 has the advantage of being highly adaptable to SO2 and O2 content of flue gas.
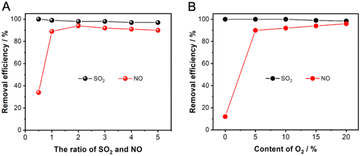 | ||
| Fig. 9 Effect of (A) the ration of SO2 and NO and (B) the content of O2 on the adsorption of SO2 and NO. | ||
4. Conclusions
The NaHCO3 simultaneous removal of SO2 and NO perform a good activity. NaHCO3 can completely adsorb SO2 and absorb 90% of NO at 160 °C. The NO oxidation observed after the reaction with SO2 and NaHCO3 is due to the formation of Na/SOx species. The most likely reactive Na/SOx demonstrated theoretically and experimentally include Na2S2O6 and Na2S2O5. In addition, coexisting SO2 and O2 are the main factors for forming Na/SOx. The Na2S2O5 formed by the reaction of SO2 with NaHCO3 further reacts with O2 to form Na2S2O6, which could significantly alter the overall rate of the NO oxidation. Mechanistic studies have shown that the oxidation of NO to NO2 is the key step for its efficient uptake and requires additional energy. This study clearly demonstrates the removal of NO by NaHCO3 in the presence of SO2 and O2, which will be instructive for the synergistic removal of SO2 and NO.Conflicts of interest
There are no conflicts to declare.Acknowledgements
This work was supported by Sichuan Science and Technology Program (2023YFS0354).Notes and references
- Y. Zhao, T. Guo, Z. Chen and Y. Du, Chem. Eng. J., 2010, 160, 42–47 CrossRef CAS.
- C.-F. Liu and S.-M. Shih, Ind. Eng. Chem. Res., 2006, 45, 8765–8769 CrossRef CAS.
- Y. Liu, W. Xu, L. Zhao, Y. Wang and J. Zhang, Energy Fuels, 2017, 31, 12364–12375 CrossRef CAS.
- A. G. Chmielewski, E. Zwolińska, J. Licki, Y. Sun, Z. Zimek and S. Bułka, Radiat. Phys. Chem., 2018, 144, 1–7 CrossRef CAS.
- R.-B. Lin, S.-M. Shih and C.-F. Liu, Chem. Eng. Sci., 2003, 58, 3659–3668 CrossRef CAS.
- J.-H. Park, J.-W. Ahn, K.-H. Kim and Y.-S. Son, Chem. Eng. J., 2019, 355, 351–366 CrossRef CAS.
- I. Bahrabadi-Jovein, S. Seddighi and J. Bashtani, Energy Fuels, 2017, 31, 14007–14017 CrossRef CAS.
- C. Wu, S.-J. Khang, T. C. Keener and S.-K. Lee, Adv. Environ. Res., 2004, 8, 655–666 CrossRef CAS.
- S. Wang, S. Xu, S. Gao, P. Xiao, M. Jiang, H. Zhao, B. Huang, L. Liu, H. Niu, J. Wang and D. Guo, Sci. Rep., 2021, 11, 11003 CrossRef CAS PubMed.
- L. Xu, J. Guo, F. Jin and H. Zeng, Chemosphere, 2006, 62, 823–826 CrossRef CAS PubMed.
- R. Sundararaman and C. Song, Energy Fuels, 2013, 27, 6372–6376 CrossRef CAS.
- A. Dal Pozzo, D. Guglielmi, G. Antonioni and A. Tugnoli, J. Cleaner Prod., 2017, 162, 1061–1074 CrossRef CAS.
- J. Vehlow, Waste Manage., 2015, 37, 58–74 CrossRef CAS PubMed.
- M. A. Paisley and M. Millspaugh, in 19th Annual North American Waste-to-Energy Conference, ASMEDC, Lancaster, Pennsylvania, USA, 2011, pp. 1–8 Search PubMed.
- S. Kalisz, R. Wejkowski, I. Maj and P. Garbacz, Energy, 2023, 279, 128046 CrossRef CAS.
- National Energy Technology Laboratory, Integrated Dry NOx/SO2 Emissions Control System, A DOE Assessment, 2001 Search PubMed.
- B. Walawska, A. Szymanek and A. Pajdak, Chemik, 2013, 67, 903–912 CAS.
- G. Kresse and J. Furthmüller, Phys. Rev. B: Condens. Matter Mater. Phys., 1996, 54, 11169–11186 CrossRef CAS PubMed.
- G. Kresse and J. Furthmüller, Comput. Mater. Sci., 1996, 6, 15–50 CrossRef CAS.
- J. P. Perdew, K. Burke and M. Ernzerhof, Phys. Rev. Lett., 1996, 77, 3865–3868 CrossRef CAS PubMed.
- P. E. Blöchl, Phys. Rev. B: Condens. Matter Mater. Phys., 1994, 50, 17953–17979 CrossRef PubMed.
- Y. Liu, W. Cen, Z. Wu, X. Weng and H. Wang, J. Phys. Chem. C, 2012, 116, 22930–22937 CrossRef CAS.
- S. Ma, X. Bie, C. Gong, B. Qu and D. Liu, RSC Adv., 2021, 11, 8846–8856 RSC.
- T. C. Keener and S.-J. Khang, Chem. Eng. Sci., 1993, 48, 2859–2865 CrossRef CAS.
- X. Zhang, S. Wang, J. Li, X. Xiao and S. Shu, Chem. Eng. Sci., 2023, 281, 119157 CrossRef CAS.
- T. Zhou, Y. Zhao, X. Xiao, Y. Liu, H. Bai, X. Chen, J. Dou and J. Yu, ACS Omega, 2022, 7, 29171–29180 CrossRef CAS PubMed.
- T. Ishizuka, H. Kabashima, T. Yamaguchi, K. Tanabe and H. Hattori, Environ. Sci. Technol., 2000, 34, 2799–2803 CrossRef CAS.
- D. Littlejohn and S.-G. Chang, J. Electron Spectrosc. Relat. Phenom., 1995, 71, 47–50 CrossRef CAS.
- K. Stejskalová, I. Spirovová, E. Lippert, K. Mocek and Z. Bastl, Appl. Surf. Sci., 1996, 103, 509–516 CrossRef.
- B. J. Lindberg, K. Hamrin, G. Johansson, U. Gelius, A. Fahlman, C. Nordling and K. Siegbahn, Phys. Scr., 1970, 1, 286–298 CrossRef CAS.
- K. He, S. Su, S. Ding and W. Sun, React. Kinet., Mech. Catal., 2018, 123, 757–770 CrossRef CAS.
- H. Peisert, T. Chassé, P. Streubel, A. Meisel and R. Szargan, J. Electron Spectrosc. Relat. Phenom., 1994, 68, 321–328 CrossRef CAS.
- S. Enami, C. D. Vecitis, J. Cheng, M. R. Hoffmann and A. J. Colussi, J. Phys. Chem. A, 2007, 111, 13032–13037 CrossRef CAS PubMed.
- K. Burger, F. Tschismarov and H. Ebel, J. Electron Spectrosc. Relat. Phenom., 1977, 10, 461–465 CrossRef CAS.
- M. Datta, H. J. Mathieu and D. Landolt, Appl. Surf. Sci., 1984, 18, 299–314 CrossRef CAS.
- Á. Vegas, J. F. Liebman and H. D. B. Jenkins, Acta Crystallogr., Sect. B: Struct. Sci., 2012, 68, 511–527 CrossRef PubMed.
- M. C. Paganini, M. Chiesa, P. Martino, E. Giamello and E. Garrone, J. Phys. Chem. B, 2003, 107, 2575–2580 CrossRef CAS.
| This journal is © The Royal Society of Chemistry 2023 |

