
 Open Access Article
 This Open Access Article is licensed under a Creative Commons Attribution-Non Commercial 3.0 Unported Licence
Fluoride derivatization-enabled sensitive and simultaneous detection of biomarkers for nitrogen mustard in human plasma and urine via gas chromatography tandem mass spectrometry
Fang-chao Yanga,
Yang Yangb,
Long Yanb,
Feng-yun Wanga,
Lei Wu a,
Ming-zhu Xia*a and
Xiao-Sen Li*b
a,
Ming-zhu Xia*a and
Xiao-Sen Li*b
aSchool of Chemistry and Chemical Engineering, Nanjing University of Sciences & Technology, Nanjing, 210094, P. R. China. E-mail: xiamzh196808@njust.edu.cn; Tel: +86 25 84315190
bState Key Laboratory of NBC Protection for Civilian, Beijing, 102205, China. E-mail: momentday@126.com; Tel: +86 10 69760259
First published on 14th September 2023
Abstract
Methyl-diethanolamine (CAS: 105-59-9), ethyl-diethanolamine (CAS: 139-87-7), and triethanolamine (CAS: 102-71-6) were identified as the degradation products and bio-markers of nitrogen mustard exposure. Sensitive and convenient detection methods for amino alcohol are of great importance to identify nitrogen mustard exposure in forensic analysis. Herein, analytical methods including gas chromatography-tandem mass spectrometry combined with heptafluorobutyryl derivatization and solid phase extraction were established for retrospective detection of the biomarkers in human plasma and urine samples. The efficiency of the method was improved by optimizing the conditions for sample preparation and the GC-MS/MS method. The optimization included the derivatization temperature, reaction time, reagent dosage and solid phase extraction cartridges, eluent and pH of the loading sample. The results indicated that the SCX cartridge resulted in better enrichment and purification effects, and the best recovery could be obtained with pH = 3–4 for the loading samples and an eluent of 2 mL 10% NH4OH/MeOH. The GC-MS/MS parameters were also optimized for better specificity and sensitivity. The established method was fully validated for each analyte both in plasma and urine matrixes. The linear range of analytes in plasma was 1.0–1000 ng mL−1 with a correlation parameter (R2) of ≥0.994, intra-day/inter-day accuracy of 93.7–117%, and relative standard deviation (RSD) of ≤6.5%. Meanwhile the results in urine were 1.0–1000 ng mL−1 with R2 of ≥0.996, intra-day/inter-day accuracy of 94.3–122%, and RSD of ≤6.6%. The detection limit of the analytes was 1.0 ng mL−1. The method was applied for the detection and identification of trace amino alcohols present in urine samples dispatched by the Organization for the Prohibition of Chemical Weapons (OPCW) and the results were confirmed to be correct.
1. Introduction
Chemical warfare agents (CWAs), such as nerve agents or blister agents, are classified as highly toxic chemicals. The production and storage of such chemicals are rigorously controlled under international agreements.1 Unfortunately, despite the strict controls, CWAs have still been abused in various conflicts and terrorist activities in recent decades.2–4 Nitrogen mustards (NMs), sharing similarities with sulfur mustards (SMs), have been developed as a type of vesicant chemical warfare agent since World War I,5,6 and include bis(2-chloroethyl)-ethylamine (HN1), bis(2-chloroethyl)-methylamine (HN2) and tris(2-chloroethyl) amine (HN3). As blister agents, these NMs could cause injuries to mucous membranes by alkylating free affinity sites present in biomolecules such as proteins or DNA,7–9 which can even lead to physiological abnormalities or death. The chemical synthesis of these SMs or NMs could be achieved with commercially available reagents and convenient experimental procedures, in contrast to the complex processes involved in synthesizing nerve agents.10 Additionally, NMs have been widely applied in the treatment of cancer, such as chemotherapy and antineoplastics.11 Although numerous analytical methods have been developed for the detection of SMs, research on NMs has received comparatively little attention.12,13 Consequently, the development of sensitive and convenient methods for retrospective detection of NMs in environmental and biological samples is of great importance in chemical weapon verification and public safety.After unintentional exposure to NMs, similar metabolic pathways have been observed in humans to those for SMs. Different biomarkers involving protein or DNA adducts and hydrolysis products could be detected in the blood samples of the survivors.14–16 Notably, hydrolysis products were identified as the primary metabolites (shown in Fig. 1). Alcohol amine compounds methyl-diethanolamine (MDEA), ethyl-diethanolamine (EDEA), and triethanolamine (TEA), which were formed by the replacement of chlorine atoms by hydroxy groups and reactions with nucleophilic groups, were commonly observed as the hydrolysis products from NMs in environmental and biological matrixes.17,18
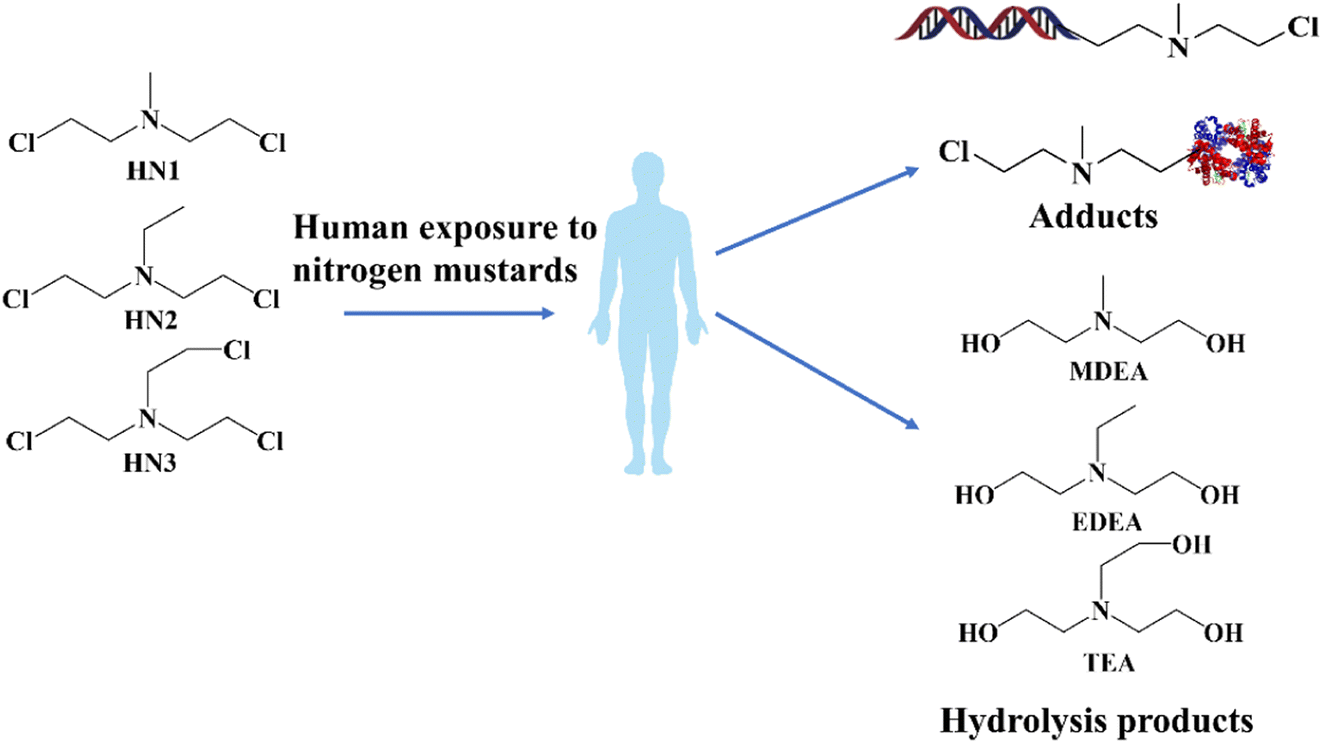 | ||
| Fig. 1 The biomarkers of human exposure to nitrogen mustards. | ||
Several methods have been reported for the detection of NM biomarkers. For the retrospective detection of NM biomarkers in plasma, the sample preparation typically involves protein precipitation and selective enzymolysis.19 However, the whole running process is particular time-consuming and results in a high target loss. In contrast, the monitoring of urinary biomarkers has been demonstrated to be practical and effective,20 and is more convenient. However, due to the complexity of the urine matrix, steps for the elimination of impurities are typically needed. Liquid chromatography-mass spectrometry/mass spectrometry (LC-MS/MS) has been applied to determine the NMs in different matrixes with unsatisfactory separation effects.21–24 In particular, a special column with polar stationary phases for liquid chromatography has been utilized due to the strong polarity of the alcohol amines. Gas chromatography-mass spectrometry/mass spectrometry (GC-MS/MS), which has a better separation ability, was used to investigate the biomarkers of SMs or NMs in plasma and urine samples.25–28 However, due to the polarity and volatility of the alcohol amines, additional derivatization was unavoidable. The purpose of the derivatization was to derive the alcohol amines into nonpolar compounds, such as corresponding trimethylsilyl (TMS) and tert-butyldimethylsilyl (TBDMS) esters.29,30 Common derivatization reagents used include N,O-bis(trimethylsilyl)trifluoroacetamide (BSTFA) and N-methyl-n(tert-butyldimethylsilyl) trifluoroacetamide (MTBSTFA). Unfortunately, urea, as the main component of urine, could also react with such silylating reagents. Besides, due to limited research on NMs, the interpretation of the mass fragmentation behavior of the derivatives was according to the experimental results, lacking sufficient theoretical data.
Herein, we established sample preparation coupled with GC-MS/MS analysis for the simultaneous retrospective detection of NM biomarkers in plasma and urine samples. In contrast to previous studies, the hydrolysis products MDEA, EDEA and TEA were selected as the biomarkers for HN1, HN2 and HN3, respectively. The choice of these hydrolysis products instead of protein or DNA adducts was beneficial to the investigation of NM exposure in both plasma and urine samples. Also, the alternative bio-samples improved the applicability of our method in other laboratories. This approach allowed for the mutual verification of results and eliminated the need for additional protein precipitation, resulting in improved recovery. Fluoride derivatization and GC-negative chemical ionization (NCI) MS/MS were applied for the trace analysis of the targets. The high electronegativity of the derivatives enhanced the sensitivity of detection. Compared to the reported method,18 the limit of detection increased by about 10 times. Importantly, the sample preparation and detection were consistent for both plasma and urine, showing potential in the high throughput analysis in the future. The sample preparation was fully optimized so that the method could easily be reproduced. Furthermore, we applied density functional theory (DFT) calculations to interpret the mass fragmentation behavior of the fluoride derivatization products from the alcohol amines. This provided valuable theoretical insights into the fragmentation patterns observed in the analysis. Our method has been successfully applied for the detection of authentic trace samples dispatched by the Organization for the Prohibition of Chemical Weapons (OPCW).
2. Experimental
2.1 Materials and reagents
MDEA and EDEA (>99% purity) were obtained from Aladdin (Shanghai, CN). TEA and 1,2-bis (2-hydroxyethylthio) ethane (EDD, internal standard, ISTD) were synthesized in-house. 1-(Heptafluorobutyryl) imidazole (HFBI) was purchased from Sigma-Aldrich (Milwaukee, USA). Deionized water was purchased from Watsons Water. High-performance liquid chromatographic (HPLC) grade solvents for acetonitrile, methanol and heptane were from Thermo Fisher Scientific (Waltham, USA). Ammonium hydroxide (25%) and hydrochloric acid were obtained from Xi Long Scientific (Guangdong, CN). Helium and nitrogen (99.9999% purity) used for GC or sample preparation were purchased from Beijing Beifen Analytical Instrument Company Limited. Bond Elut SCX cartridges, Plexa PCX cartridges and C8 cartridges (500 mg/3 mL for each) and glass auto-sampler vials (1.5 mL) were purchased from Agilent (USA). Urine samples were collected from ten healthy human subjects and then homogeneously mixed together in our lab. Plasma samples (with EDTA supplied as an anticoagulant) were purchased from Shanghai Titan Co. Ltd (SenBeiJia Biological Technology Co., Ltd, Nanjing, China). All the biological samples were collected with the approval of the Ethics Committee. The authentic bio-samples were part of the 6th biomedical proficiency test scheduled by the OPCW.2.2 Safety considerations
The preparation of standard solutions, generation of spiked plasma or urine samples, and derivatization process were conducted in a fume hood by trained professionals who wore suitable protective clothing. Universal safety precautions for handling clinical samples were strictly adhered to during the treatment of the plasma or urine samples. The plasma and urine should be treated following universal safety precautions for handling clinical samples.2.3 Internal standard (ISTD) for quantification
The working ISTD solution was prepared at a concentration of 1.0 μg mL−1 by diluting 1,2-bis (2-hydroxyethylthio) ethane with acetonitrile (kept at 4 °C until use). ISTD was added to the plasma or urine samples after treatment by solid phase extraction (SPE) to compensate for any loss of analyte during the derivatization.2.4 Preparation of spiked samples for calibration standard curve
All the bio-samples underwent the pretreatment process to ensure the suitability and homogeneity for analysis. Initially, the urine samples were subjected to centrifugation at a speed of 14![[thin space (1/6-em)]](https://www.rsc.org/images/entities/char_2009.gif) 000 rpm for a duration of 30 minutes. Then both the commercial plasma and the urines samples were filtered via 0.45 μm microporous membranes. This centrifugation step effectively separated any solid particles or debris present in the samples, thereby minimizing potential interference during subsequent analysis. There was no pretreatment required for the actual samples from OPCW as they were already provided in a suitable and homogeneous state.
000 rpm for a duration of 30 minutes. Then both the commercial plasma and the urines samples were filtered via 0.45 μm microporous membranes. This centrifugation step effectively separated any solid particles or debris present in the samples, thereby minimizing potential interference during subsequent analysis. There was no pretreatment required for the actual samples from OPCW as they were already provided in a suitable and homogeneous state.
Stock mixture solutions containing all three analytes (MDEA, EDEA and TEA) were prepared in acetonitrile (ACN) at a concentration of 10 μg mL−1 for each analyte. Two sets of standard solutions were prepared for the urine and plasma samples, with eight points ranging from 0 to 1000 ng mL−1. The working standard mixture solutions were obtained by stepwise dilution of the stock solution with urine or plasma to the final concentrations of 0.0 (blank sample), 1.0, 5.0, 10, 100, 200, 500 and 1000 ng mL−1, to ensure miscibility and homogeneity. Both the spiked urine and plasma samples were incubated for 12 h at room temperature with gentle shaking. The blank bio-samples for the calibration standards were produced using the corresponding urine or plasma sample spiked with the same volume of acetonitrile.
2.5 Preparation of quality control (QC) samples
According to FDA rules,31 the established method was fully validated with the QC samples. A quality control low solution of 3.0 ng mL−1 (QCL), quality control medium solution of 400 ng mL−1 (QCM), and quality control high solution of 800 ng mL−1 (QCH) were utilized. To prepare these solutions, high concentration spiked urine and plasma samples (1000 ng mL−1) were serially diluted with non-spiked matrix.All the spiked samples, including the calibrator and quality control samples, were stored at 4 °C until they were used for analysis.
2.6 Sample preparation
Even though the process of fluoride derivatization had been widely used for the detection of hydrolysis products of CWAs, the conditions were still optimized in our research due to the fewer applications of HFBI derivatization to NM detection. The spiked samples described above underwent SPE and derivatization prior to the instrumental analysis.The strong cationic SPE cartridge (Agilent Bond Elut SCX, 500 mg/3 mL) coupled with disposable syringes and tubes were applied to achieve the enrichment and purification of the NM biomarkers in plasma and urine samples. Then, 0.5 mL of spiked bio-samples were adjusted to pH < 7 (according to the matrix) and separately loaded onto the SCX cartridge pre-conditioned via 2.0 mL of methanol and 2.0 mL of water in sequence. The loading flow rate was controlled at approximately 1.5–2.0 mL min−1. Then the loaded cartridges were washed sequentially with 2 mL of water and 2 mL of acetonitrile. The SPE cartridges were dried with mild nitrogen gas until no more water droplets escaped from the cartridge, which indicated the impurities were completely removed. Finally, the analytes were eluted with 2 mL of 10% ammonia/methanol.
The eluate was evaporated to dryness using a vacuum centrifugal concentrator (Eppendorf, Concentrator plus, Germany) at 45 °C with 1600 r min−1. The residue was reconstituted in 450 μL of acetonitrile and shaken thoroughly. The resolved samples were transferred into the 2.0 mL glass vial with the addition of 50 μL ISTD (1.0 μg mL−1). The final concentration of ISTD was 100.0 ng mL−1 for each labeled aliquot. 50 μL of HFBI as the derivatization regent was added into each sample by shaking sufficiently. The appropriate conditions for incubation were optimized at 50 °C for 8 min. After cooling to room temperature, the mixture was concentrated to dryness with mild nitrogen. Then, 500 μL of heptane was added for the extraction of the derivatives and 500 μL of water was then added. The supernatant was separated into the 2.0 mL glass vial. Finally, the sample was dried with anhydrous sodium sulphate and concentrated with mild nitrogen to 100 μL for GC-MS/MS analysis.
2.7 GC-MS/MS analysis
The processed samples were analyzed using a Thermo Fisher Scientific Trace GC Ultra connected to a Thermo Fisher Scientific TSQ Quantum XLS triple quadrupole mass spectrometer with an oil pump and autosampler. GC separation was achieved via a DB-17 MS column (Agilent Technologies, 50%-phenyl-50%-methypolysiloxane, 30 m × 0.25 mm × 0.25 μm). The established temperature program of the oven was as follows: 50 °C (2 min hold), 50–190 °C at 10 °C min−1, 190–280 °C at 40 °C min−1, and 280 °C (5 min hold). Splitless injection was applied with the time set at 0.7 min by the splitless glass liner. The carrier gas was high purity helium with a constant flow of 1.0 mL min−1. One pair of precursor and product ions with high abundance was monitored for quantification and the other was applied for confirmation, usually selected as the molecular ion and corresponding product ion. The data of the ion pairs and other details are shown in Table 1. The ionization model was chemical ionization with methane as the reaction gas and argon as the collision gas. The ionization polarity was positive and the electron energy was set to 70 eV. The pressure inside the collision cell was set to about 2 T. The electron multiplier was optimized at 1392 V. The emission current was 100 μA. The temperatures for the ion source and transmission line were maintained at 200 °C and 280 °C, respectively, with a tolerance of ±2 °C. The scan rate was optimized to 0.05 scans per sec and the scan width was set at 0.002 s. Initially, a full-scan procedure was performed to determine the retention times for the derivatives of EDD, EDEA, MDEA, and TEA. The scan time for selected reaction monitoring (SRM) was divided into four segments to provide high scan sensitivity: MDEA (0–8.1 min), EDEA (8.1–10.1 min), TEA (10.1–12.5 min), and EDD (12.5–19.25 min). The total analysis time was optimized to be approximately 19.25 minutes.| Analyte | SRM transition | Collision energy (V) | Retention time |
|---|---|---|---|
| MDEA | 512.0 → 169.0 | 33 | 7.80 min |
| 512.0 → 241.0 | 20 | ||
| EDEA | 526.0 → 169.0 | 35 | 8.33 min |
| 526.0 → 241.0 | 23 | ||
| TEA | 524.0 → 169.0 | 33 | 11.35 min |
| 524.0 → 241.0 | 20 |
2.8 Data processing
The retention times, and integration and selection of peak areas for the analytes were calculated automatically using the Thermo Xcalibur Qual Browser (TXQB) software to guarantee the homogeneity. The automated data functions determined by the TXQB software were checked to determine the appropriate smoothed peak assignment points. Peak quantification and signal-to-noise ratio (SNR) calculations were performed using the TXQB software, and all samples were processed in the same way. Individual curves were analyzed by linear regression and weighted by the inverse. The calibration curves for the three targets in the plasma and urine matrixes were established using plots of the standard concentrations versus the ratio of the areas of ISTD. Quantification of all spiked and authentic samples was carried out using the calibration curves.2.9 Method verification and calibration curve
Each calibration curve consisted of a blank sample and a seven-point calibration standard was fully validated. The limit of detection (LOD) was obtained according to the measurement of the SNR (≥3 for the LOQ, limit of quantification). The lowest calibrator was utilized as the LOQ32 if the precision was lower than 20% and accuracy ranged from 80 to 120%. The intra-day precision and accuracy were measured with three QC samples for urine and plasma, which were freshly prepared and analyzed independently (n = 6) the same day of use. No less than 6 measurements were completed within one week for the evaluation of precision and inter-day accuracy.2.10 DFT based prediction model
All the DFT calculations were accomplished based on the Gaussian 09 program package. The chemical structures and energy diagrams were obtained via Becke's three-parameter exchange function and the Lee–Yang–Parr nonlocal correlation functional (B3LYP/6-31+G**). According to the common criterion, the imaginary frequencies were set at 0 for minima. Additionally, the vibrational analysis with geometry optimization was carried out with the same degree.2.11 Actual sample analysis
Authentic urine samples containing biomarkers from NM exposure were from OPCW. The participants were requested to confirm the presence/absence of biomarkers in the different urine samples. The acquisition of qualitative data was mandatory according to the “Quality Management System Document” written by the head of the OPCW Laboratory, nevertheless it was also encouraged to provide quantitative data.3. Results and discussion
3.1 The application of 1,2-bis (2-hydroxyethylthio) ethane (EDD) as the ISTD
Deuterated compounds have been widely supplied as the ISTD in quantitative determination due to the benefit of similarity of chemical structure and analytical characteristics compared to the targets.33 During the retrospective detection of chemical agents, d8-thiodiglycol or d8-sulfur mustard has normally been employed for the quantification of blister agents in environmental and biological samples. However, the widespread application of deuterated compounds is limited by their high cost and the challenges associated with synthesis. In particular, in our research, three different analytes in two biomatrixes were simultaneously investigated, which meant inadaptable deuterated compounds could be utilized.EDD was applied in our research as a substitute for deuterated compounds. EDD shares a similar structure to the alcohol amine compounds. Moreover, EDD could also be derived from HFBI reagents. The conditions of derivatization for EDD were consistent with the targets and the derivative could be detected simultaneously by GC-MS/MS. The retention times for all four targets (including the ISTD and the three analytes) showed no mutual interference. Considering that no retention for EDD occurred in the SCX cartridge, the ISTD was added into the eluents prior to the derivatization. This approach supplied a reliable and accurate ISTD other than deuterated compounds for the quantification in the analysis of NMs.
3.2 Optimization of derivatization conditions
Fluoride derivatization has been widely applied in the retrospective detection of biomarkers of CWAs, such as alkyl alkylphosphonic acid or TDG.34 However, fluoride derivative techniques have been rarely used in the analysis of NM exposure. Pentafluorobenzoyl chloride was applied as the derivatization regent in previous research with liquid chromatography-tandem mass spectrometry. However, the derivatives were susceptible to hydrolysis in the mobile phase of the liquid chromatogram.In our established method, heptafluorobutyryl imidazole was utilized in the derivatization for the NM biomarkers in the plasma and urine. The increased fluorine content in the derivatives enhanced the sensitivity, especially in the chemical ionization model. Additionally, larger derived groups supplied better thermal stability for the products during the gas chromatography (GC) analysis. To enhance the derivatization efficiency, the conditions including the derivatization time, temperature, and amount of reagent were optimized. Different incubation times (2 min, 4 min, 6 min, 8 min, 10 min, 20 min, 30 min, 40 min, 50 min, and 60 min) and temperatures (25 °C, 30 °C, 40 °C, 50 °C, and 60 °C) were evaluated. In consideration of better derivative effect and economic cost, dosages of the derivatization regent of 5 μL, 10 μL, 20 μL, 30 μL, 40 μL, 50 μL, and 60 μL were added to investigate the response.
The results are shown in Fig. 2a–c, revealing that the derivatization was completed within a few minutes, with the optimal reaction time determined to be 8 min, as the efficiency reached its maximum. Meanwhile, a longer time likely results in poor stability of the product and causes a remarkable reduction in the derivatization efficiency. This phenomenon might occur because the reaction proceeded in the reverse direction with the increase of derivatization time. Temperature optimization indicated that higher temperatures were beneficial for the derivatization of amino alcohols, and an increase in the reagent dosage further improved the efficiency. However, no significant increase in product formation was observed at temperatures above 50 °C. A similar result was noticed when the amount of the HFBI regent was above 50 μL. The efficiency gradually increased with an increase in the amount of reagent added. The efficiency of the reaction increases from 20% to 100% with the reagent dosage increasing from 5 μL to 50 μL. This indicated that more alcohol amines were derived with the increase of the amount of the reagent. Similar results could be observed in other reactions.35 However, higher volumes interfered with the formation of target compounds. Above all, the derivatization time, temperature, and amount of reagent were optimized to improve the reaction efficiency. The optimal conditions for derivatization were determined as an 8 min reaction time at 50 °C with the addition of 50 μL of the HFBI reagent.
 | ||
| Fig. 2 The optimization of the derivatization conditions is illustrated by (a) optimization of derivatization time, (b) optimization of derivatization temperature and (c) optimization of derivatization reagent dosage. | ||
3.3 Optimization of SPE conditions
Even though the conditions for the SPE operation during the fluoride reactivation have been extensively investigated in recent decades,26 the conditions for the SPE in our study were further optimized due to the limited application in the retrospective detection of NM biomarkers. The optimum conditions were established considering three factors: cartridges, loading solutions and eluting solvents. Considering the distinct components for plasma and urine, the SPE conditions were separately optimized for the two bio-matrixes.The results for the selection of SPE cartridges are presented in Fig. 3a–b (the sample solution was adjusted to acidic and the pH was about 4 to 5). Due to cationic transformation in the process of acidification (N → N+), four different cation exchanges, including SCX, PCX, Si-SCX and C8 cartridges, the capacities for all of which were 500 mg/3 mL, were evaluated for the recovery of targets in plasma and urine. The SCX cartridge provided significantly higher recovery for three amino alcohols in both plasma and urine samples, which might reflect that the abundance of anion adsorption groups (sulfonic acid group for SCX) was the decisive factor for the enrichment of targets. The optimized results indicated that the PCX cartridge failed to retrieve the targets in the urine while the results for Si-SCX and C8 were notably lower than those for SCX, possibly due to their high adsorption of impurities leading to the lower enrichment of targets. When evaluating applicability in the plasma matrix, the Si-SCX and C8 columns demonstrated low efficiency for the recovery of targets, potentially due to their absorption of protein impurities.
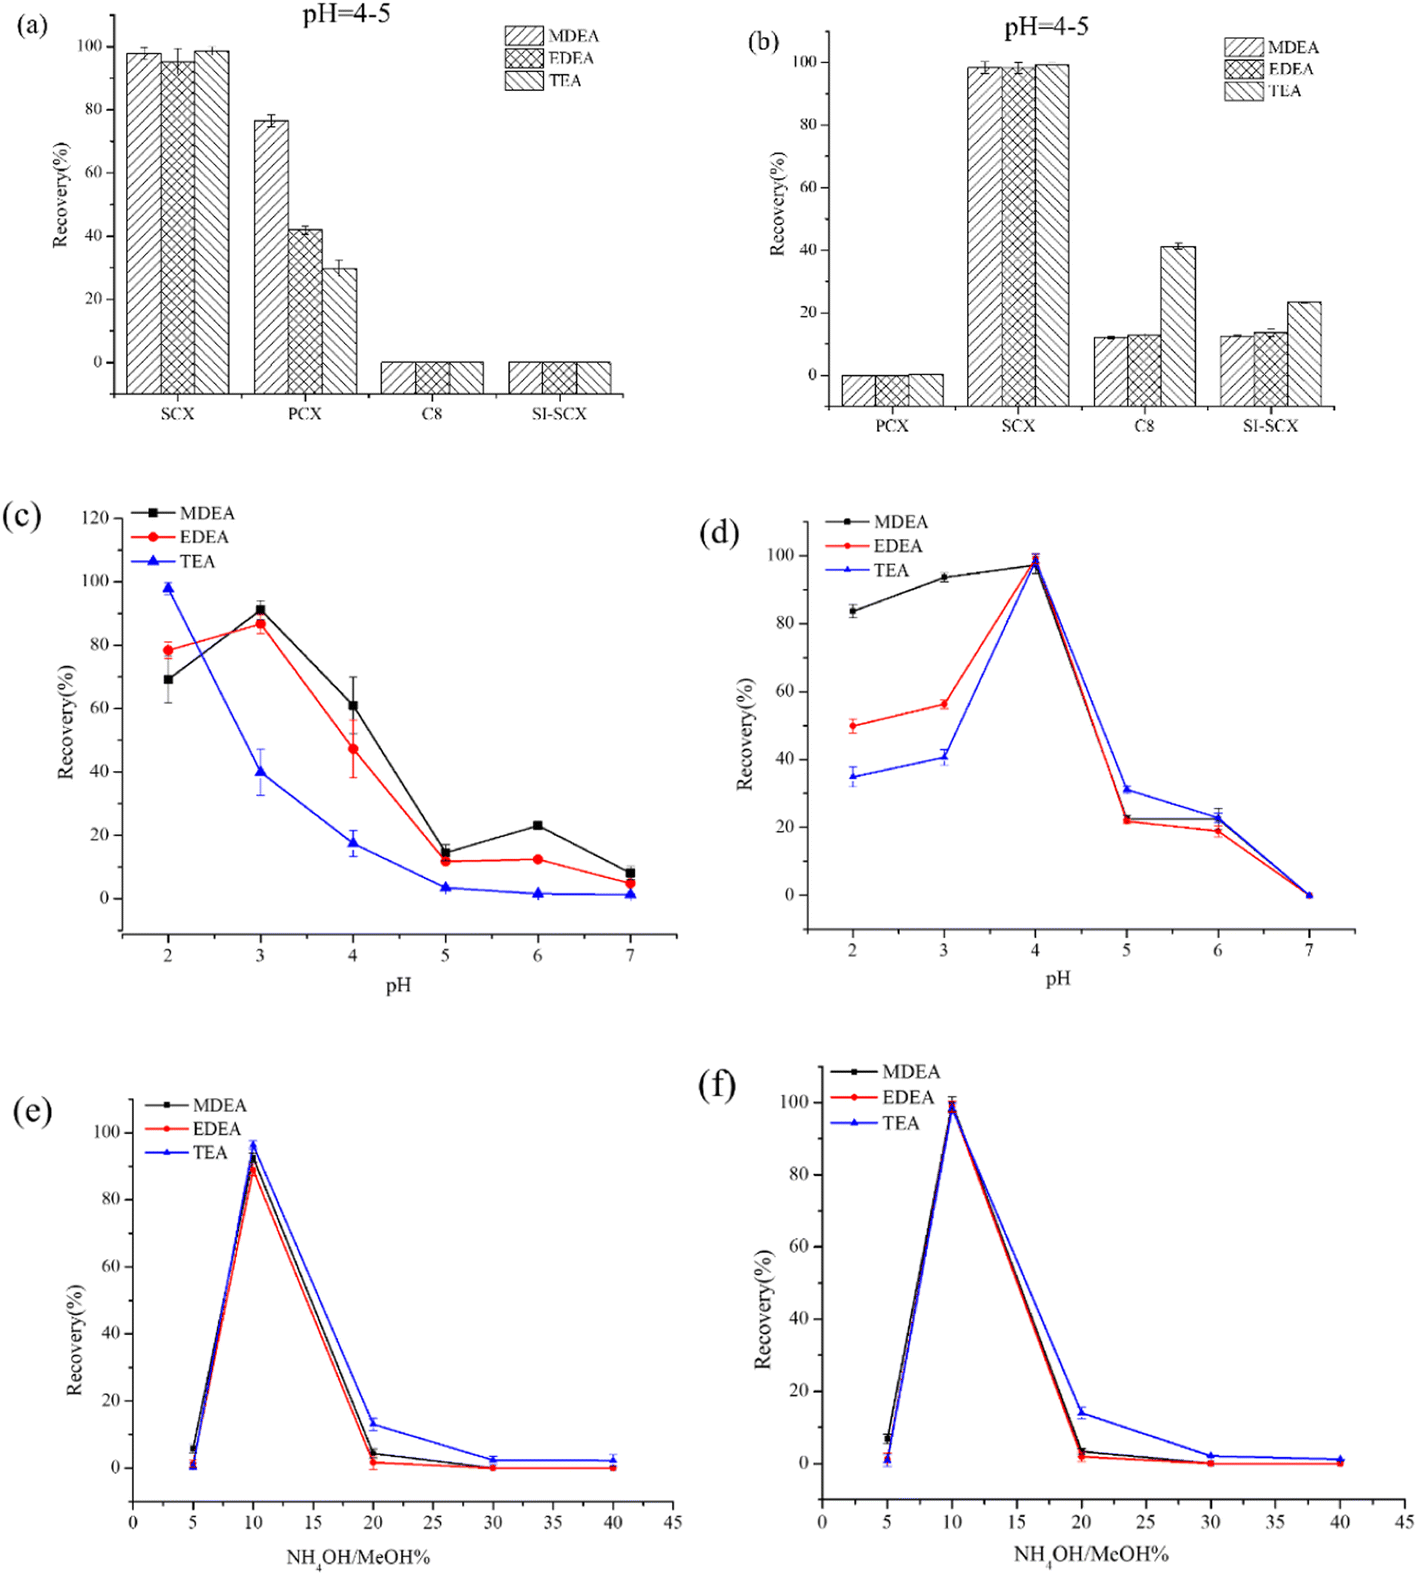 | ||
| Fig. 3 Optimization of solid phase extraction conditions in plasma and urine samples. (a) Optimization of solid phase extraction column selection in plasma, (b) optimization of solid phase extraction column selection in urine, (c) optimization of pH of plasma sample solutions, (d) optimization of pH of urine sample solutions, (e) optimization of eluent concentration gradient in plasma and (f) optimization of eluent concentration gradient in urine. | ||
To obtain better recovery and purification effects, the target substance needed to carry the positive charge. Different pH values for the sample were investigated based on the SCX cation exchange cartridge according to previous studies. The pH range was optimized from 2.0 to 7.0, and the results are presented in Fig. 3c and d. The recovery rate for MDEA and EDEA increased from pH 2 to pH 3, followed by a gradual decrease up to pH = 7, while any decrease in pH in the range was unfavorable for TEA. The optimized pH was set to pH = 3 in view of the overall recovery. In contrast, the best effect was achieved at pH 4 for three targets in the urine sample, perhaps due to the presence of cationic impurities such as urea.
The eluting solvent should extract as much as possible for the analytes in the cartridge while using the minimum volume. Since the analytes were cationic and organic, a polar organic solvent was required. The presence of ammonia in the elution solvent helped displace the analytes adsorbed on the cartridge. Consequently, the content of the ammonium hydroxide was optimized from 5% to 40% for the two matrixes. The results shown in Fig. 3e and f indicate that 10% ammonium hydroxide/methanol was advantageous for elution. Excessive concentration of the ammonium hydroxide might affect the following derivatization. In summary, the samples to be determined were adjusted to pH 3 or 4 and loaded onto the SCX cartridge. After enrichment for the targets, 10% ammonium hydroxide/methanol was applied to elute the analytes.
3.4 Mass spectrometric fragmentation patterns and GC-MS/MS method optimization
The interpretation of the mass spectrometric fragmentation patterns according to the mass spectrum could show the chemical properties of the targets and the ISTD. The results for the mass-to-charge ratio shown in Fig. 4a–d demonstrate the similar cleavage pathway for the derivatives of the analytes. –C4F7O2 and –CH2 (m/z 213 and m/z 14) corresponded to the main loss of fluorinated derivatives for both amino alcohols and EDD during the chemical ionization, for example the quasi-molecular ion [M + H]+ (m/z 512) to m/z 298 for the MDEA derivative, [M + H]+ (m/z 526) to m/z 312 for the EDEA derivative, and [M + H]+ (m/z 738) to m/z 524 for the TEA derivative. Also, a similar loss of –C6F7O2H4 was demonstrated for the ISTD.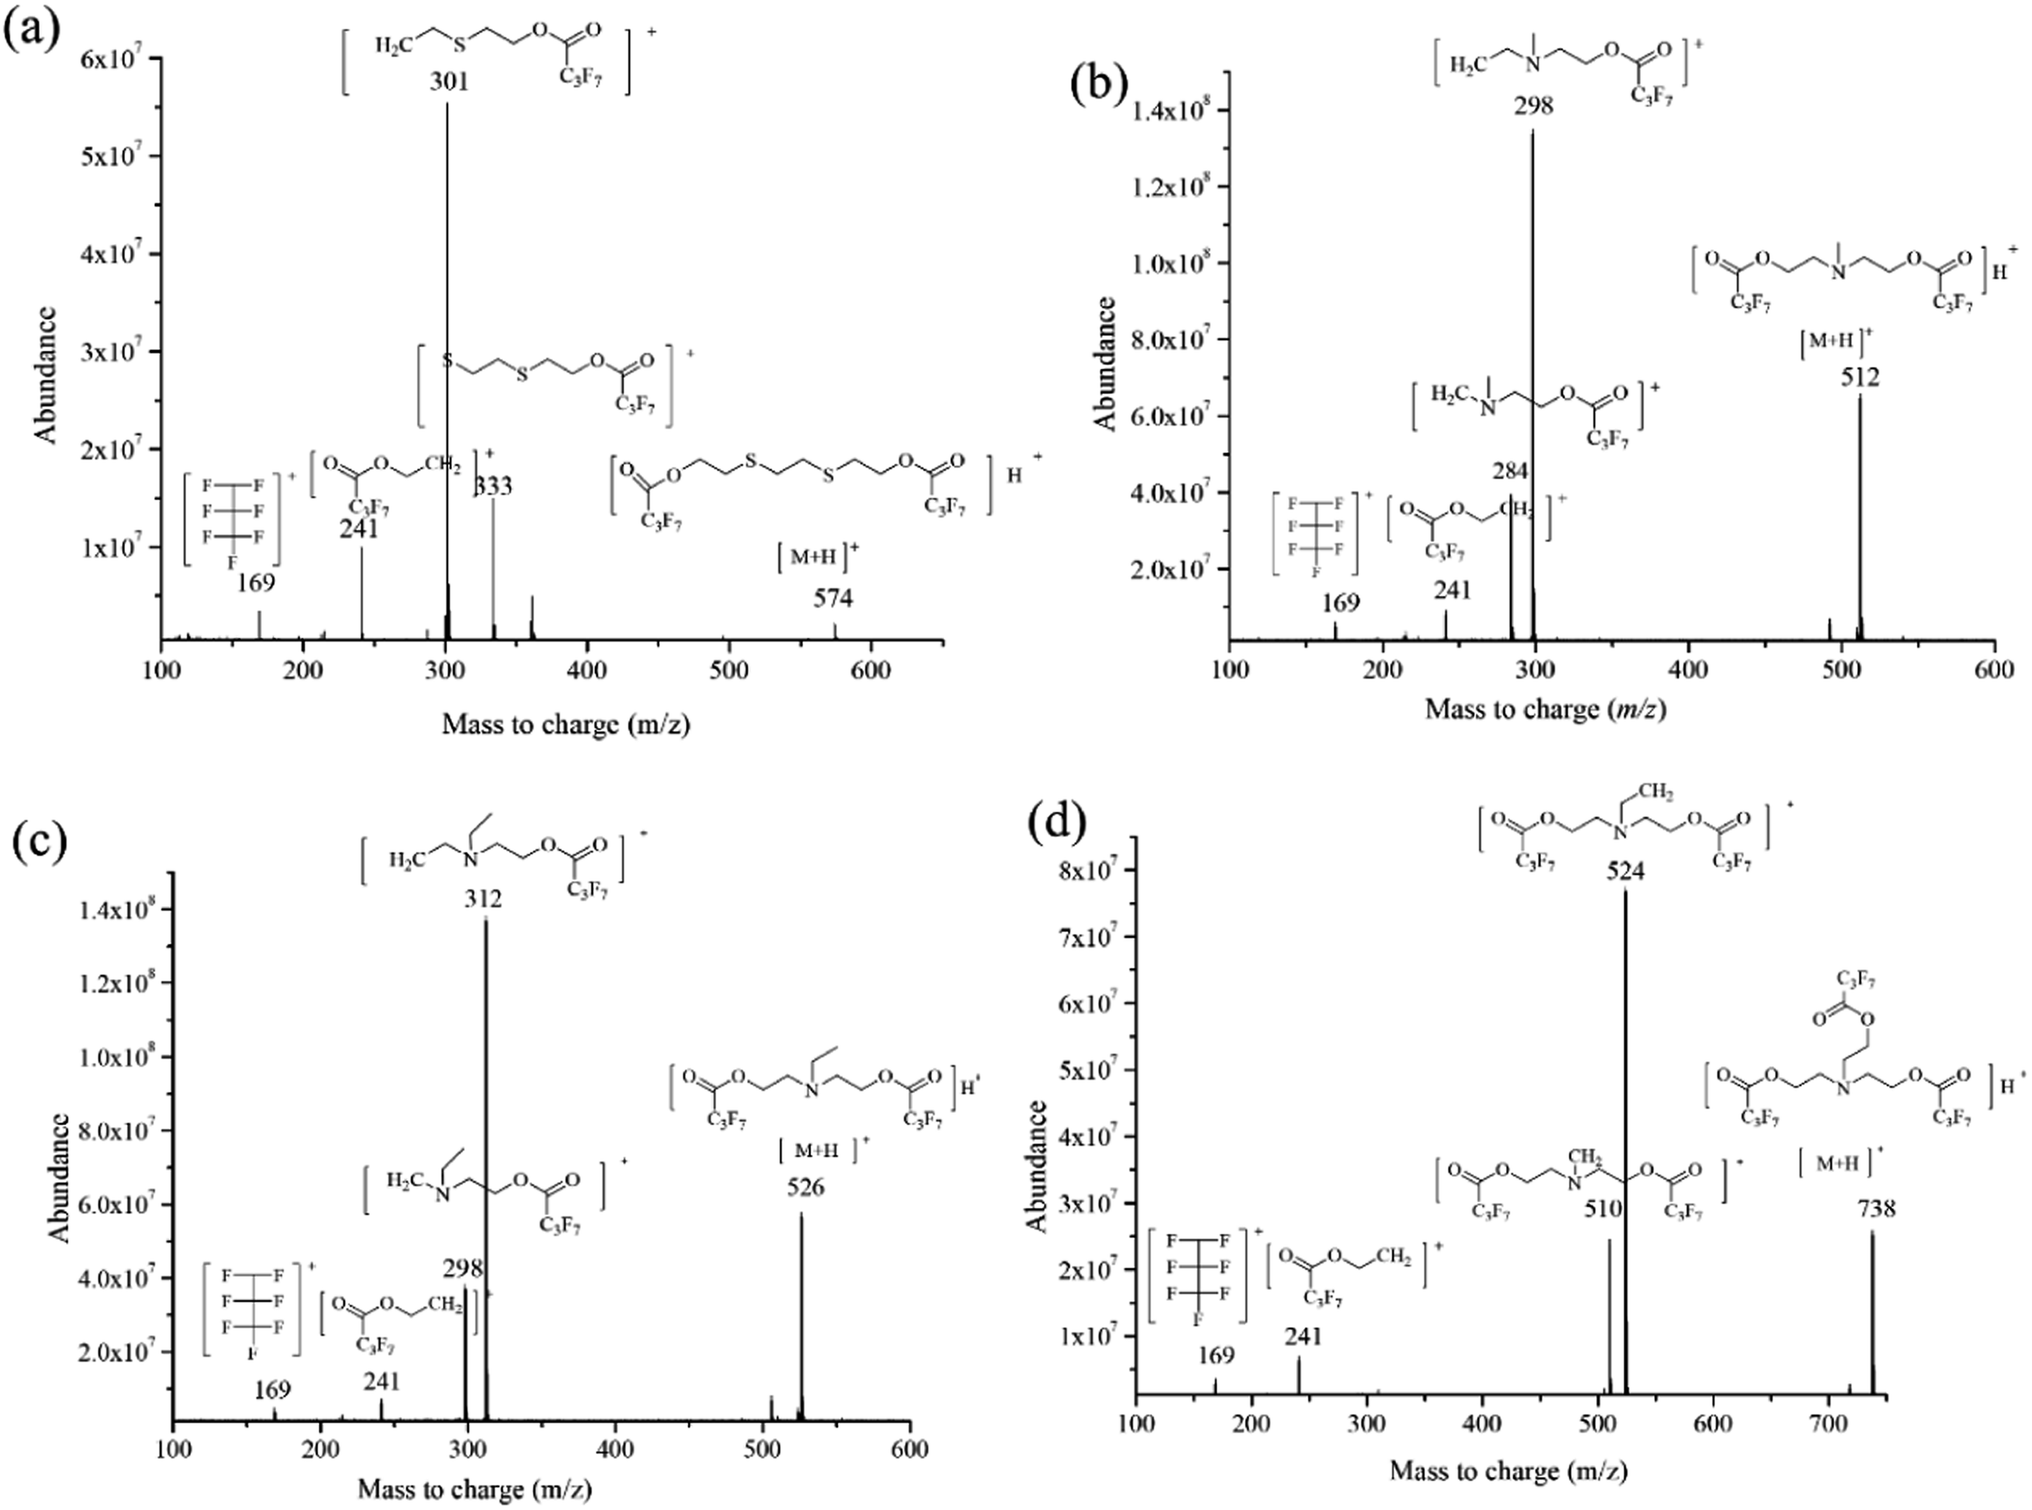 | ||
| Fig. 4 Chemical structures and product ion mass spectra of the precursor ions of (a) EDD (m/z = 574), (b) MDEA (m/z = 512), (c) EDEA (m/z = 526) and (d) TEA (m/z = 738). Spectra were collected at an electron energy of 70 eV over the mass range m/z 33–550. Those fragment ions monitored by SRM are labelled with m/z values and structures. | ||
Reasonable explanations for the fragmentation patterns for the SRM method were also obtained. Both the confirmation and the quantification transition for all analytes contained fragments at m/z 241 and m/z 169, which were identified as [C6H4O2F7]˙+ and [C3F7]˙+, respectively. In summary, the similar mass spectrometric fragmentation patterns proved that the EDD was available as the ISTD for the detection of NM biomarkers. Additionally, the results of the DFT calculation were consistent with mass spectrometric fragmentation for the three analytes and ISTD, which proved the application of DFT calculation in predicting the mass spectra in the future.
The SRM mode could offer better sensitivity for retrospective detection compared to full scan or selective ion monitoring (SIM). Appropriate precursor ions and corresponding product ions were evaluated for the SRM detection in product ion scan mode. The parameters of GC-NCI-MS/MS were optimized for the four analytes. Spectra were collected at an electron energy of 70 eV at positive ionization polarity, with a mass range of m/z 50–800. The chemical structures and ion mass spectra of the four derivative products are presented in Fig. 4a–d, illustrating their mass fragmentation behaviors. The precursor ion selected from the product ion scan mode was used as the previous ion in the SRM method, and ions with high abundance were identified as potential product ions. Alternative collision energies (10–40 eV) were investigated to obtain the maximum response. Finally, we optimized the GC conditions to improve separation, and significantly reduced the run time required to detect ethanolamine (approximately 19.25 minutes per sample). The parameters for the established GC-NCI-MS/MS methods are shown in Table 1.
3.5 DFT calculation
DFT calculations have been applied to reveal the energy levels of chemicals.36 In particular, DFT calculations are capable of predicting mass spectra by evaluation of the activation energy for mass fragmentation. This approach provided a reasonable and reliable interpretation for the main mass fragmentation. In our study, DFT calculation by the Gaussian 09 package and GRRM11 program was used to determine the bonding energy and reveal the fragmentation in the CI source for the analytes (the derivatives of MDEA, EDEA and TEA). The results are shown in Fig. 5a–c. The energy diagrams for possible patterns for the derivative of MDEA was obtained using DFT calculations (Fig. 5a). The results indicated that the activation energies of the formation of [C8H9F7NO2]+ and [C9H11F7NO2]+ were 93.3 kJ mol−1 and 51.8 kJ mol−1, respectively. The corresponding mass fragmentations for m/z 284 and m/z 298 were also confirmed as the main fragmentation in the CI spectrum. In contrast, the activation energies of the formation for [C4F7O2]+ and [C5H2F7O2]+ were 808.0 kJ mol−1 and 892.7 kJ mol−1, which indicated the low abundance of the mass fragments m/z 213 and m/z 227. The calculated results were consistent with the experimental results for the CI full scan. Similar results could be observed for the derivatives for EDEA and TEA. Lower activation energies for the formation of mass fragments represented high abundance in the spectrum, such as m/z 312 (42.2 kJ mol−1) for EDEA derivatives and m/z 510 (79.5 kJ mol−1) for TEA derivatives. The DFT results demonstrated the consistency of the simulated calculation results and the mass spectrum. However, in contrast to the theoretical calculation models, more complex factors need to be focused on for the mass spectrometry of the targets, including the influence of solvent, different reaction intermediates and collision energies. For example, different collision energies could produce mass fragments with different abundances. So although DFT calculation might be used to predict the mass spectrometry of unknown compounds, the calculated results still need to be verified by experiments.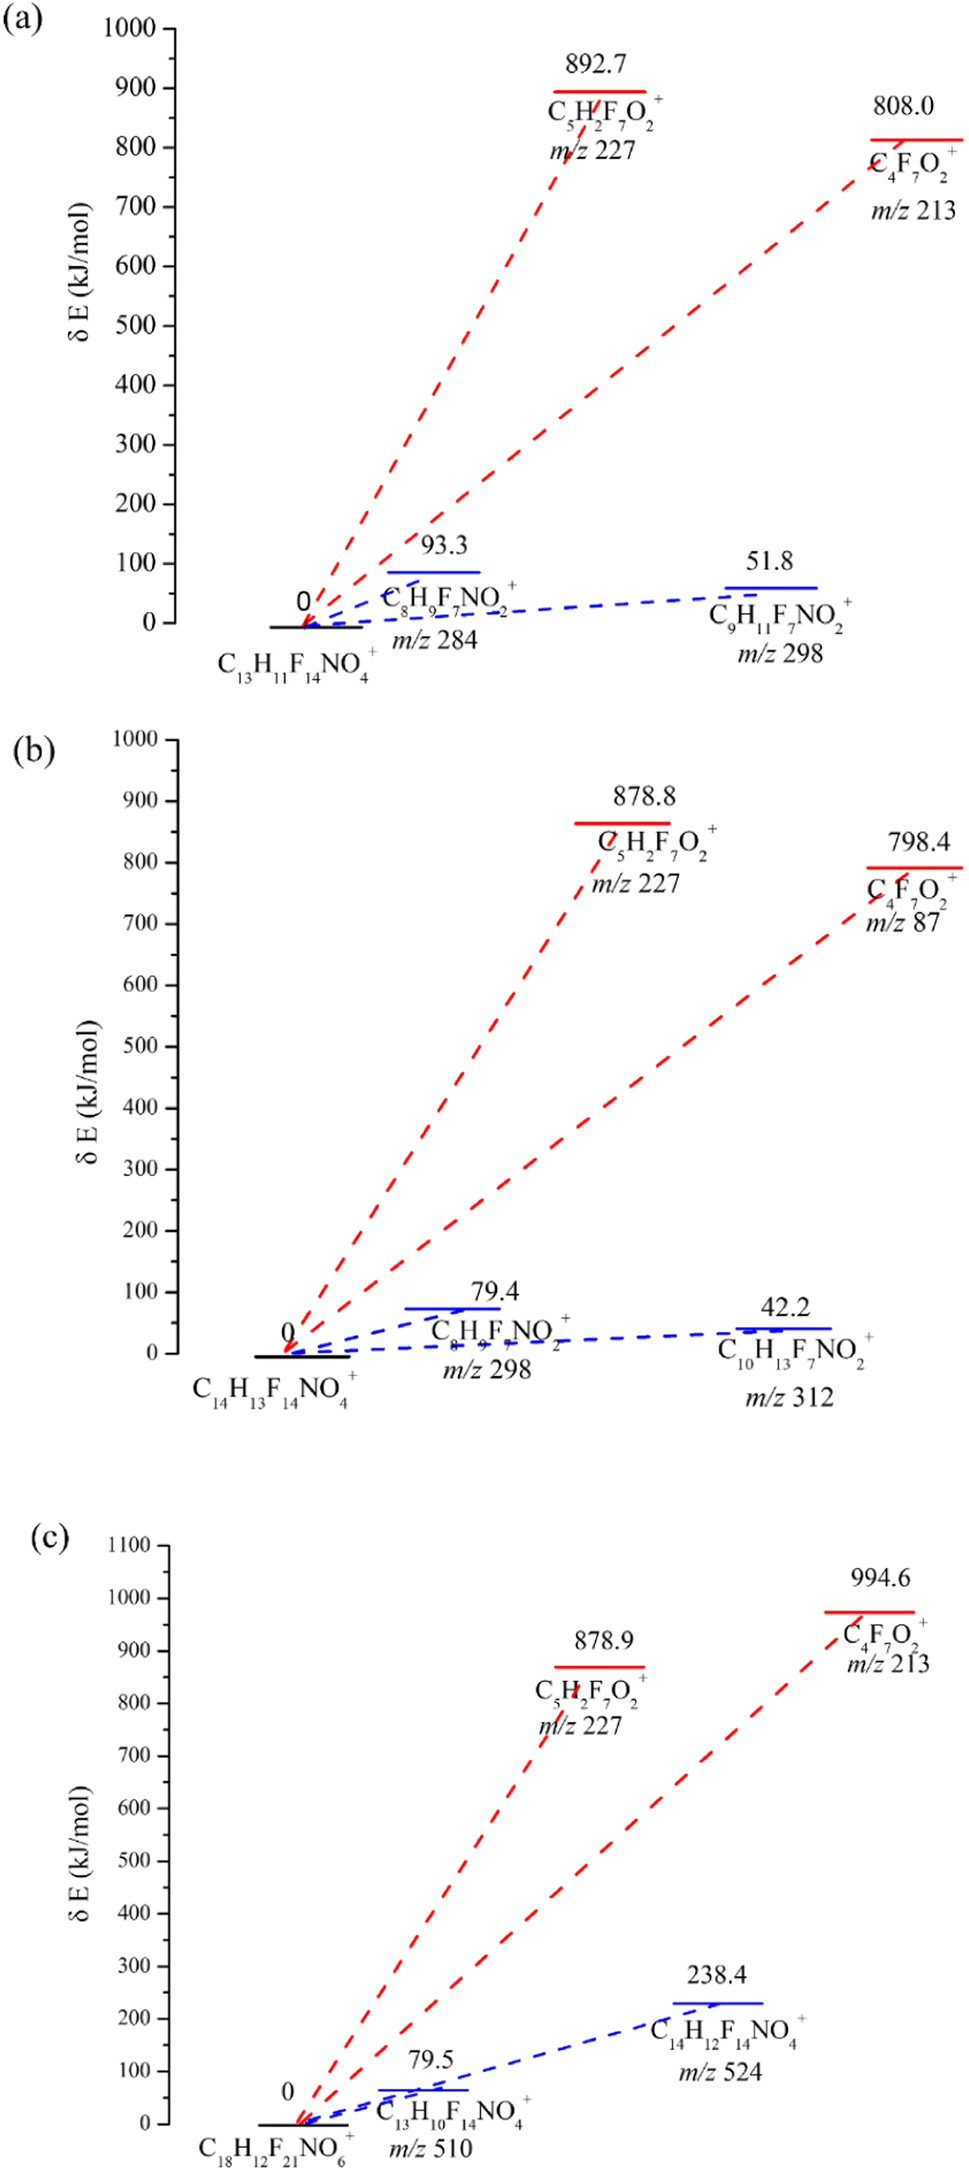 | ||
| Fig. 5 The energy diagrams for possible patterns for the derivatives of MDEA, EDEA and TEA. | ||
| Sample | Compound | Linear range | Equation | R2 |
|---|---|---|---|---|
| Plasma | MDEA | 1.0–1000 ng mL | y = 0.1892x − 3.0031 | 0.994 |
| EDEA | 1.0–1000 ng mL | y = 0.1483x − 0.6669 | 0.998 | |
| TEA | 1.0–1000 ng mL | y = 0.1573x − 3.3421 | 0.994 | |
| Urine | MDEA | 1.0–1000 ng mL | y = 0.0751x + 2.1797 | 0.997 |
| EDEA | 1.0–1000 ng mL | y = 0.0646x − 0.1120 | 0.998 | |
| TEA | 1.0–1000 ng mL | y = 0.0616x + 0.2562 | 0.997 |
3.6 The standard curve with linearity and limits of detection
As a common emulsifier or moisturizer applied in cosmetics, TEA could be detected in plasma or urine from healthy volunteers. However, in similar situations, MDEA and EDEA were undetectable. To evaluate the adaptability of our method, a wide range of calibration curves was established for the three analytes in the two bio-matrixes. Standard solutions with continuous dilution between 1.0 and 1000 ng mL−1 were set up. The peak area ratios of the derivatives from amino alcohols to EDD in both plasma and urine samples present good linear relationships. The calibration curves are shown in Fig. 6a–f. The average calibration equations for MDEA, EDEA and TEA were calculated as y = 0.1892x – 3.0031, y = 0.1483x – 0.6669 and y = 0.1579x – 3.3421, with coefficients of R2 = 0.994, R2 = 0.998 and R2 = 0.994, respectively, for plasma, and y = 0.0751x + 2.1797, y = 0.0646x – 0.1120 and y = 0.0616x + 0.2562, with coefficients of R2 = 0.997, R2 = 0.999 and R2 = 0.997, respectively, for urine (Table 2). The increase of the peak areas showed nonlinearity when the spiked concentration was beyond 1000 ng mL−1. The limit of detection (LOD) was identified by measurement of the SNR (≥3). The lowest calibrator, which was determined as SNR (≥10), was identified as the limit of quantification (LOQ). Additionally, the LOQ peaks illustrated in Fig. 7a–f for the three analytes in the plasma or urine are clearly distinguished as those of the matrix blank sample, which indicates the excellent sensitivity of the established method.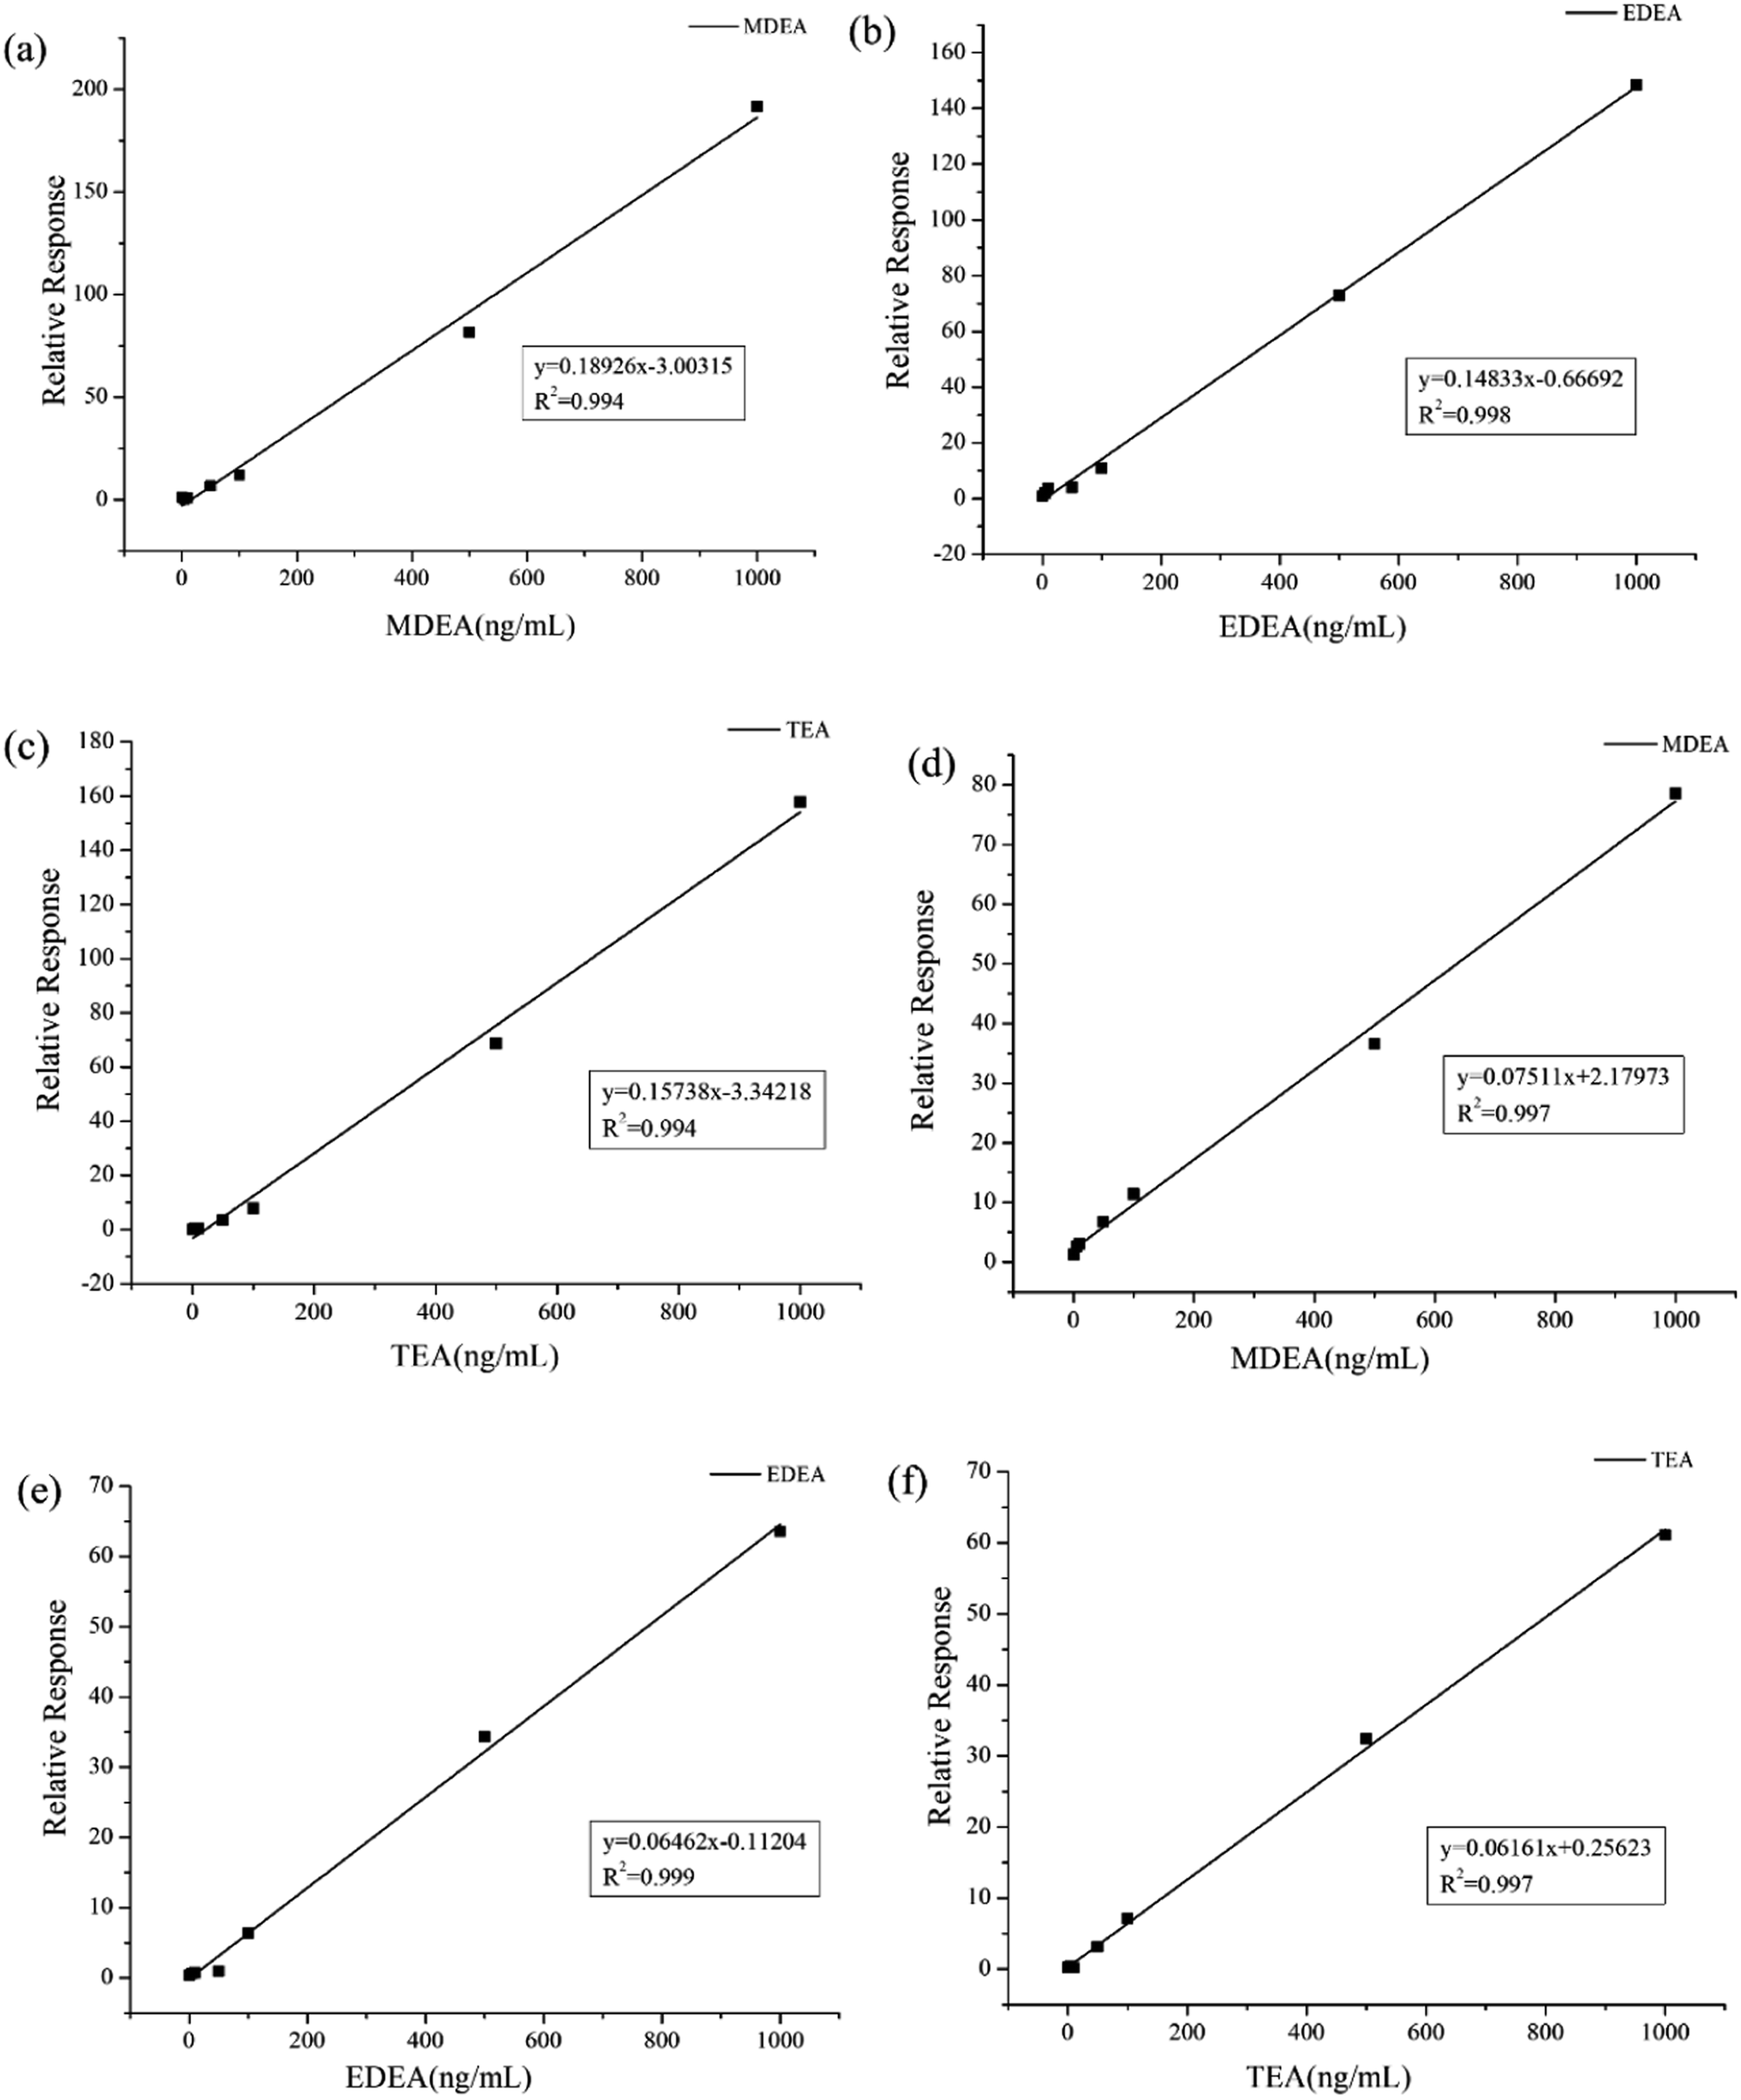 | ||
| Fig. 6 Standard curves of HFBI derivatives of ethanolamine in urine samples and plasma. The standard curves were plotted for (a) plasma MDEA, (b) plasma EDEA, (c) plasma TEA, (d) urine MDEA, (e) urine EDEA, and (f) urine TEA, with the vertical coordinates being the ratio of the ethanolamine peak area to the internal substance peak area and the horizontal coordinates being the ethanolamine concentration. Each point represents the mean of three results. | ||
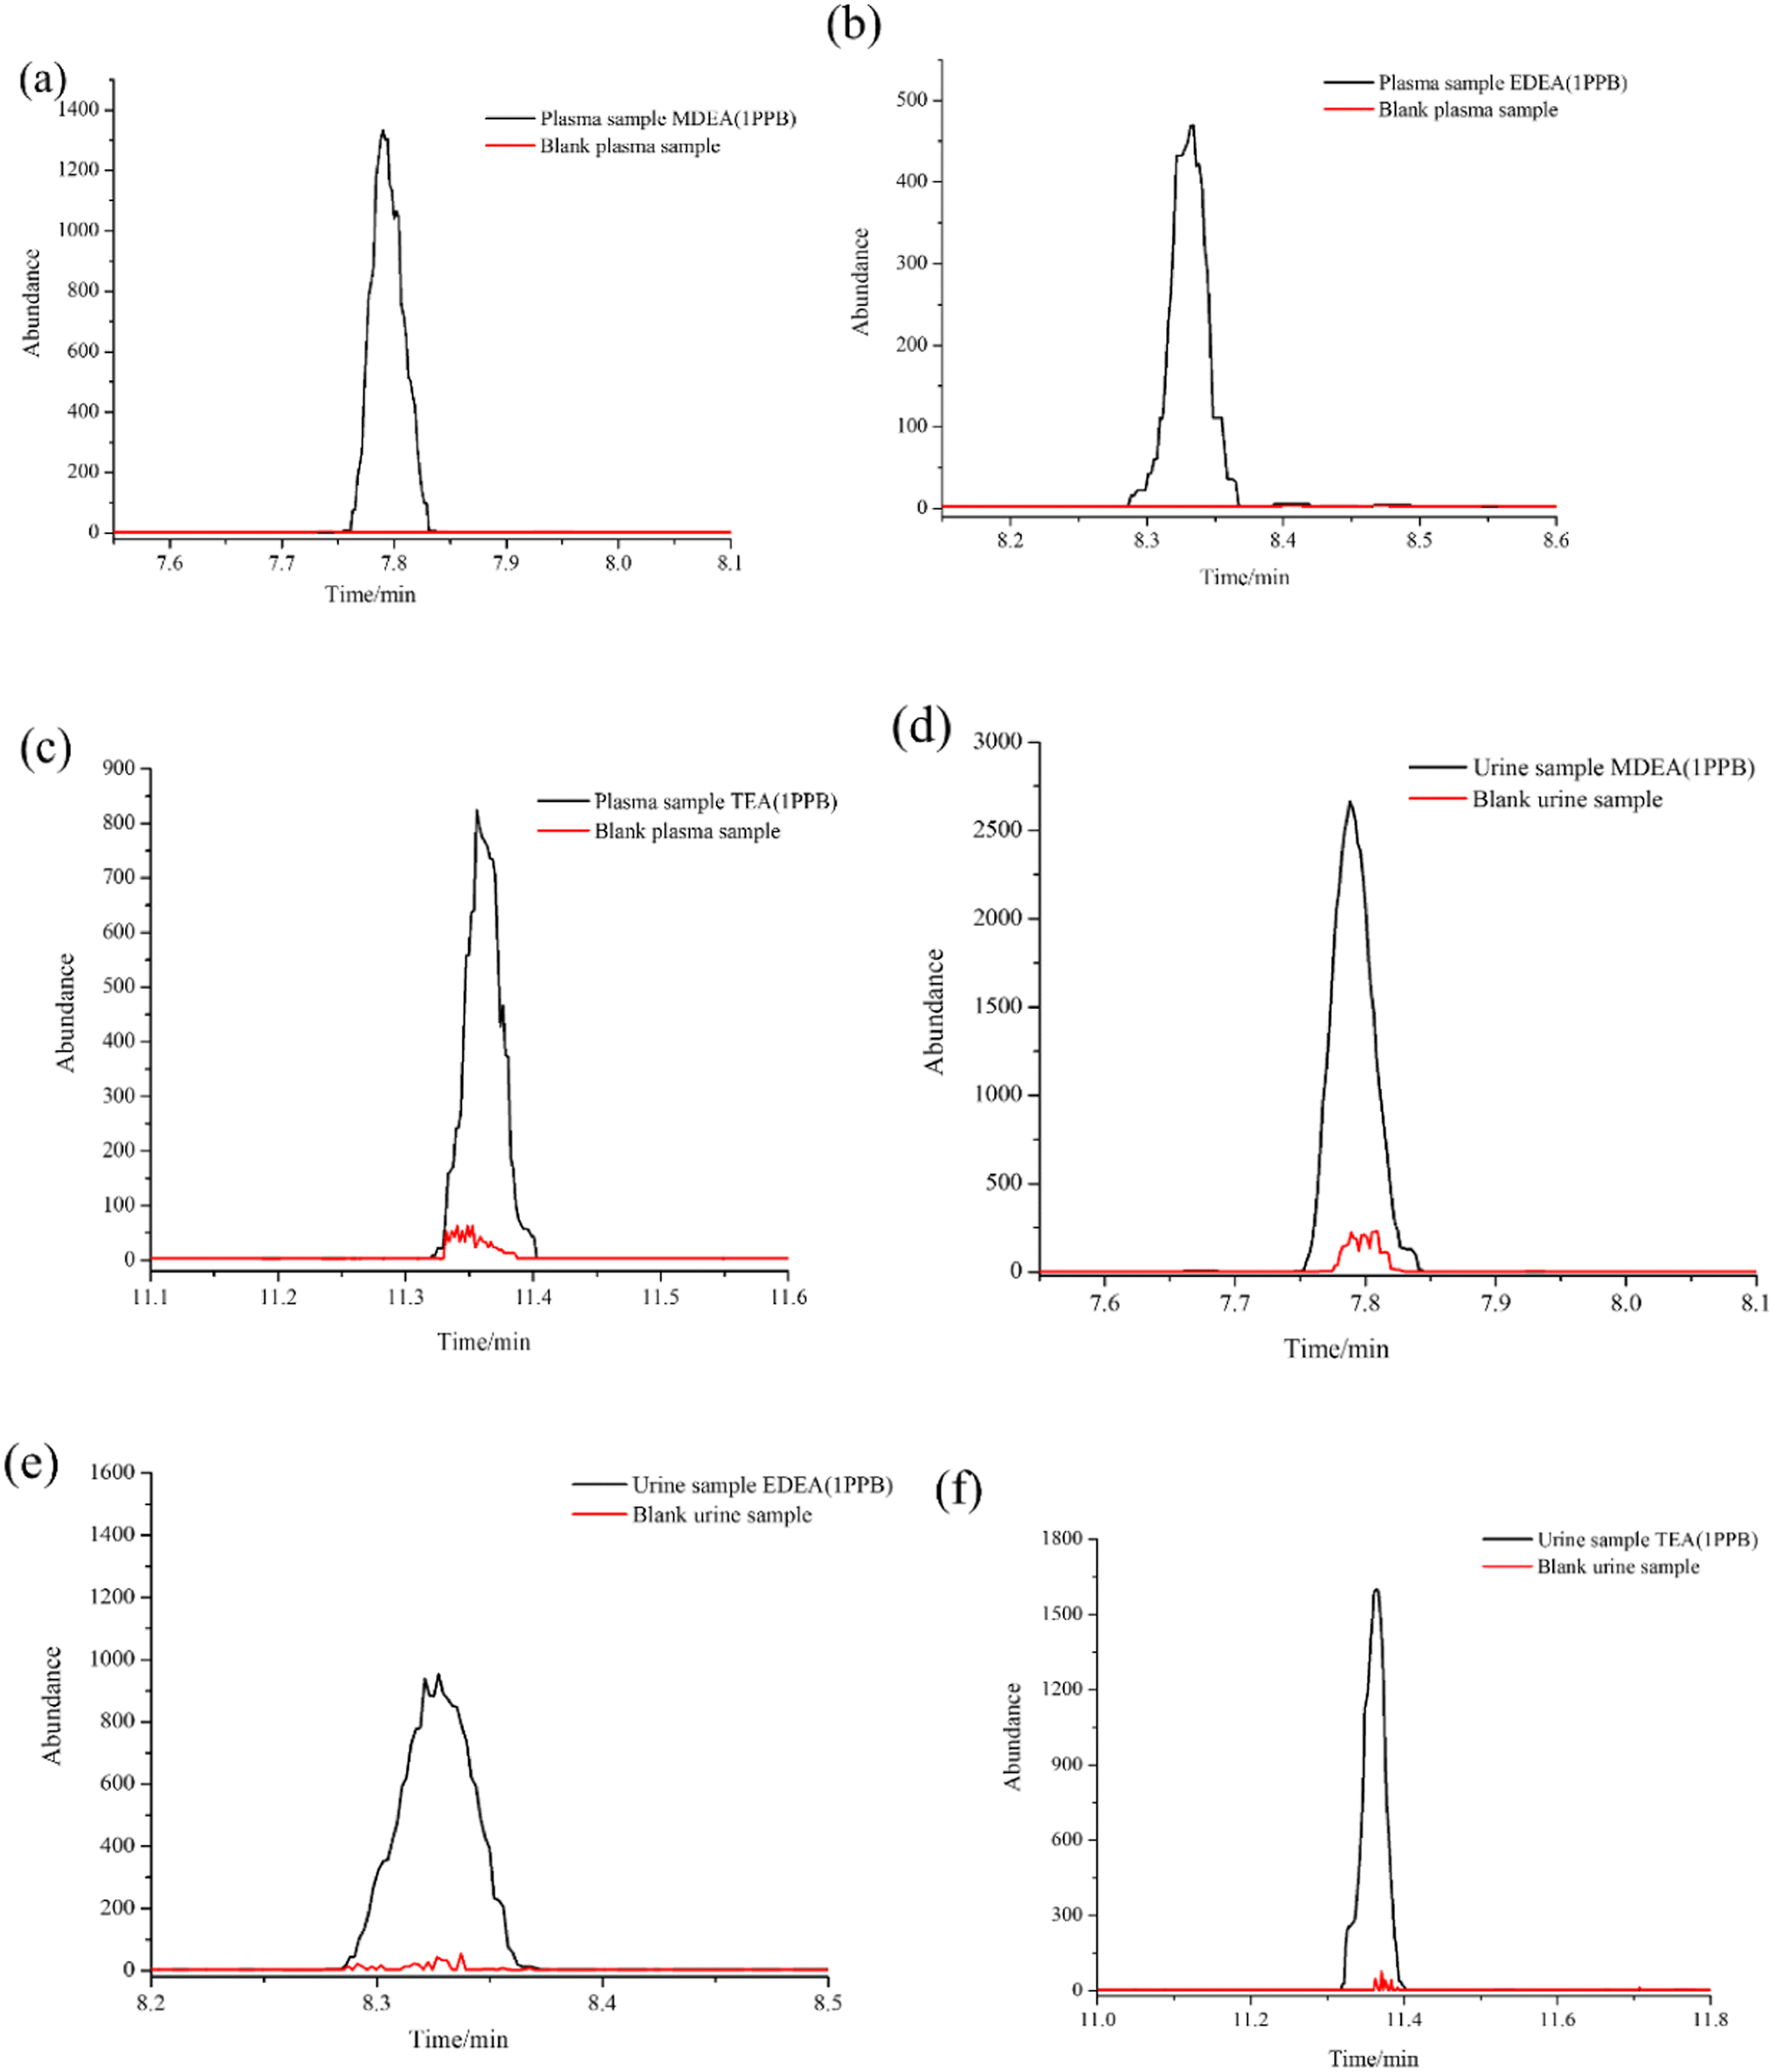 | ||
| Fig. 7 LOQ peaks for three analytes in plasma and urine compared to matrix blank samples: (a) MDEA in plasma; (b) EDEA in plasma; (c) TEA in plasma; (d) MDEA in urine; (e) EDEA in urine; (f) TEA in urine. | ||
3.7 Specificity
The specificity of the method was estimated by comparing the spiked urine and plasma samples with the blank via the confirmation transitions. The chromatograms of blank samples compared to spiked samples revealed that no background or interference peaks were present for all three analytes in any of the blank samples. Notably, no amino alcohol analyte was detected from the plasma or urine samples without known exposure to NMs in the current study. This could be due to the concentration levels of MDEA, EDEA and TEA in all the investigated blank samples being undetectable below the LOD. These findings underscore the excellent specificity of our method, indicating its ability to reliably distinguish the target analytes from potential interferences or background signals.3.8 Accuracy and precision
The intra-day (n = 6) and inter-day (n = 6) accuracy and precision of each analyte in plasma and urine were investigated via the QC samples. The results shown in Table 3 show that the average intra-day accuracies for the analytes in the plasma ranged from 96.5% to 108% for MDEA, 104% to 117% for EDEA, and 95% to 104% for TEA. Similarly, the intra-day results in the urine samples ranged from 105% to 122% for MDEA, 94.3% to 122% for EDEA, and 109% to 111% for TEA. The results of the inter-day accuracy for plasma and urine ranged from 95.5% to 104% and 95.3% to 113% for MDEA, 93.7% to 97% and 98.7% to 117% for EDEA, and 95.6% to 108% and 110% to 115% for TEA.| Sample | Analyte | Expected concentration (ng mL−1) | Intra-day (n = 6) | Inter-day(n = 6) | |||||
|---|---|---|---|---|---|---|---|---|---|
| Calculated concentration | Accuracy (%) | RSD (%) | Calculated concentration | Accuracy (%) | RSD (%) | ||||
| (ng mL−1) | (ng mL−1) | ||||||||
| Plasma | MDEA | QCL | 3 | 3.24 ± 0.17 | 108 | 5.7 | 3.13 ± 0.15 | 104 | 4.8 |
| QCM | 400 | 386 ± 21.8 | 96.5 | 5.6 | 382 ± 11.9 | 95.5 | 3.1 | ||
| QCH | 800 | 848 ± 33.2 | 106 | 4.2 | 824 ± 38.3 | 103 | 4.6 | ||
| EDEA | QCL | 3 | 3.13 ± 0.16 | 104 | 5.3 | 2.86 ± 0.12 | 95.3 | 4.2 | |
| QCM | 400 | 436 ± 19.8 | 109 | 4.5 | 416 ± 17.8 | 104 | 4.3 | ||
| QCH | 800 | 936 ± 45.7 | 117 | 4.8 | 904 ± 58.5 | 113 | 6.5 | ||
| TEA | QCL | 3 | 2.87 ± 0.15 | 95.7 | 5.2 | 2.81 ± 0.09 | 93.7 | 3.2 | |
| QCM | 400 | 380 ± 23.8 | 95 | 6.3 | 388 ± 13.8 | 97 | 3.6 | ||
| QCH | 800 | 832 ± 44.2 | 104 | 5.3 | 775 ± 26.2 | 96.9 | 3.4 | ||
| Urine | MDEA | QCL | 3 | 3.16 ± 0.21 | 105 | 6.6 | 2.96 ± 0.11 | 98.7 | 3.7 |
| QCM | 400 | 488 ± 28.2 | 122 | 5.8 | 468 ± 18.4 | 117 | 3.9 | ||
| QCH | 800 | 952 ± 48.3 | 119 | 5.1 | 896 ± 32.4 | 112 | 3.6 | ||
| EDEA | QCL | 3 | 2.83 ± 0.17 | 94.3 | 6 | 3.23 ± 0.17 | 108 | 5.3 | |
| QCM | 400 | 488 ± 22.3 | 122 | 4.6 | 428 ± 20.1 | 107 | 4.7 | ||
| QCH | 800 | 770 ± 40.2 | 96.3 | 5.2 | 765 ± 43.7 | 95.6 | 5.7 | ||
| TEA | QCL | 3 | 3.26 ± 0.14 | 109 | 4.3 | 3.44 ± 0.21 | 115 | 6.1 | |
| QCM | 400 | 443 ± 22.9 | 111 | 5.2 | 439 ± 27.2 | 110 | 6.2 | ||
| QCH | 800 | 890 ± 48.3 | 111 | 6 | 890 ± 40.8 | 111 | 4.6 | ||
3.9 Evaluation of the matrix effects
The response of the peaks for the targets might be affected by the matrix complexity. Two recognized criteria were applied to evaluate the matrix effects for the NM biomarkers in the plasma and urine. The following equation (eqn (1)) was applied to determine the peak response in different matrixes compared to deionized water.| ME (%) = |Areasolvent − Areamatrix|/Areasolvent × 100% | (1) |
The calculated results of the ME (%) were categorized as mild (0% to 20%), moderate (20% to 50%) and significant (>50%).37 The ME (%) was calculated when the spiked concentration was 500 ng mL−1 for MDEA, EDEA and TEA in the plasma and urine and compared to deionized water. The values for plasma were calculated as 15.8 ± 2.3% for MDEA, 15.2 ± 2.3% for EDEA and 15.9 ± 2.6% for TEA. Meanwhile, the results for urine were determined as 16.2 ± 2.2% for MDEA, 16.3 ± 2.2% for EDEA and 16.7 ± 2.2% for TEA.
The other method based on the confirmation ion ratio (CIR, the area of the qualifier ion peak divided by that of the ion peak for quantitation) was applied for evaluating the effects for different spiked-concentrations in the bio-matrix.32 A stable CIR value represented the reliability of method in different matrixes with various concentrations. The value of the CIR for the three QC samples in plasma and urine were 62.0 ± 2.0% and 63.0 ± 3.1% for MDEA, 71.5 ± 4.3% and 77.3 ± 7.7% for MDEA, and 79.3 ± 1.7% and 77.0 ± 4.7% for TEA, respectively. In summary, the results for ME (%) calculation and CIR assessment confirmed the applicability of the method for different matrixes.
3.10 Application in the actual samples
During the OPCW's 6th Biomedical Proficiency Testing, an additional trace urine sample (signed P002) was dispatched to our lab. The P002 sample was requested to confirm the presence or absence of metabolites (or biomarkers) as a result of blister agent exposure according to the characteristics of the sample.The established methods were applied to identify the biomarkers of blister agent exposure in the P002 sample. A blank and a control sample were prepared and analyzed with the actual sample simultaneously. The samples were treated as described in the Sample preparation and GC-MS/MS analysis sections. The three determined mass transitions for the HFBI derivatization of amino alcohols were utilized to investigate the biomarkers of NMs at the corresponding retention times. The ratios of the confirmation transitions to the qualification transitions for the samples were also recorded by calculation of the peaks for the two transitions and compared to the control sample. The results are shown in Fig. 8a and b. TEA was detected in the P002 sample. The ratio of m/z 524 → 169 (confirmation transition) to m/z 524 → 241 (quantification transition) for the actual sample was stable within 75.4 ± 2.2%, which was consistent with the QC samples in our previous research. The information for the spiked chemical (TEA) in the P002 sample was evaluated as completely correct by OPCW. The results confirmed that the method we established herein could also be applied in the analysis of authentic biomedical samples.
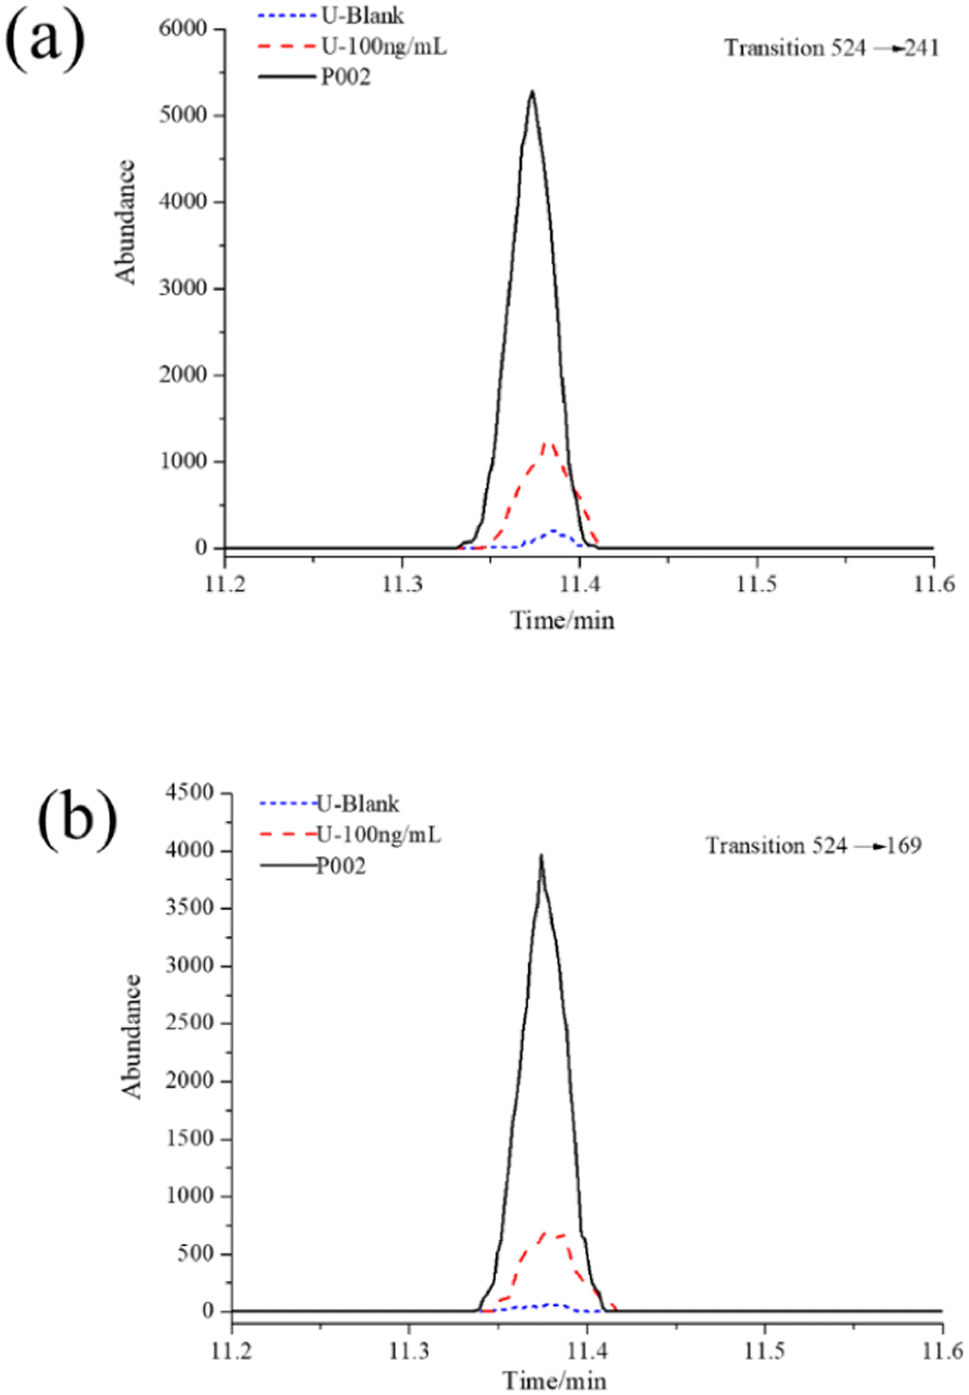 | ||
| Fig. 8 GC-MS/MS SRM chromatogram of samples in the OPCW's 6th Biomedical Proficiency Testing. | ||
4. Conclusions
A convenient and sensitive GC-MS/MS method for simultaneous quantification of NM metabolites both in plasma and urine was established and fully validated in this study. The sample preparation involved the SPE procedure and derivatization. The achievements of simultaneous and efficient extraction of three metabolites of MDEA, EDEA and TEA from the spiked plasma and urine were based on the cation exchange on the SCX cartridge. Subsequently, the amino alcohols were derived using the HFBI regent. The SPE conditions including cartridges, loading solutions and eluting solvents were completely optimized. Meanwhile, the reaction time, temperature, and amount of reagent for derivatization were also evaluated. The simple and reliable sample preparation was easily accomplished and its application can be expanded in other laboratories. Complete GC separation of the three analytes and ISTD were achieved. The sensitive detection was obtained using GC-NCI-MS/MS via the optimization of collision energies and other parameters. The established method was fully investigated for linearity, LOQ, LOD, accuracy and precision for inter-day and intra-day. Two criteria were evaluated for the determination of ME. In particular, DFT calculation was applied to interpret the mass fragmentation of the analytes in the CI source. The result highlighted the method's reliability and convenience for analyzing biological samples after exposure to nitrogen mustard gas. Consequently, our research provides a reliable and convenient method for the analysis of the biomarkers for nitrogen mustard gas, showing great potential in the verification of compliance with the Chemical Weapons Convention (CWC).Declarations
All the experiments on human plasma or urine in this study were performed under the general ethical guidelines (Ethical review of biomedical research involving humans) on conducting scientific research and approved by the ethics committee of State Key Laboratory of NBC Protection for Civilian (No. LAE-2023-07-001).Conflicts of interest
All written informed consent was obtained from all participants whose plasma and urine samples were used. The authors declare no competing interests.References
- Convention on the Prohibition of the Development, Production, Stockpiling and Use of Chemical Weapons and on Their Destruction, Organisation for the Prohibition of Chemical Weapons (OPCW), The Hague, The Netherlands, 1997, available at: https://www.opcw.org/chemical-weapons-convention/, accessed 10 August 2019.
- Report of the OPCW Fact-Finding Mission in Syria Regarding Alleged Incidents in Ltamenah, the Syrian Arab Republic, 2017, available at: https://www.opcw.org/sites/default/files/documents/2019/03/s-1731-2019%28e%29.pdf, accessed 10 June 2019.
- Summary of the report on activities carried out in support of a request for technical assistance by the United Kingdom of Great Britain and Northern Ireland (technical assistance visit TAV/02/18), available at: https://www.opcw.org/sites/default/files/documents/S_series/2018/en/s-1612-<?pdb_no 2018?>2018<?pdb<?db_id PDB?> END?>_e___1_.pdf, accessed 14 July 2019.
- OPCW, Decision; chemical weapons incident in Kuala Lumpur, Malaysia, available at: https://www.opcw.org/sites/default/files/documents/EC/84/en/ec84dec08_e_.pdf, accessed 14 July 2019.
- Ministry of Foreign Affairs of Japan, https://www.mofa.go.jp/mofaj/press/pr/wakaru/topics/vol162/, accessed 8 January 2019.
- Organization for the Prohibition of Chemical Weapons, JOINT DECLARATION, https://www.opcw.org/sites/default/files/documents/EC/M-55/en/ecm55nat01r2_e_.pdf, accessed 8 January 2019.
- V. R. Thompson and A. P. DeCaprio, Chem. Res. Toxicol., 2013, 26, 1263–1271 Search PubMed.
- M. L. Sperry, D. Skanchy and M. T. Marino, J. Chromatogr. B, 1998, 716, 187–193 CrossRef CAS PubMed.
- N. H. Johnson and H. Nathan, Historical Perspective of Chemical Warfare Agents, 2015, pp. 7–15 Search PubMed.
- Convention on the Prohibition of the Development, Production, Stockpiling and Use of Chemical Weapons and their Destruction, Technical Secretariat of the Organization for Prohibition of Chemical Weapons, The Hague, 1997, accessible through Internet http://www.opcw.nl visited on 01.07.09.
- I. M. Ariel, Am. J. Surg., 1961, 102, 647–650 CrossRef CAS PubMed.
- V. Kumar and H. Rana, RSC Adv., 2015, 5, 91946–91950 RSC.
- B. Andreas, S. Nicolas, W. Nathalie, G. L. Sandrine, C. G. Bochet and C. Christophe, RSC Adv., 2018, 8, 23881–23890 RSC.
- M. Antoine, D. Fabris and C. Fenselau, Drug Metab. Dispos., 1998, 26, 921–926 CAS.
- D. Noort, A. G. Hulst and R. Jansen, Arch. Toxicol., 2002, 76, 83–88 CrossRef CAS PubMed.
- T. Rozsypal, J. Planar Chromatogr., 2020, 33, 669–677 CrossRef CAS.
- P. Garg, A. Purohit, V. K. Tak and D. K. Dubey, J. Chromatogr. A, 2009, 1216, 7906–7914 CrossRef CAS PubMed.
- M. Otsuka, H. Miyaguchi and M. Uchiyama, J. Chromatogr. A, 2020, 1625 Search PubMed.
- B. G. Pantazides, J. Q. Gonzalez, D. M. R. Nazario and B. S. Crow, J. Chromatogr. B, 2019, 1121, 9–17 CrossRef CAS PubMed.
- Y. Lin, Y. Dong, J. Chen, C. Z. Li, Z. Y. Nie, L. Guo, Q. Liu and J. W. Xie, J. Chromatogr. B, 2013, 15, 955 Search PubMed.
- S. A. Willison, J. Chromatogr. B, 2012, 1270, 72–79 CrossRef CAS PubMed.
- J. B. Riddar, D. Karlsson, M. Dalene and G. Skarping, Anal. Lett., 2013, 3, 298–313 CrossRef CAS.
- S. W. Lemire, D. L. Ashley and A. M. Calafat, J. Anal. Toxicol., 2003, 27, 6 CrossRef PubMed.
- S. W. Lemire, R. J. Barr, L. D. Ashley and T. C. Olson, J. Anal. Toxicol., 2004, 28, 320–326 CrossRef CAS PubMed.
- I. Ohsawa and Y. Seto, J. Chromatogr. B, 2006, 1122, 242–248 CrossRef CAS PubMed.
- P. K. Kanaujia, V. Tak, D. Pardasani, A. K. Gupta and D. K. Dubey, J. Chromatogr. B, 2008, 1185, 167–177 CrossRef CAS PubMed.
- N. L. Koryagina, M. D. Shachneva, A. I. Ukolov, E. I. Saveleva, N. S. Khlebnikova and A. S. Radilov, J. Anal. Chem., 2018, 73, 1269–1274 CrossRef CAS.
- M. D. Shachneva, N. L. Koryagina and E. I Savelieva, J. Anal. Chem., 2022, 77, 1664–1668 CrossRef CAS.
- E. Jakubowski, F. Sidell, R. Evans, M. Carter, J. Keeler, J. Mcmonagle and A. Swift, J. Anal. Chem., 2000, 10, 143–150 CAS.
- E. M. Jakubowski, C. L. Woodard, M. M. Mershon and T. W. Dolzine, J. Chromatogr. B, 1990, 528, 184–190 CrossRef CAS PubMed.
- Department of Health and Human Services: Food and Drug Administration: Washington , Bioanalytical method validation, in Guidance for industry, 2001.
- C. C. Liu, G. L. Huang, H. L. Xi, S. L. Liu, J. Q. Liu, H. L. Yu, S. K. Zhou, L. H. Liang and L. Yuan, J. Chromatogr. B, 2016, 1036, 757–765 Search PubMed.
- M. Alzweiri, M. Khanfar and Y. Al-Hiari, Chromatographia, 2015, 78, 251–258 CrossRef CAS.
- B. Chandra, K. Sinha Roy, M. Shaik, C. Waghmare and M. Palit, Rapid Commun. Mass Spectrom., 2020, 8777 CrossRef PubMed.
- M. Kikuchi, M. Sato, I. Tatsuro and H. Masao, J. Chromatogr. B, 2021, 752, 149–157 CrossRef PubMed.
- F. Neese, Coord. Chem. Rev., 2009, 253, 526–563 CrossRef CAS.
- I. Matic, S. Grujic, Z. Jaukovic and M. Lausevia, J. Chromatogr. A, 2014, 1364, 117–127 CrossRef CAS PubMed.
| This journal is © The Royal Society of Chemistry 2023 |