 Open Access Article
Characterization of three different benzimidazolium ligands and their organo-selenium complexes by using density functional theory and Raman spectroscopy†
Sobia Younas‡
a,
Aqdas Riaz‡a,
Haq Nawaz *a,
Muhammad Irfan Majeed
 *a,
Muhammad Adnan Iqbala,
Nosheen Rashidb,
Areeba Altafa,
Umar Sohail Shoukata,
Faisal Jamila,
Aafia Sehara,
Sania Munira,
Mahrosh Javeda and
Muhammad Imran
 c
c
aDepartment of Chemistry, University of Agriculture Faisalabad, Faisalabad 38000, Pakistan. E-mail: haqchemist@yahoo.com; irfan.majeed@uaf.edu.pk
bDepartment of Chemistry, University of Education, Faisalabad Campus, Faisalabad 38000, Pakistan
cDepartment of Chemistry, Faculty of Science, King Khalid University, P.O. Box 9004, Abha 61413, Saudi Arabia
First published on 4th December 2023
Abstract
In the present study, Raman spectroscopy (RS) along with density functional theory (DFT) calculations have been performed for the successful characterization and confirmation of the formation of three different selenium-based N-heterocyclic carbene (NHC) complexes from their respective salts. For this purpose, mean RS features and DFT calculations of different ligands and their respective selenium NHC complexes are compared. The identified characteristic RS and DFT features, of each of these ligands and their selenium complexes, show that the polarizability of benzimidazolium rings increases after complex formation with selenium. This has been shown by the enhanced intensity of the associated Raman peaks, therefore, confirming the formation of newly formed bonds. The complex formation is also confirmed by the identification of several new peaks in the spectra of complexes and these Raman bands were absent in the spectra of the ligands. Moreover, Raman spectral data sets are analyzed using a multivariate data analysis technique of Principal Component Analysis (PCA) to observe the efficiency of the RS analysis. The results presented in this study have proved the RS technique, along with DFT, an undoubtedly fast approach for the confirmation of synthesis of selenium based NHC-complexes.
1. Introduction
The N-heterocyclic carbene (NHC) complexes were first synthesized from imidazolium salts.1 NHCs are derivatives of persistent carbene compounds having divalent carbons. These heterocyclic species have two nitrogen atoms attached with a carbene carbon within the ring arrangement.2 The NHC complexes have been considered for numerous applications in various areas such as organometallic drugs,3 in the industry as catalysts for organic alterations and polymerization reactions, in dye-sensitized thin-film solar cells and in thousands of antimicrobials and anti-tumor medicines.4Since then, the synthesis of novel NH-free carbene ligands and their corresponding metallic compounds such as with silver and selenium have become an area of extensive research.5 Various researches have shown that protein-rich foods such as eggs, fish and meat also contain huge amounts of selenium, with its antioxidant activity through enzymes such as glutathione peroxidase.6 Many of the applications regarding selenium-containing NHC complexes have also been studied in effective cancer treatment, anti-septic agents, antibiotics, antioxidants and stress relieving medicines.7,8
The various organoselenium complexes are being synthesized in several ways and for their exact characterization, different physical methods such as melting point and spectroscopic analytical approaches, for instance, Electrospray Ionization Mass Spectrometry (ESI-MS), Fourier-transform infrared spectroscopy (FT-IR), Nuclear Magnetic Resonance (NMR) spectroscopy and X-ray crystallography are being used.9,10 However, available literature reveals that these above-illustrated approaches do not provide a direct detection pathway within one certain analytic cycle as these techniques have many limitations like consumption, require more sample, expensive, often require complex sample preparation and various intermediate steps which are expensive and laborious.11,12 Raman spectroscopy has been used to minimize the limitations of the above illustrated techniques as it is inexpensive, based on nondestructive interaction between light with chemical bonds within a material, requires no complex sample preparation and requires sample only in a small amount. Raman spectroscopy has also been used to study crystallinity, chemical structure, polymorphism, phase, molecular interactions and to minimize the limitations in the characterizations of organometallic compounds such as dimethylselone, seleno urea, organo selenols, organo selenium carbene, organo selenium halides and transition organo selenium compounds.11,13,14
This paper unravels a significant indication of the successful formation of selenium complexes from their particular NHC salts through Raman spectral (RS) analysis along with the support of DFT analysis with great precision. Raman spectroscopy is a molecular vibrational spectroscopic technique that provides vastly valuable evidence about the structures of the molecules based on the Raman scattering effect.15 This spectroscopic technique provides sensitive information which is specific to the distinct fingerprint of constituent particles in a sample under observation,16 thus enabling the detection of analytes.17 This broadened scope of the Raman spectral technique over the other traditional techniques include its good spatial resolution in spectroscopic information with non-destructive identification of target components under ordinary conditions.18
In the current study, the successful structural elucidation of three different selenium-carbene coordination complexes (with respect to nitrogen attached side chains) has been accomplished through the RS technique along with the DFT method to further explore Raman spectroscopy for such applications. Raman spectroscopy along with a multivariate data analysis technique, Principal Component Analysis (PCA), has been employed for the characterization of three structurally different (differing in substituent at nitrogen) ligands/benzimidazolium salts (ligand-I, ligand-II and ligand-III) and their respective organometallic compounds mono-NHC-selenium complexes (complex-I, complex-II and complex-III). This investigation has led to the advancement in Raman-based approaches for differentiation between a variety of ligands and their particular complexes and also provides an understanding of confirmation of the formation of coordinate covalent bonds in these complexes.
2. Material and methods
2.1 Synthesis of organometallic compounds
Three different salts are named as ligand-I (L1), ligand-II (L2) and ligand-III (L3) and their corresponding selenium adducts are named as complex-I (C1), complex-II (C2) and complex-III (C3) have been synthesized. The details of synthesis and other characterizations will be reported separately and are beyond the scope of the current study.2.2 DFT calculations
Computational calculations of benzimidazolium ligands and their organo-selenium complexes to get the structural parameters were performed by using Gaussian 09 (ref. 19) and GaussView 06.20 DFT measurements are based at B3LYP (Becke's three parameter exchange functional B3 combined with LeeYang–Parr correlation functional LYP).212.3 Raman spectral acquisition
Raman spectral acquisition of three different ligands and their respective selenium complexes as described in Fig. 1 was characterized using Raman spectrometer (Peak Seeker Pro-785; Agiltron, USA) using a near-infrared (IR) diode laser with a wavelength of 785 nm. To acquire Raman spectral data, a small quantity, 25 mg of each sample was placed on a small grove within the clean aluminum slide and fifteen spectra of each sample were recorded in the 200–1800 cm−1 wavenumber range with the spectral resolution of ≈9 cm−1 and 17 points spectral window at 150 mW laser power and 30 seconds of integration time. The monochromatic laser light was passed through the optics and the attached optical microscope with the incorporated lens of 40×/0.60 and a spot size of 2 μm. To acquire better Raman scattering, the laser was focused just on the surface of the sample on a slide under analysis. Throughout getting Raman spectra, the same focusing level was ensured every time during each measurement using a camera fixed with the microscope. The laser power was also optimized with great care to avoid photodegradation. During the whole process of Raman spectra recording, it was made certain that all the samples, both the ligands as well as their selenium complexes were provided with the persistent conditions. Because of the rapidity of this Raman instrumental technique, it was possible to record measurements of all the samples in a single day to overcome any kind of relevant issues.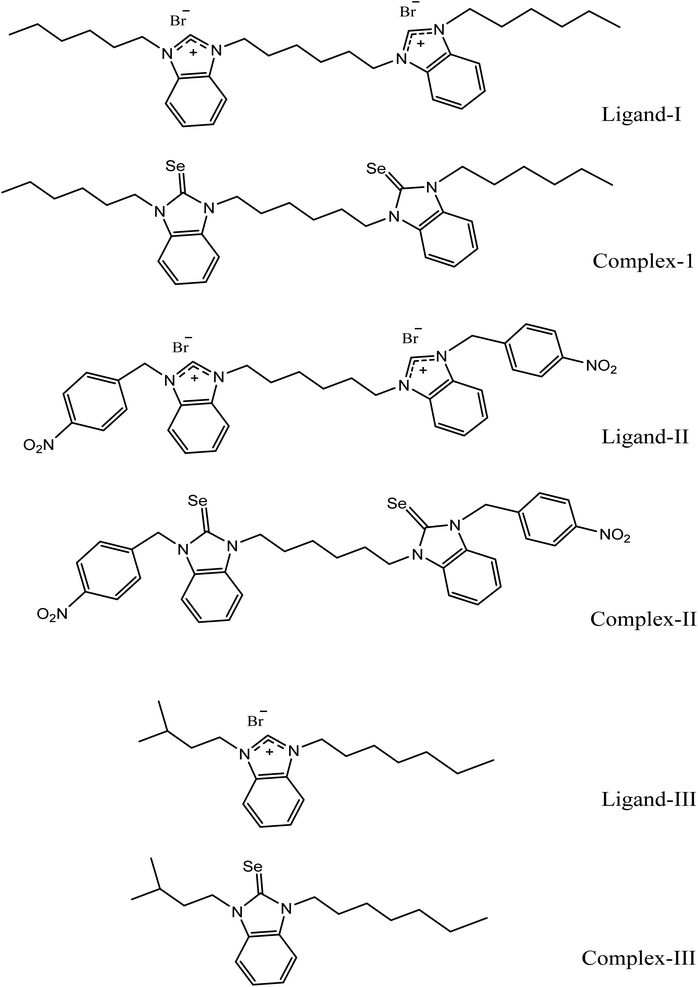 | ||
| Fig. 1 Structural formulas of benzimidazolium salts (ligand-I, ligand-II and ligand-III) and their respective selenium-N-heterocyclic carbene complexes (complex-I, complex-II and complex-III). | ||
2.4 Raman spectral data preprocessing
Before the analysis, the application of preprocessing on raw data was of great significance to achieve robust information and for the enhancement of distinct and prominent features. For this purpose, pre-processing of RS data for three pairs of ligands with their subsequent selenium complex compounds was accomplished using Matlab 7.8 with established protocols. This preprocessing included range selection, baseline correction, normalization and smoothing and substrate removal. A suitable and applicable “The Savitzky–Golay Smoothing method” (order 1, 17 point window) was processed to get all the spectra smoothed and a rubber band algorithm was carried out as well to get baseline corrected.2.5 Raman spectral data analysis
The RS data was examined by making comparisons of the mean Raman spectra of each ligand with that of its corresponding metal complex and shown in Fig. 2–4. A vast literature has been studied to ascribe the Raman peaks and their obtained DFT results have been mentioned in Table 1. The interpretation has been made for the final results. Additional analysis has also been performed by using principal component analysis (PCA), an unsupervised multivariate data analysis technique that involves the transformation of correlated variables into uncorrelated variables called principal components (PCs). A linear transformation has been performed on the data to capture most of the variance by the first few principal components. The first principal component (PC-1) captures the most variance, which has been followed by the second principal component (PC-2).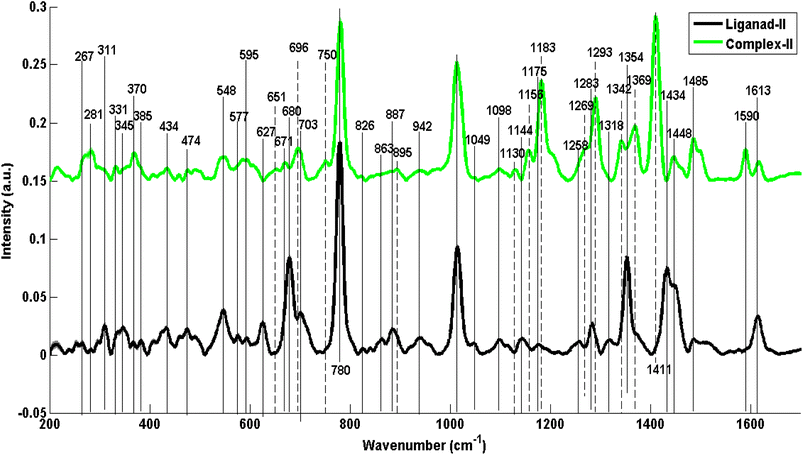 | ||
| Fig. 4 Comparison of mean Raman spectra of ligand-II (L2) with the mean spectrum of complex-II (C2). | ||
| Observed L1 (cm−1) | DFT b3lyp L1 (cm−1) | Observed C1 (cm−1) | DFT b3lyp C1 (cm−1) | Observed L2 (cm−1) | DFT b3lyp L2 (cm−1) | Observed C2 (cm−1) | DFT b3lyp C2 (cm−1) | Observed L3 (cm−1) | DFT b3lyp L3 (cm−1) | Observed C3 (cm−1) | DFT b3lyp C3 (cm−1) | Peak assignment | References |
|---|---|---|---|---|---|---|---|---|---|---|---|---|---|
| a Abbreviations = (o-p = out-of-plane); (i-p = in-plane); (sym = symmetrical); (def = deformation); (wag = wagging); (sci = scissoring); (Bz = benzene); (str = stretching). | |||||||||||||
| 267 | 270 | 267 | 268 | 267 | 267 | 267 | 265 | 266 | 266 | — | — | (C–C–C) o-p bending | 22 |
| 286 | 283 | 286 | 287 | 281 | 281 | 281 | 281 | 280 | 280 | 280 | 280 | CH2 rocking | 23 |
| — | — | — | — | — | — | — | — | 293 | — | 293 | 291 | CH2 rocking | 23 |
| — | — | — | — | 311 | 308 | — | — | 309 | 310 | — | — | Def vibrations in C–C–C | 24 |
| 331 | 340 | 331 | 328 | 331 | 334 | 331 | 326 | 331 | 330 | 331 | 330 | Ring wag + chain def | 25 |
| 367 | 369 | 367 | 372 | 370 | 366 | 370 | 369 | — | — | — | — | C–C def | 26 |
| — | — | — | — | 385 | 376 | 385 | 390 | — | — | — | — | Bz ring bending modes | 27 |
| — | — | — | — | — | — | — | — | 421 | 421 | 421 | 421 | Ring rotation 5-member ring | 25 and 28 |
| — | — | — | — | 434 | 434 | 434 | 441 | 434 | 434 | 434 | 432 | C–C def of aliphatic chain | 23 and 26 |
| 458 | 458 | 458 | 457 | — | — | — | — | 457 | 459 | 457 | 462 | C–C–C o-p bend | 29 |
| 476 | 476 | 476 | 476 | 474 | 475 | 474 | 475 | — | — | — | — | C–C skeleton def | 30 |
| — | — | — | — | — | — | — | — | 499 | 498 | 499 | 498 | C–N o-p bend benzimidazole | 25 |
| 539 | 546 | 539 | 539 | — | — | — | — | 532 | — | 532 | — | C–N–C def aliphatic chain | 31 |
| — | — | — | — | 548 | 546 | 548 | 547 | — | — | — | — | Wag mode of NO2 | 32 |
| — | — | — | — | 577 | 577 | 577 | 579 | 572 | 582 | 572 | 582 | Ring def benzimidazole | 23 |
| — | — | — | — | — | — | — | — | 609 | 609 | 609 | 609 | C–C–C def i-p vibration mode of bz | 33 |
| 617 | 615 | 617 | 619 | — | — | — | — | — | — | — | — | C–C–C symmetric bend phenyl ring | 34 |
| — | — | — | — | 627 | 626 | — | — | — | — | — | — | C–C–C def i-p benzimidazole | 33 and 34 |
| — | — | — | — | — | — | 651 | 651 | — | — | — | — | Phenyl ring vibrations | 35 |
| 713 | 713 | 713 | 713 | 713 | — | 713 | 713 | 713 | 713 | 713 | 713 | C–N o-p str of 5-membered ring | 23 |
| 736 | 738 | 736 | 737 | — | — | — | — | — | — | — | — | Bz C–H sym wag | 36 |
| 750 | 752 | 750 | 750 | — | — | 750 | 750 | — | — | — | — | Bz o-p bend benzimidazole | 23 and 37 |
| 779 | 782 | 779 | 781 | 780 | 784 | 780 | 787 | 782 | 780 | 782 | 780 | C–H o-p bend benzimidazole | 22, 23 and 37 |
| 822 | 825 | 822 | 820 | 826 | 827 | 826 | 826 | 822 | 822 | C–C str | 26 | ||
| 840 | — | 840 | 840 | — | — | — | — | 843 | 846 | 843 | 845 | C–C str | 38 |
| — | — | — | — | 863 | 863 | — | — | — | — | — | — | NO2 sci | 32 |
| 878 | — | 878 | — | — | — | — | — | — | — | — | — | C–H o-p bend benzimidazole | 23 and 39 |
| — | — | — | — | 887 | 876 | — | — | 890 | 895 | — | — | C–H o-p bend | 22 |
| 897 | 898 | — | — | — | — | 895 | 896 | — | — | — | — | CH2 sci | 40 |
| — | — | — | — | 942 | 938 | 942 | — | — | — | — | — | Imidazole i-p bend | 37 |
| 967 | 963 | 967 | 969 | — | — | — | — | 963 | 959 | 963 | 967 | CH3 wag | 26 and 40 |
| 1019 | 1015 | 1019 | 1019 | 1014 | 1009 | 1014 | 1018 | 1016 | 1023 | 1023 | 1023 | C–C–C trigonal bend benzimidazole | 39 |
| — | — | — | — | 1049 | 1045 | — | — | — | — | — | — | Ring def 5-member | 25 |
| — | — | — | — | — | — | — | — | 1071 | 1071 | — | — | C–C str mode of aliphatic | 23 and 41 |
| — | — | — | — | 1098 | 1089 | 1098 | 1089 | — | — | — | — | C–N str | 18 |
| 1138 | 1139 | 1130 | 1135 | — | — | 1130 | 1130 | 1137 | 1143 | 1137 | 1137 | C–C str aliphatic vibration | 41 |
| — | — | — | — | 1144 | 1141 | 1156 | 1154 | — | — | — | — | C–H sym bend benzimidazole | 42 |
| — | — | 1186 | 1182 | 1175 | 1169 | 1183 | 1182 | 1183 | 1183 | 1183 | 1183 | i-p C–H bend benzimidazole | 37 |
| 1215 | 1213 | 1215 | 1212 | — | — | — | — | — | — | — | — | C–C str aliphatic chain | 23 and 26 |
| — | — | — | — | — | — | — | — | 1225 | 1225 | 1214 | 1218 | C–N str benzimidazole | 43 and 44 |
| — | — | 1246 | 1244 | — | — | — | — | — | — | — | — | C–C str aliphatic side chain | 23 and 26 |
| — | — | — | — | 1258 | 1256 | 1269 | 1269 | 1260 | 1256 | — | — | i-p bz ring def | 27 |
| — | — | 1297 | 1298 | 1283 | 1290 | 1293 | 1298 | 1294 | 1294 | 1294 | 1294 | CH2 def aliphatic chain | 23 and 26 |
| 1313 | 1313 | — | — | 1318 | 1318 | — | — | 1313 | 1313 | — | — | C–H def of CH2 | 45 |
| 1342 | 1340 | 1342 | 1342 | 1342 | 1340 | C–H def in bz ring | 27 and 37 | ||||||
| 1351 | 1351 | 1351 | 1351 | 1354 | 1358 | 1369 | 1367 | 1354 | 1352 | 1354 | 1362 | Ring str imidazole | 27 and 37 |
| — | — | 1416 | 1417 | — | — | 1411 | 1411 | — | — | 1412 | 1410 | C![[double bond, length as m-dash]](https://www.rsc.org/images/entities/char_e001.gif) Se Se |
46 |
| 1434 | 1432 | 1445 | 1443 | 1434 | 1432 | 1448 | 1448 | 1433 | 1427 | 1446 | 1438 | CH def | 41 and 47 |
| — | — | — | — | 1590 | 1589 | 1590 | 1588 | — | — | — | — | C–C–C str mode of vibration in phenyl ring | 33 |
| 1610 | — | 1610 | — | 1613 | 1618 | 1613 | 1617 | 1611 | — | 1611 | — | C![[double bond, length as m-dash]](https://www.rsc.org/images/entities/char_e001.gif) C str mode benzimidazole C str mode benzimidazole |
18, 22, 37 and 48 |
3. Results and discussion
3.1 Molecular electrosttic potential (MEP)
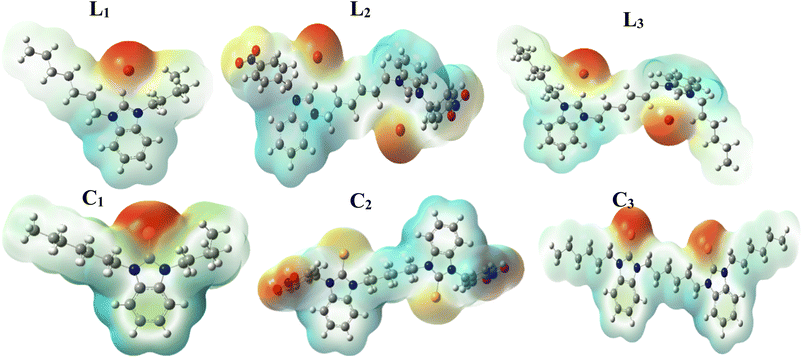
The Molecular Electrostatic Potential (MEP) is a useful tool for predicting the polarity and polarizability of the compounds. In Fig. 2, different colors represent different electrostatic potential values. In MEP calculations, red, orange and yellow colors represent high polarity while blue and green represent lower polarity. In the structures of ligands L1, L2 and L3, the presence of benizimidazole's nitrogens and ionizable bromine make it highly polar and shown as red and orange areas. While in the cases of complexes C1, C2 and C3, the polarity is still present (due to benzimidazole's nitrogens) but reduced because of the removal of bromide. Less polar areas are found around the benzimidazole ring. The surrounding regions having alkyl chains are shown as light blue and green indicating the surrounding of the benzimidazole as less polar and high polarizable as it is more exposed to external electric field. However, with the cases of L2 and C2, –NO2 is present as substituent that contains strongly electronegative atoms that's why shown as red indicting the surrounding of the benzimidazole ring as highly polar site (Fig. 2).3.2 Mean Raman spectral analysis
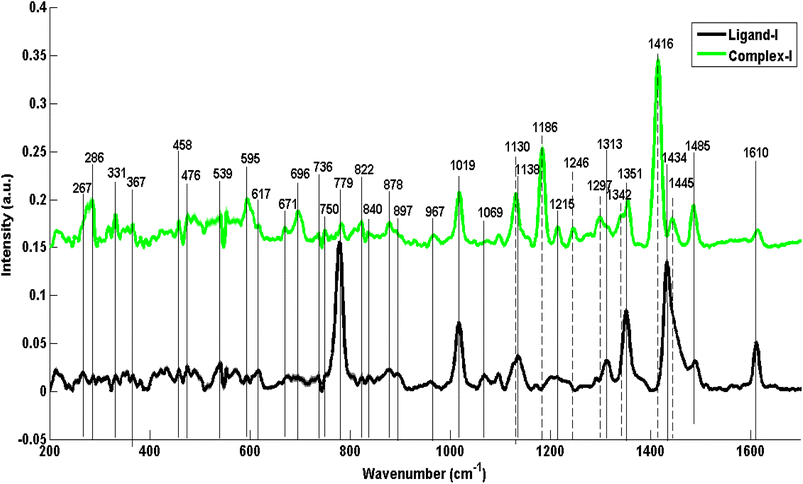
Fig. 3–5 represent the mean Raman spectra of ligands and their respective selenium complexes. Common mean Raman spectral features which are represented by dashed lines as well as highly differentiating features which are represented by solid lines have been manifested drawing vertical lines in spectra and are collectively summarized in Table 1 along with the appropriate assignments and relevant citations are made for corresponding literature. The highly common features which are present in both mean spectra of each metal–ligand pair are the indication of the chemical structure's similarity between the ligand and its metallic counterpart, while the obvious differences can be specifically associated with the attachment of the selenium metal with the complex. Two types of differences are noticeable demonstrating the attachment of selenium metal within a complex including enhancement in intensities and shifts in Raman values of peak positions. The intensity differences and shifts in peaks in these mean spectral features signal the confirmation of stable carbon–selenium dative bond formation.As selenium forms a double bond with the carbene carbon of benzimidazole ring, vanishing of charge on ligand-I which is salt of bromide ion, transforms polarity of the ring into polarizability, as a result enhancing Raman spectral features at 331 cm−1 (imidazole ring wagging accompanied with the attached chains deformation), 713 cm−1 (C–N out of plane stretching vibrations of imidazole rings), 750 cm−1 (out-of-plane bending of benzene in benzimidazole), 736 cm−1 (wagging of C–H in benzene ring). The most significant differentiating features have been manifested through dashed lines at 1416 cm−1 in C1, probably due to C![[double bond, length as m-dash]](https://www.rsc.org/images/entities/char_e001.gif) Se vibrations while a strong peak appearance at 1186 cm−1 is the indication of activation of C–H in-plane bending of benzimidazole ring and a shoulder peak at 1342 cm−1 is due to C–H deformation in benzene ring after complex formation. Notably, these vibrations/spectral features are absent in the L1 structure. Selenium complex formation has resulted in some of the spectral features to decrease in intensities or diminish completely in mean Raman spectra of complexes such as a band in ligand at 1313 cm−1 (C–H deformation of CH2 in aliphatic side chains) is vague in complex and a large peak at 1610 cm−1 in ligand has become a relatively small peak in C1 which indicates the reduced C
Se vibrations while a strong peak appearance at 1186 cm−1 is the indication of activation of C–H in-plane bending of benzimidazole ring and a shoulder peak at 1342 cm−1 is due to C–H deformation in benzene ring after complex formation. Notably, these vibrations/spectral features are absent in the L1 structure. Selenium complex formation has resulted in some of the spectral features to decrease in intensities or diminish completely in mean Raman spectra of complexes such as a band in ligand at 1313 cm−1 (C–H deformation of CH2 in aliphatic side chains) is vague in complex and a large peak at 1610 cm−1 in ligand has become a relatively small peak in C1 which indicates the reduced C![[double bond, length as m-dash]](https://www.rsc.org/images/entities/char_e001.gif) C stretching vibrations of benzimidazole ring after C1 formation. In the same way, relatively intense bands at 779 cm−1 and 878 cm−1 (C–H out of plane bending in benzimidazole) in the spectrum of C1 also confirm selenium complex formation.
C stretching vibrations of benzimidazole ring after C1 formation. In the same way, relatively intense bands at 779 cm−1 and 878 cm−1 (C–H out of plane bending in benzimidazole) in the spectrum of C1 also confirm selenium complex formation.
Comparatively enhanced bands associated with aliphatic side chains at 267 cm−1 and 458 cm−1 (C–C–C out-of-plane bending), 822 cm−1, 840 cm−1, 1215 cm−1, 1246 cm−1 and shift of 1138 cm−1 to 1130 cm−1 (C–C stretching associated with aliphatic chains on both sides of imidazole rings) and at 967 cm−1 (CH3 wagging) are most likely due to the reason that lone pairs at nitrogen atoms become delocalized after complex making, causing less (–I) inductive effect resulting in a lesser amount of polarity and more polarizability of alkyl chains hence enhancing Raman spectral signals in the spectrum of the complex. The bands in the L1 spectrum at 1434 cm−1 and 1313 cm−1 are associated with C–H deformations of CH2 which are characteristic of hydrocarbon chains. Similarly, these Raman spectral features are in correspondence with the Raman spectral features calculated from density functional theory (DFT) as in ESI as Fig. S1.†
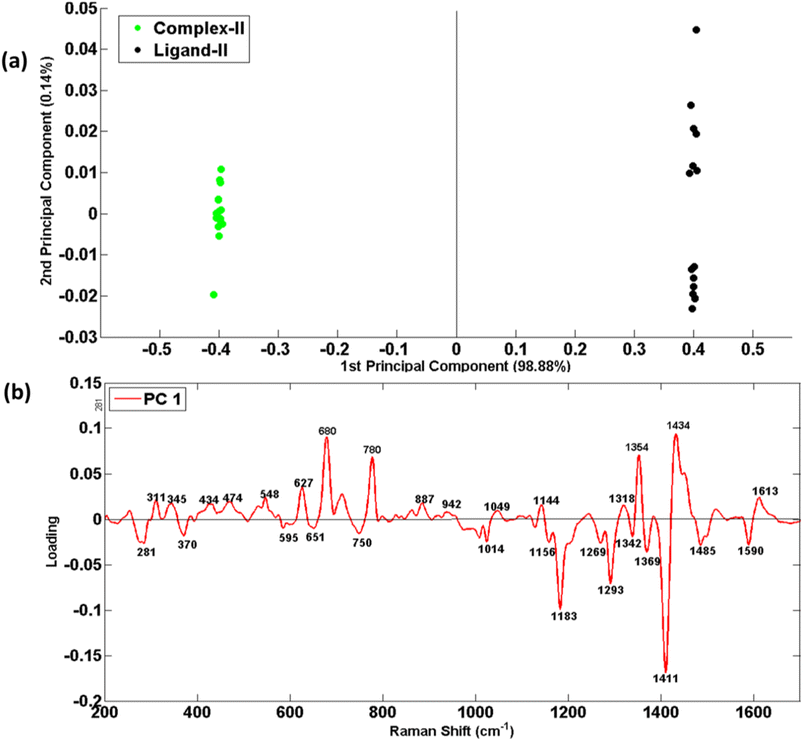
The distinct features in mean RS analysis have been observed, in which features related to benzimidazole ring structure at 331 cm−1 (ring wag with chain twisting), 385 cm−1 (benzene ring bending modes), 577 cm−1 (ring deformation), 627 cm−1 (in-plane C–C–C deformation), 750 cm−1 (Bz out-of-plane bending), 780 cm−1 (C–H out of plane bending), 826 cm−1 (C–C str), 942 cm−1 (imidazole in-plane bending), 1014 cm−1 (C–C–C trigonal bending), 1049 cm−1 (ring deformation in 5-member ring), 1342 cm−1 (C–H deformation in benzene ring), 1613 cm−1 (C![[double bond, length as m-dash]](https://www.rsc.org/images/entities/char_e001.gif) C stretching mode). On the formation of complex, C2 from L2, the disappearance of charges on imidazole ring takes place which leads to diminishing polarity and consequently enhanced polarizability due to which a few peaks become relatively sharp, such as at 281 cm−1 more CH2 rocking occurs with C–C deformation at 370 cm−1 and at 1014 cm−1, C–C–C trigonal bending enhances in benzimidazole structure. The peak intensity at 1144 cm−1, 1175 cm−1 and 1354 cm−1 has been increased as well as shifted at higher wavenumbers to 1156 cm−1, 1183 cm−1 and 1369 cm−1 respectively, predicting strong C–H symmetric, in-plane bending and ring stretching vibrations in imidazole rings respectively. Moreover, the peak shift from 1253 cm−1 to 1269 cm−1 due to an in-plane benzene ring deformation in benzimidazole ring within selenium complex-II (C2). Similarly changes in peak position on the formation of C2 from L2, shift from 1283 cm−1 to 1293 cm−1, have been recognized as CH2 deformations in the aliphatic chain between two imidazole rings. A new shoulder band appearing at 1342 depicts C–H deformation in the benzene ring.
C stretching mode). On the formation of complex, C2 from L2, the disappearance of charges on imidazole ring takes place which leads to diminishing polarity and consequently enhanced polarizability due to which a few peaks become relatively sharp, such as at 281 cm−1 more CH2 rocking occurs with C–C deformation at 370 cm−1 and at 1014 cm−1, C–C–C trigonal bending enhances in benzimidazole structure. The peak intensity at 1144 cm−1, 1175 cm−1 and 1354 cm−1 has been increased as well as shifted at higher wavenumbers to 1156 cm−1, 1183 cm−1 and 1369 cm−1 respectively, predicting strong C–H symmetric, in-plane bending and ring stretching vibrations in imidazole rings respectively. Moreover, the peak shift from 1253 cm−1 to 1269 cm−1 due to an in-plane benzene ring deformation in benzimidazole ring within selenium complex-II (C2). Similarly changes in peak position on the formation of C2 from L2, shift from 1283 cm−1 to 1293 cm−1, have been recognized as CH2 deformations in the aliphatic chain between two imidazole rings. A new shoulder band appearing at 1342 depicts C–H deformation in the benzene ring.
A strong peak at 1411 cm−1 is assigned to C![[double bond, length as m-dash]](https://www.rsc.org/images/entities/char_e001.gif) Se vibrations in C2 as its counterpart feature is absent in the mean Raman spectrum of L2 which provides us with strong evidence of selenium complex formation while phenyl ring presence in only the second pair of ligand–complex (L2–C2) a peak at 1590 cm−1 has been allotted to C–C–C stretching mode of vibration in phenyl ring of side chains which is absent in other first and third ligand–complex pairs (L1–C1 and L3–C3).
Se vibrations in C2 as its counterpart feature is absent in the mean Raman spectrum of L2 which provides us with strong evidence of selenium complex formation while phenyl ring presence in only the second pair of ligand–complex (L2–C2) a peak at 1590 cm−1 has been allotted to C–C–C stretching mode of vibration in phenyl ring of side chains which is absent in other first and third ligand–complex pairs (L1–C1 and L3–C3).
On the other hand, relatively reduced intensities in C2 at some positions such as at 311 cm−1 (ring wag with chain twisting), 434 cm−1 and 474 cm−1 (C–C deformation), 548 cm−1 (wag mode of NO2), 627 cm−1 (in-plane C–C–C deformation), 780 cm−1 (C–H out of plane bending), 887 cm−1 (C–H out-of-plane bending), 942 cm−1 (imidazole in plane bending), 1049 cm−1 (ring deformation in 5-member ring), 1144 cm−1 (C–H symmetric bending benzimidazole), 1318 cm−1 (C–H deformation of CH2), 1354 cm−1 (ring stretch imidazole), the shift of 1434 cm−1 to 1448 cm−1 (CH deformation in side chain) and 1613 cm−1 (C![[double bond, length as m-dash]](https://www.rsc.org/images/entities/char_e001.gif) C stretching mode) might be because, in contrast to alkyl side chains (electron-donating effect) in first and third pairs of ligands and complexes (L1–C1 and L3–C3), it has an electron-withdrawing group (nitrobenzene) as a side chain on benzimidazole rings which causes molecule towards somewhat reverse polar effect. Similarly, these Raman spectral features have been found in correspondence with the Raman spectral features calculated from DFT as in ESI as Fig. S2.†
C stretching mode) might be because, in contrast to alkyl side chains (electron-donating effect) in first and third pairs of ligands and complexes (L1–C1 and L3–C3), it has an electron-withdrawing group (nitrobenzene) as a side chain on benzimidazole rings which causes molecule towards somewhat reverse polar effect. Similarly, these Raman spectral features have been found in correspondence with the Raman spectral features calculated from DFT as in ESI as Fig. S2.†
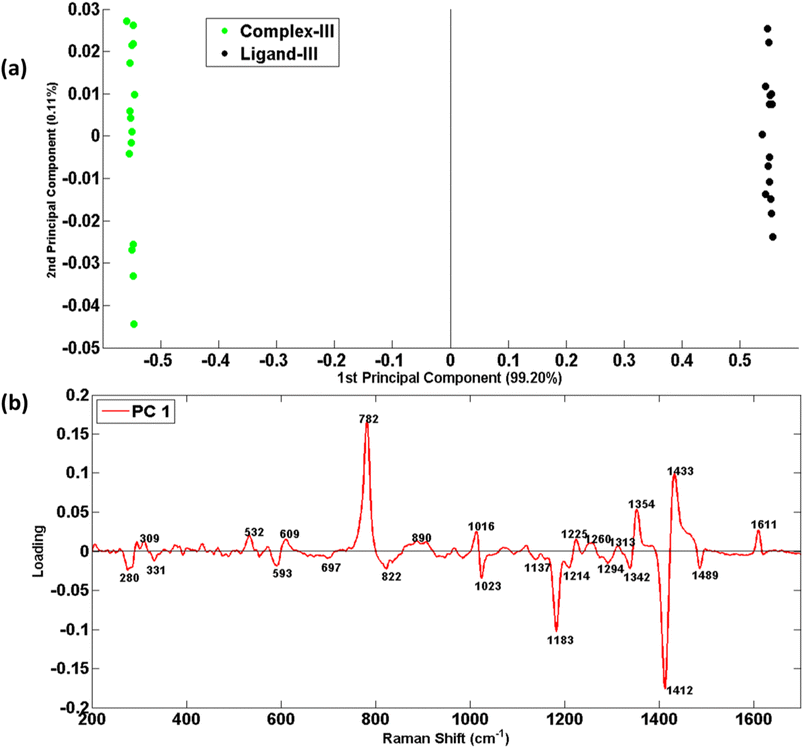
Fig. 5 represents distinct mean Raman spectral features which are characteristic to some specific chemical structural parts of ligand-III (L3) and complex-III (C3). For instance, Raman spectral features at 331 cm−1 (ring wag + chain deformations), 421 cm−1 (ring rotation 5-member ring), 499 cm−1 (C–N out of plane bending), 532 cm−1 (C–N–C deformation aliphatic chain), 572 cm−1 (ring deformation), 609 cm−1 (C–C–C deformation in-plane vibration mode of benzene), 713 cm−1 (C–N out of plane stretching five-membered ring), 782 cm−1 (C–H out of plane bending), 1016 cm−1 (C–C–C trigonal bending), 1183 cm−1 (in-plane C–H bending), 1225 cm−1 (C–N stretching), 1260 cm−1 (in-plane bz ring deformation), 1342 cm−1 (C–H deformation in bz ring), 1354 cm−1 (ring stretch imidazole) and 1611 cm−1 (C![[double bond, length as m-dash]](https://www.rsc.org/images/entities/char_e001.gif) C stretching mode) reflect the structural dissimilarities associated with benzimidazole.
C stretching mode) reflect the structural dissimilarities associated with benzimidazole.
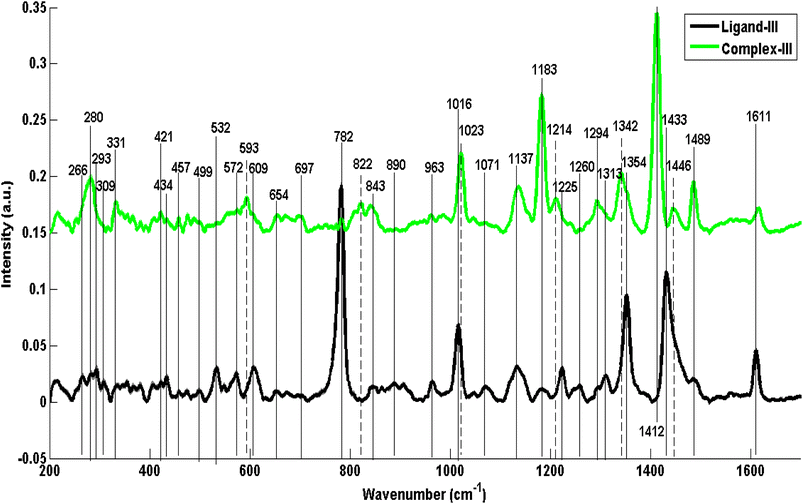 | ||
| Fig. 5 Comparison of mean Raman spectrum of ligand-III (L3) with mean Raman spectrum of complex-III (C3). | ||
The spectral features at 280 cm−1 and 293 cm−1 (CH2 rocking), 331 cm−1 (ring wagging and chain deformation), 713 cm−1 (C–N out of plane stretching in five-membered ring), 822 and 843 cm−1 (C–C stretching), 1137 cm−1 (C–C stretching, aliphatic vibration), 1183 cm−1 (in-plane C–H bending, benzimidazole), 1294 cm−1 (CH2 deformation, aliphatic chain) in C3 has been intensified. A similar justification goes for this increase in the intensity of some of the C3 Raman spectral features, as for the L1–C1 and L2–C2 ligand/complex pairs and can be associated with increased polarizability and decreased polarity in the complexes. Additional bands appear as well at 822 cm−1 (C–C stretching), 1342 cm−1 (C–H deformation in benzene ring) and 1412 cm−1 (C![[double bond, length as m-dash]](https://www.rsc.org/images/entities/char_e001.gif) Se vibrations) which are the most distinguished features indicating stable selenium compound formation from its own salt. Changes in peak positions (shifts in peak positions) have also been observed at 1016 to 1023 cm−1 (C–C–C trigonal bending benzimidazole) and 1225 to 1214 cm−1 (C–N stretching benzimidazole) with an increase in intensity from L3 to C3.
Se vibrations) which are the most distinguished features indicating stable selenium compound formation from its own salt. Changes in peak positions (shifts in peak positions) have also been observed at 1016 to 1023 cm−1 (C–C–C trigonal bending benzimidazole) and 1225 to 1214 cm−1 (C–N stretching benzimidazole) with an increase in intensity from L3 to C3.
Moreover, at some positions, in L3, few features disappeared or decreased in intensity in C3 as well, including 309 cm−1 (deformation vibrations of C–C–C), 532 cm−1 (C–N–C deformation aliphatic chain), 609 cm−1 (C–C–C deformation in-plane vibration mode of benzene), 782 cm−1 (C–H out of plane bending benzimidazole), 890 cm−1 (C–H out-of-plane bending), 1260 cm−1 (in-plane benzene ring deformation), 1313 cm−1 (C–H def of CH2), 1354 cm−1 (ring stretch imidazole) and shifting from 1433 to 1446 cm−1 (C–H deformation) and 1611 to 1617 cm−1 (C![[double bond, length as m-dash]](https://www.rsc.org/images/entities/char_e001.gif) C stretching mode benzimidazole). In the same way, these Raman spectral features have great correspondence with the Raman spectral features calculated from DFT as shown in ESI in Fig. S3.†
C stretching mode benzimidazole). In the same way, these Raman spectral features have great correspondence with the Raman spectral features calculated from DFT as shown in ESI in Fig. S3.†
3.3 Principal component analysis (PCA)
Fig. 6–8 are the PCA scatter and loading plots of PCA of Raman spectral data of ligands and their selenium complexes in which both samples have been differentiated in the form of two different clusters indicated by different colors. In each PCA scatter plot, the black color cluster on the positive axis of PC-1 represents the Raman spectral data set of ligand while the green color on the left side is associated with complexes. Mainly PCA is used to decrease the data dimensionality while keeping variability intact in the spectral data.Fig. 6(a) shows PCA scatter plot of Raman spectral data of ligand-I (black dots) and its respective selenium complex-I (green dots). Maximum variability in data has been explained by PC-1 explaining the dominant source of variability in the data which is 98.42% while PC-2 clarifies the rest of the variability. To explore the ability of PCA to distinguish ligand/salt samples from their respective complexes, PCA is used to identify and confirm the Raman spectral features associated with the differentiation of two different spectral data sets of ligands and their respective complex.
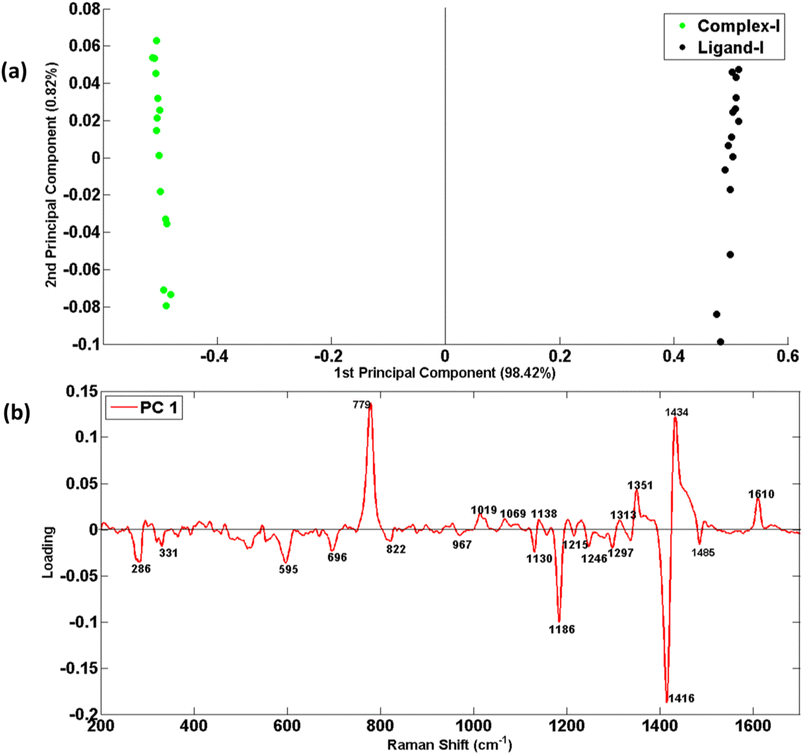 | ||
| Fig. 6 (a) PCA scatter plot of Raman spectral data of ligand-I (black dots) and its respective selenium complex-I (green dots), (b) PCA loadings of Raman spectral data set of ligand-I and complex-I. | ||
Fig. 7(a) shows PCA scatter plot of Raman spectral data of ligand-II (black dots) and its respective selenium complex-II (green dots). In this case, the PC-1 predicts 98.88% variability and only 0.14% variability has been explained by PC-2.
Fig. 8(a) shows the PCA Scatter plot of Raman spectral data sets of ligand-III (black dots) and its respective selenium complex-III (green dots). PC-1 explains a maximum of 99.20% variability which indicates clear differentiation between the Raman spectral data sets of ligand-III and its respective complex.
As scatter plot has provided a chromatic display of two sets of data in two different clusters, but it is unable to provide reasons for such variability in data regarding distinct features. To understand this basis of discrimination in the PCA scatter plot, the loadings of PC-1 against wavenumber (cm−1) have been presented in Fig. 6(b), 7(b) and 8(b), for three different ligands and respective complexes, respectively. The reason for taking PC-1 for loadings is because it has provided maximum variability.
Fig. 6(b) presents the loadings of the PCA of Raman Spectral data sets of ligand-I (L1) compared with the complex-I (C1). The PC loadings are the dimensions of chemical variations, splitting different spectral groups of RS data along their variability. The positive loadings from the top side of the splitting line at zero are associated with the RS data of the ligands which have clusters on the right side in PC-1 of the scatter plot while the negative loadings are associated with the corresponding selenium complexes clustered at the negative side of PC-1. The loading plot expresses the only prominent features of ligands that are distinct from that of complexes. Such spectral loadings re-confirming the structural differences between ligands and their respective complexes as already have been discussed in mean Raman spectra. These differences indicate some kind of structural changes in complexes from their preliminary ligands and hence can be taken as Raman spectral markers of stable complex formation.
The dominant RS features of C1 that appeared in the PCA include 286 cm−1 (CH2 rocking), 331 cm−1 (imidazole ring wagging accompanied with the attached chains deformation), 713 cm−1 (C–N out of plane stretching vibrations of imidazole rings), 822 cm−1, 1130 cm−1, 1215 cm−1 and 1246 cm−1 (all probably associated with C–C stretching in aliphatic chains on both sides of imidazole rings), 967 cm−1 (CH3 wagging), 1186 cm−1 (C–H in-plane bending of benzimidazole ring) and 1297 cm−1 (CH2 deformation in the aliphatic chain). Another and highly differentiating feature at 1416 cm−1 has been attributed to C![[double bond, length as m-dash]](https://www.rsc.org/images/entities/char_e001.gif) Se vibrations because of its only presence in a complex structure. In contrast, the most prominent positive loadings associated with ligand-I appear at 779 cm−1 (C–H out of plane bending in benzimidazole), 1019 cm−1 (C–C–C trigonal bending inbenzimidazole), 1138 cm−1 (C–C stretching), 1313 cm−1 and 1434 cm−1 (C–H def), 1351 cm−1 (ring stretch in imidazole) and 1610 cm−1 (C
Se vibrations because of its only presence in a complex structure. In contrast, the most prominent positive loadings associated with ligand-I appear at 779 cm−1 (C–H out of plane bending in benzimidazole), 1019 cm−1 (C–C–C trigonal bending inbenzimidazole), 1138 cm−1 (C–C stretching), 1313 cm−1 and 1434 cm−1 (C–H def), 1351 cm−1 (ring stretch in imidazole) and 1610 cm−1 (C![[double bond, length as m-dash]](https://www.rsc.org/images/entities/char_e001.gif) C stretching).
C stretching).
The PCA loadings of Raman spectral data sets of L2–C2 and L3–C3 pairs of ligands and complexes are shown in Fig. 7(b) and 8(b)) which reflect the same reasons of differentiation as has already been elaborated in the above section in the discussion related to Fig. 4 and 5 for ligand-II, &III and their complexes respectively. These unique features in Fig. 7(b) at 311, 345, 434, 474, 548, 627, 680, 780, 887, 942, 1049, 1144, 1318, 1354, 1434 and 1613 cm−1 while in Fig. 8(b) at 309, 532, 609, 782, 890, 1016, 1225, 1260, 1313, 1354, 1433 and 1611 cm−1 act as a fingerprint for a specific structural elucidation of L2 and L3. Similarly visible features at 281, 370, 595, 651, 750, 1014, 1156, 1183, 1269, 1293, 1342, 1369, 1411, 1485, and 1590 cm−1 in Fig. 7(b) and dominant features at 280, 331, 593, 713, 822, 1023, 1137, 1183, 11![[thin space (1/6-em)]](https://www.rsc.org/images/entities/char_2009.gif) 214, 1294, 1342, 1412 and 1489 cm−1 in Fig. 8(b) belonging to negative loadings enable description of stable metal–ligand bond which means complex formation and these results have also been found compatible with mean Raman spectra results.
214, 1294, 1342, 1412 and 1489 cm−1 in Fig. 8(b) belonging to negative loadings enable description of stable metal–ligand bond which means complex formation and these results have also been found compatible with mean Raman spectra results.
4. Conclusions
Raman spectroscopy combined with DFT and multivariate data analysis methods is found helpful for the characterization of three different ligands and their respective selenium complexes. The Raman spectral features have been found for each of these ligands and their selenium complexes and it is in ferred that the polarizability of benzimidazolium rings has been increased after complex formation with selenium. This has been shown by the enhanced intensity of the associated Raman peaks, therefore, confirming the formation of newly formed bonds. The unique spectral features have been observed in Raman spectra of complexes I, II and III at 1416, 1411, 1412 cm−1 respectively. As very limited Raman spectroscopic data is available for benzimidazolium salts and their selenium complexes in the literature thus depending upon observations, these bands have been estimated at C![[double bond, length as m-dash]](https://www.rsc.org/images/entities/char_e001.gif) Se. Moreover, complex formation is also indicated by the identification of several new peaks in the spectra of these complexes and these Raman bands were absent in spectra of the ligands. This indicates that the Raman scattering technique with the support of DFT calculations reveals a clear indication of complex formation.
Se. Moreover, complex formation is also indicated by the identification of several new peaks in the spectra of these complexes and these Raman bands were absent in spectra of the ligands. This indicates that the Raman scattering technique with the support of DFT calculations reveals a clear indication of complex formation.
Conflicts of interest
There are no conflicts of interest to declare.Acknowledgements
M. Imran expresses his appreciation to the Deanship of Scientific Research at King Khalid University Saudi Arabia for funding this work through research groups program under grant number R.G.P. 2/522/44.References
- J. C. Garrison, C. A. Tessier and W. J. Youngs, J. Org. Chem., 2005, 690, 6008–6020 CrossRef CAS.
- K. B. Choo, S. M. Lee, W. L. Lee and Y. L. Cheow, J. Org. Chem., 2019, 898, 120868 CrossRef CAS.
- C. Y.-S. Chung, S.-K. Fung, K.-C. Tong, P.-K. Wan, C.-N. Lok, Y. Huang, T. Chen and C.-M. Che, Chem. Sci., 2017, 8, 1942–1953 RSC.
- R. Fraser, C. G. Van Sittert, P. H. Van Rooyen and M. Landman, J. Org. Chem., 2017, 835, 60–69 CrossRef CAS.
- A. Kamal, M. Nazari, M. Yaseen, M. A. Iqbal, M. B. K. Ahamed, A. S. A. Majid and H. N. Bhatti, Bioorg. Chem., 2019, 90, 103042 CrossRef CAS.
- T. Klapec, M. L. Mandić, J. Grgić, L. Primorac, A. Perl and V. Krstanović, Food Chem., 2004, 85, 445–452 CrossRef CAS.
- E. E. Battin, N. R. Perron and J. L. Brumaghim, Inorg. Chem., 2006, 45, 499–501 CrossRef CAS.
- M. Elsherbini, W. S. Hamama and H. H. Zoorob, Coord. Chem. Rev., 2016, 312, 149–177 CrossRef CAS.
- M. A. Iqbal, R. A. Haque, S. F. Nasri, A. A. Majid, M. B. K. Ahamed, E. Farsi and T. Fatima, Chem. Cent. J., 2013, 7, 27 CrossRef.
- S. Y. Hussaini, R. A. Haque, P. O. Asekunowo, A. A. Majid, M. T. Agha and M. R. Razali, J. Org. Chem., 2017, 840, 56–62 CrossRef CAS.
- M. N. Ashraf, M. I. Majeed, H. Nawaz, M. A. Iqbal, J. Iqbal, N. Iqbal, A. Hasan, N. Rashid, M. Abubakar and M. Z. Nawaz, Spectrochim. Acta, Part A, 2022, 270, 120823 CrossRef CAS.
- S. Mudi, M. Usman and S. Ibrahim, Am. J. Chem. Appl., 2015, 2, 151–158 CAS.
- W. K. Smothers and M. S. Wrighton, J. Am. Chem. Soc., 1983, 105, 1067–1069 CrossRef CAS.
- M. Sayyed, A. H. Abdalsalam, M. M. Taki, M. H. A. Mhareb, B. Alim, A. Baltakesmez and E. Şakar, Radiat. Phys. Chem., 2020, 172, 108852 CrossRef CAS.
- Analytical applications of Raman spectroscopy, ed. M. J. Pelletier, Oxford: Blackwell science, 1999, vol. 427 Search PubMed.
- C. Zong, M. Xu, L.-J. Xu, T. Wei, X. Ma, X.-S. Zheng, R. Hu and B. Ren, Chem. Rev., 2018, 118, 4946–4980 CrossRef CAS PubMed.
- J. R. Ferraro, Introductory Raman Spectroscopy, Elsevier, 2003 Search PubMed.
- A. Bankapur, R. S. Krishnamurthy, E. Zachariah, C. Santhosh, B. Chougule, B. Praveen, M. Valiathan and D. Mathur, PLoS One, 2012, 7, e35075 CrossRef CAS.
- J. Singh, Res. Chem. Intermed., 2020, 46, 2457–2479 CrossRef CAS.
- C. M. Zoltowski, R. F. Lalisse, C. M. Hadad and Z. D. Schultz, J. Phys. Chem., 2021, 125, 27596–27606 CAS.
- V. Kumar, J. Teotia and A. K. Yadav, Mater. Today: Proc., 2022, 62, 7137–7141 CAS.
- S. Mohan, N. Sundaraganesan and J. Mink, Spectrochim. Acta, Part A, 1991, 47, 1111–1115 CrossRef.
- S. Ali, A. Riaz, H. Nawaz, M. I. Majeed, M. A. Iqbal, H. N. Bhatti, N. Rashid, M. Kashif, M. Tahir and S. Nasir, Spectrochim. Acta, Part A, 2020, 232, 118162 CrossRef CAS PubMed.
- Y.-J. Mo, Y.-C. Li, J.-G. Zhao, K.-A. Fen, C.-Y. Xiao and M.-X. Wan, J. Magn. Magn. Mater., 2000, 213, 278–280 CrossRef CAS.
- R. W. Berg, Monatsh. Chem., 2007, 138, 1045–1075 CrossRef CAS.
- N. Sheppard, J. Chem. Phys., 1948, 16, 690–697 CrossRef CAS.
- G. Wang, A. Harrison, X. Li, G. Whittaker, J. Shi, X. Wang, H. Yang, P. Cao and Z. Zhang, J. Raman Spectrosc., 2004, 35, 1016–1022 CrossRef CAS.
- S. Ali, A. Riaz, M. I. Majeed, M. A. Iqbal, H. N. Bhatti, N. Rashid, M. Kashif, M. Tahir, S. Nasir and S. Farooq, Spectrochim. Acta, Part A, 2020, 228, 117851 CrossRef CAS.
- S. W. Han and K. Kim, J. Colloid Interface Sci., 2001, 240, 492–497 CrossRef CAS.
- D. Lin-Vien, N. B. Colthup, W. G. Fateley and J. G. Grasselli, The Handbook of Infrared and Raman Characteristic Frequencies of Organic Molecules, Elsevier, 1991 Search PubMed.
- V. Renganayaki and S. Srinivasan, Int. J. PharmTech Res., 2011, 3, 1350–1358 CAS.
- C. J. Strachan, T. Rades, K. C. Gordon and J. Rantanen, J. Pharm. Pharmacol., 2007, 59, 179–192 CrossRef CAS PubMed.
- X. Zhang, Q. Zhou, Y. Huang, Z. Li and Z. Zhang, Sensors, 2011, 11, 11510–11515 CrossRef CAS.
- C. Muthuselvi, S. Pandiarajan, B. Ravikumar, S. Athimoolam and R. Krishnakumar, Asian J. Appl. Sci., 2018, 11, 29–37 CrossRef CAS.
- K. Helios, A. Pietraszko, W. Zierkiewicz, H. Wójtowicz and D. Michalska, Polyhedron, 2011, 30, 2466–2472 CrossRef CAS.
- M. Morsy, M. Al-Khaldi and A. Suwaiyan, J. Phys. Chem. A, 2002, 106, 9196–9203 CrossRef CAS.
- A. Suwaiyan, R. Zwarich and N. Baig, J. Raman Spectrosc., 1990, 21, 243–249 CrossRef CAS.
- Z. Arp, D. Autrey, J. Laane, S. A. Overman and G. J. Thomas, Biochem, 2001, 40, 2522–2529 CrossRef CAS PubMed.
- N. Sundaraganesan, S. Ilakiamani, P. Subramani and B. D. Joshua, Spectrochim. Acta, Part A, 2007, 67, 628–635 CrossRef CAS PubMed.
- R. Kengne-Momo, P. Daniel, F. Lagarde, Y. Jeyachandran, J. Pilard, M. Durand-Thouand and G. Thouand, Int. J. Spectrosc., 2012, 2012, 1–7 CrossRef.
- C. J. Orendorff, M. W. Ducey Jr and J. E. Pemberton, J. Phys. Chem. A, 2002, 106, 6991–6998 CrossRef CAS.
- S. Salama and T. G. Spiro, J. Am. Chem. Soc., 1978, 100, 1105–1111 CrossRef CAS.
- P. Lasch and D. Naumann, Mol. Cell. Biol., 1998, 44, 189–202 CAS.
- R. Wojnarowska, J. Polit, D. Broda, M. Gonchar and E. Sheregii, Appl. Phys. Lett., 2015, 106, 103701 CrossRef.
- T. Mahmood, H. Nawaz, A. Ditta, M. Majeed, M. Hanif, N. Rashid, H. Bhatti, H. Nargis, M. Saleem and F. Bonnier, Spectrochim. Acta, Part A, 2018, 200, 136–142 CrossRef CAS PubMed.
- U. Anthoni, L. Henrisksen, P. Nielsen, G. Borch and P. Klaboe, Spectrochim. Acta, Part A, 1974, 30, 1351–1364 CrossRef.
- K. Czamara, K. Majzner, M. Z. Pacia, K. Kochan, A. Kaczor and M. Baranska, J. Raman Spectrosc., 2015, 46, 4–20 CrossRef CAS.
- N. Stone, C. Kendall, J. Smith, P. Crow and H. Barr, Faraday Discuss., 2004, 126, 141–157 RSC.
Footnotes |
| † Electronic supplementary information (ESI) available. See DOI: https://doi.org/10.1039/d3ra04931k |
| ‡ First two authors have equal contribution. |
| This journal is © The Royal Society of Chemistry 2023 |

