 Open Access Article
Performance degradation study of NiCo2O4-based asymmetric supercapacitors
Guanlun Guo *a,
Yilong Meia,
Xu Chena,
Jun Liub and
Wentao Liuc
aHubei Key Laboratory of Advanced Technology for Automotive Components, Hubei Research Center for New Energy & Intelligent Connected Vehicle, University of Technology, Wuhan 430070, China. E-mail: glguo@whut.edu.cn
bWuhan Huaxia University of Technology, Wuhan 430223, China
cShandong Academy of Pharmaceutical Science, Jinan 250101, PR China
First published on 23rd August 2023
Abstract
The performance of NiCo2O4//GO asymmetric supercapacitors was found to decline after many tests. It was found that the performance of the GO electrode was almost unchanged, while the performance of the NiCo2O4 electrode declined rapidly. Therefore, porous spherical NiCo2O4 nanoparticles were synthesized via a simple hydrothermal method. A NiCo2O4//GO asymmetric supercapacitor was made, which can be charged and discharged 3000 times in the current density of 10 A g−1. The surface morphology, crystal structure and elemental composition were characterized by X-ray diffraction analysis, scanning electron microscopy and X-ray photoelectron spectroscopy. By comparing the surface morphology, crystal structure and elemental composition of the NiCo2O4 electrode before and after the cycle, it was found that the performance of NiCo2O4 electrode declines rapidly after the cycle due to the formation of new substances and the destruction of the crystal structure of NiCo2O4 electrode. Therefore, maintaining the stability of the crystal structure of the electrode material is an important means to ensure the stability of the performance of the supercapacitor. It provides a meaningful strategy for studying the degradation of supercapacitor electrode materials.
1. Introduction
The supercapacitor is a new type of energy storage equipment with electrochemical performance between lithium-ion batteries and traditional capacitors. It has the characteristics of high power density, high charge–discharge speed, wide operating temperature limit, excellent cycle stability and safety, etc. It is used as an alternative or supplement to batteries on the occasions of high power output or fast energy collection, such as electric vehicle composite energy storage systems, rail transit, wind power and photovoltaic power generation. The high power density of supercapacitors is mainly due to the fact that the energy storage process of supercapacitors takes place on the surface or near the surface of electrode materials, and the charge storage and release are very quickly. Unlike lithium-ion batteries, during the energy storage process, electrolyte ions will go deep into the lattice and cause crystal phase transition. The charge storage and release process is limited by the diffusion of ions in the lattice and the process is slow. The fast energy storage process also endows the supercapacitor with high charge–discharge efficiency and long cycle life.1–5The electrode material is the core component of the supercapacitor, which largely determines the energy storage mechanism and electrochemical performance of the supercapacitor. In recent years, pseudocapacitors have been widely studied because of their higher energy density compared with double-layer capacitors.6–11 The main application value of supercapacitors is their high power characteristics, but they also need a high enough energy density to store more energy for output. Transition metal oxides are one of the main electrode materials for pseudocapacitors, which can be stored by reversible redox reactions on or near the surface of active materials.12
As a kind of spinel oxide, NiCo2O4 has great potential as a pseudocapacitor electrode material. This strong crystal structure makes the redox reaction process of Ni2+/Ni3+, Co2+/Co3+ and Co3+/Co4+ highly reversible, which keeps the material stable and improves the cycle stability. Sun et al.13 prepared nanosheet self-assembled spinel NiMn2O4 microspheres grown directly on three-dimensional nickel foam through a simple microwave-assisted hydrothermal process. Taking 6 M KOH as electrolyte, the specific capacitance of 768.9 F g−1 at 1 A g−1 current density is shown. Bao et al.14 directly synthesized mesoporous ZnCo2O4 nanosheet arrays with strong adhesion on highly conductive nickel foam by hydrothermal calcination, and then directly used them as integrated electrodes. Using 2 M KOH as electrolyte, the specific capacitance of 2468 F g−1 was obtained at 5 A g−1 current density. At the current density of 30 A g−1, the capacitor retention rate is 96.3% after 1500 cycles.
To study the reason of performance decline of NiCo2O4//GO asymmetric supercapacitor. In this paper, NiCo2O4 nanoparticles were synthesized by hydrothermal method. The prepared NiCo2O4 nanoparticles were used as the electrode active material, and nickel foam was used as the collecting system to form the electrode sheet. In the three-electrode system, platinum wire was used as the counter electrode, Hg/HgO electrode was the reference electrode, and 6 M KOH solution was used as the electrolyte to form a half cell. The electrochemical performance was measured by cyclic voltammetry test, constant current charge–discharge test, electrochemical impedance test and cyclic stability test. NiCo2O4//GO asymmetric supercapacitors were fabricated with NiCo2O4 cathode electrode and GO anode electrode, which were charged and discharged for 3000 times in a current density of 10 A g−1. The degradation of electrode performance after 3000 cycles is sufficient to study the mechanism of the degradation. For the recycled material, ethanol is used as a dispersant to ultrasonic treatment the electrode sheet for 10 min to obtain recycled particles, which can eliminate the influence of binder. The surface morphology, crystal structure and elemental composition of the electrode active material recovered from the asymmetric supercapacitor after cycling were characterized in detail, and the decay mechanism was studied by comparing with that of the raw material.
2. Experimental section
2.1 Preparation and characterization of NiCo2O4 powders
NiCo2O4 nanoparticles were prepared by hydrothermal method, and urea (CO(NH2)2) was used as the reducing and precipitating agent. Firstly, Ni(NO3)2–6H2O, Co(NO3)2–6H2O and CH4N2O were weighed according to 1![[thin space (1/6-em)]](https://www.rsc.org/images/entities/char_2009.gif) :
:![[thin space (1/6-em)]](https://www.rsc.org/images/entities/char_2009.gif) 2
2![[thin space (1/6-em)]](https://www.rsc.org/images/entities/char_2009.gif) :
:![[thin space (1/6-em)]](https://www.rsc.org/images/entities/char_2009.gif) 6, and they were dissolved and evenly mixed in 70 mL of 1
6, and they were dissolved and evenly mixed in 70 mL of 1![[thin space (1/6-em)]](https://www.rsc.org/images/entities/char_2009.gif) :
:![[thin space (1/6-em)]](https://www.rsc.org/images/entities/char_2009.gif) 1 mixed solvent of deionized water and ethanol using a magnetic stirrer. Then the reactant mixture was poured into a PTFE-lined autoclave, and the reactor was put into an electric blast drying oven for hydrothermal reaction with a setting temperature of 120 °C for 8 h. Then the precipitate was obtained by centrifugation using a centrifuge, washed three times each with ethanol and deionized water cross, and then the precipitate was dried using a vacuum drying oven with a setting temperature of 80 °C for 8 h. After that, the dried powdered precipitate was transferred to a crucible and calcined at a medium temperature of 300 °C for 3 h. Finally, the calcined powder was ground and dispersed in a mortar to obtain black powdered NiCo2O4 nanoparticles.
1 mixed solvent of deionized water and ethanol using a magnetic stirrer. Then the reactant mixture was poured into a PTFE-lined autoclave, and the reactor was put into an electric blast drying oven for hydrothermal reaction with a setting temperature of 120 °C for 8 h. Then the precipitate was obtained by centrifugation using a centrifuge, washed three times each with ethanol and deionized water cross, and then the precipitate was dried using a vacuum drying oven with a setting temperature of 80 °C for 8 h. After that, the dried powdered precipitate was transferred to a crucible and calcined at a medium temperature of 300 °C for 3 h. Finally, the calcined powder was ground and dispersed in a mortar to obtain black powdered NiCo2O4 nanoparticles.
2.2 Electrochemical measurements
Electrochemical measurements were performed on NiCo2O4 electrodes and NiCo2O4-based asymmetric supercapacitor in a three-electrode system and a two-electrode system, respectively, to investigate the factors and mechanisms of degradation. Using treated nickel foam as the substrate, polyvinylidene fluoride as the binder and acetylene black as the conductive agent, the active material, binder and conductive agent are weighed in the mass ratio of 8![[thin space (1/6-em)]](https://www.rsc.org/images/entities/char_2009.gif) :
:![[thin space (1/6-em)]](https://www.rsc.org/images/entities/char_2009.gif) 1
1![[thin space (1/6-em)]](https://www.rsc.org/images/entities/char_2009.gif) :
:![[thin space (1/6-em)]](https://www.rsc.org/images/entities/char_2009.gif) 1, and the three are ground and mixed evenly using a mortar and pestle, and an appropriate amount of 1-methyl-2-pyrrolidone is added, and the grinding is continued to dissolve polyvinylidene fluoride completely. The active material slurry is evenly coated on the surface of the dry fluid collection. After that, it is dried by vacuum drying oven and finally the mixture is pasted on the nickel foam by pressing device to form the working electrode. In the three-electrode system, the electrode for preparing NiCo2O4 is used as the working electrode, the platinum wire is used as the counter electrode, and the Hg/HgO electrode is used as the reference electrode. In the two-electrode system, NiCo2O4 electrode and GO electrode were prepared by the same preparation method as positive and negative electrode sheets, and 6 M KOH solution was used as electrolyte to form a full cell for electrochemical performance testing. Three electrochemical tests namely cyclic voltammetry (CV) test, galvanostatic charge–discharge (GCD) tests and cyclic charge–discharge test, were carried out utilizing an electrochemical workstation CS150 (Corrtest Co. Ltd, Wuhan). The specific capacitance was calculated from GCD curves according to the following equation.
1, and the three are ground and mixed evenly using a mortar and pestle, and an appropriate amount of 1-methyl-2-pyrrolidone is added, and the grinding is continued to dissolve polyvinylidene fluoride completely. The active material slurry is evenly coated on the surface of the dry fluid collection. After that, it is dried by vacuum drying oven and finally the mixture is pasted on the nickel foam by pressing device to form the working electrode. In the three-electrode system, the electrode for preparing NiCo2O4 is used as the working electrode, the platinum wire is used as the counter electrode, and the Hg/HgO electrode is used as the reference electrode. In the two-electrode system, NiCo2O4 electrode and GO electrode were prepared by the same preparation method as positive and negative electrode sheets, and 6 M KOH solution was used as electrolyte to form a full cell for electrochemical performance testing. Three electrochemical tests namely cyclic voltammetry (CV) test, galvanostatic charge–discharge (GCD) tests and cyclic charge–discharge test, were carried out utilizing an electrochemical workstation CS150 (Corrtest Co. Ltd, Wuhan). The specific capacitance was calculated from GCD curves according to the following equation.
 | (1) |
3. Results and discussion
3.1 Phase composition, microstructure and surface chemistry
Fig. 1(a) shows the XRD patterns of prepared NiCo2O4 samples. Comparison with XRD standard card PDF#73-1702 shows that there are distinct diffraction peaks at 2θ values of 18.9°, 31.2°, 36.7°, 38.4°, 44.6°, 55.4°, 59.1°, 64.9°, 77.0°, corresponding to (1 1 1), (2 2 0), (3 1 1), (2 2 2), (4 0 0), (4 2 2), (5 1 1), (4 4 0), and (5 3 3) crystal surfaces of NiCo2O4. No other obvious non-NiCo2O4 diffraction peaks were observed, and the unique crystal phase of NiCo2O4 was observed, indicating that the prepared material is high purity NiCo2O4.According to the standard card, the crystal structure of the prepared NiCo2O4 can be determined as a cubic crystal system with Fd![[3 with combining macron]](https://www.rsc.org/images/entities/char_0033_0304.gif) m space group. The nanoparticles consist of a large number of grains aggregated, where the grains are bounded microcrystals composed of a large number of crystals. By XRD tests, the grain size of nanomaterials (adapted to the range 1–100 nm) can be calculated using the diffraction peak half-height width based on the Scheele formula, which is as follows:
m space group. The nanoparticles consist of a large number of grains aggregated, where the grains are bounded microcrystals composed of a large number of crystals. By XRD tests, the grain size of nanomaterials (adapted to the range 1–100 nm) can be calculated using the diffraction peak half-height width based on the Scheele formula, which is as follows:
D = Kλ/(β![[thin space (1/6-em)]](https://www.rsc.org/images/entities/char_2009.gif) cos cos![[thin space (1/6-em)]](https://www.rsc.org/images/entities/char_2009.gif) θ) θ)
| (2) |
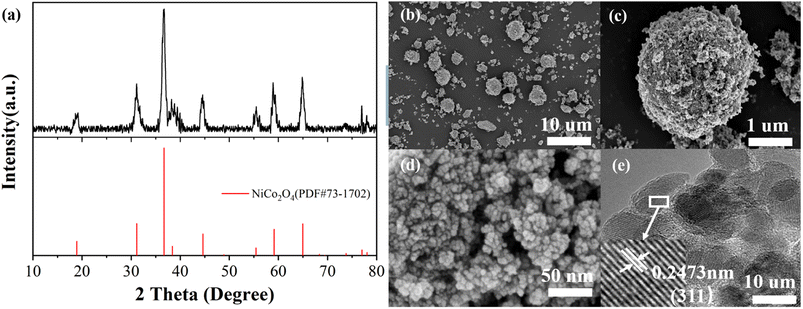 | ||
| Fig. 1 (a) XRD patterns of NiCo2O4 (b)–(d) SEM image at 10 μm, 1 μm, 50 nm, respectively (e) HRTEM image. | ||
The surface morphology of NiCo2O4 nanoparticles was analysed by scanning electron microscopy. Fig. 1(b) shows the material morphology at a scale of 10 μm. It can be seen that the NiCo2O4 synthesized by hydrothermal method mainly presents spherical granular agglomerates with poor homogeneity and very wide particle size distribution, with larger agglomerates of 7–8 μm in diameter and nanoscale agglomerates showing light spots. Fig. 1(c) shows the surface morphology of the agglomerates with a diameter of 7 μm at a scale of 1 μm, and the surface of the agglomerates is very rough. Fig. 1(d) shows a further enlargement of the surface morphology of the agglomerates at a scale of 50 nm, and the accumulation of small grains in the figure shows that the agglomerates consist of a large number of grains with a diameter of about 10 nm.
The black areas indicate surface gaps that increase the contact area of the electrolyte. Fig. 1(e) show that the typical lattice spacing of 0.2473 nm corresponds to the (3 1 1) crystal plane of the cubic phase NiCo2O4.
The elemental compositions and valence states of NiCo2O4 nanoparticles were analysed by X-ray photoelectron spectroscopy. Fig. 2(a) shows the full XPS spectrum of NiCo2O4 nanoparticles, indicating that only Ni, Co, O and C elements exist in the test sample, and C is the calibration element. Fig. 2(b) shows the Ni 2p spectrum, with two hybrid orbital peaks (2p1/2 and 2p3/2) and two satellite peaks. The peaks of 2p1/2, 2p3/2, Ni2+ and Ni3+ was shown at the Table 1. Fig. 2(c) shows the Co 2p spectrum, which also has two hybrid orbital peaks of 2p1/2 and 2p3/2 and two satellite peaks. Table 2 show the peaks of 2p1/2, 2p3/2, Co2+ and Co3+. Fig. 2(d) shows the O 1s diagram, consisting of OI, OII, and OIII. OI represents the metal–oxygen bond (O2−) with a peak position of 529.9 eV. OII represents the low coordination oxygen ion (O22−/O−) with a peak of 531.2 eV. OIII represents the oxygen in water or OH− physically/chemically adsorbed on the material surface, with a peak of 532.5 eV.15–18
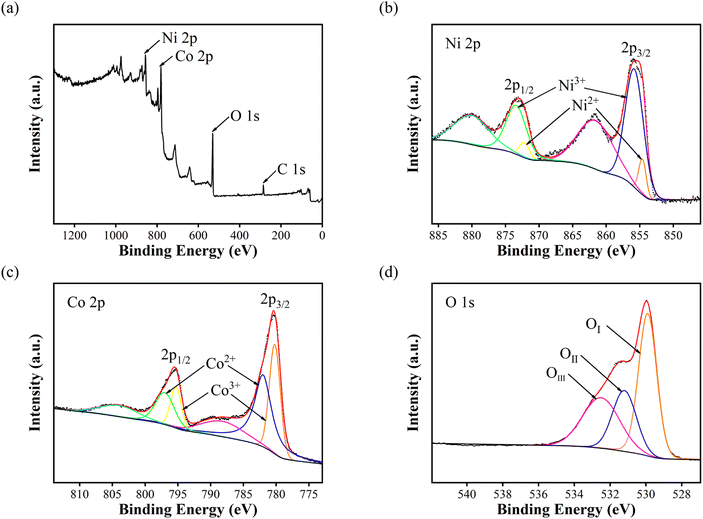 | ||
| Fig. 2 X-ray photoelectron spectra of NiCo2O4 nanoparticles: (a) survey spectrum (b) Ni 2p (c) Co 2p and (d) O 1s. | ||
| Ni2+ | Ni3+ | Ratio of content Ni2+/Ni3+ | ||
|---|---|---|---|---|
| Binding energy (eV) | Area of peaks (%) | Binding energy (eV) | Area of peaks (%) | |
| 854.6 | 11.0 | 855.8 | 89.0 | 0.12 |
| Co2+ | Co3+ | Ratio of content Co2+/Co3+ | ||
|---|---|---|---|---|
| Binding energy (eV) | Area of peaks (%) | Binding energy (eV) | Area of peaks (%) | |
| 782.0 | 60.0 | 780.2 | 40.0 | 1.50 |
Under the condition of a certain total amount of elements, the higher the content of +2-valent elements, the higher the content of oxygen vacancy, the more reactive sites, and the stronger the charge storage ability.19 According to Fig. 2 and Tables 1, 2, since the Ni/Co value in NiCo2O4 is 0.5, the total ratio of +2-valent elements to +3-valent elements is 0.78, which is higher than the theoretical ratio of 0.5 for spinel structure +2-valent elements to +3-valent elements. The prepared NiCo2O4 nanoparticles have higher content of +2-valent elements than intact crystals, and may have more active sites.
3.2 Electrochemical characterizations
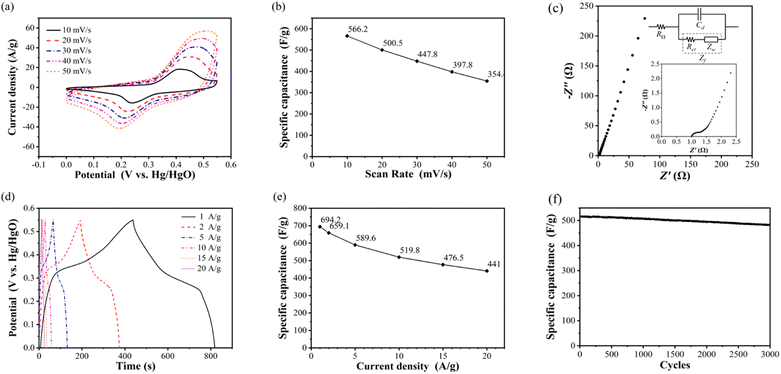
The behaviour of supercapacitor during charging and discharging of NiCo2O4 electrode was analyzed by cyclic voltammetry. Fig. 3(a) show the cyclic voltammetry curve of NiCo2O4 electrode at scanning rate of 10–50 mV s−1 under potential window of 0–0.55 V. It can be seen that the curve has an obvious redox peak, indicating the energy storage characteristics of the pseudocapacitor of NiCo2O4 electrode material. The redox reaction equation is as follows:20,21| NiCo2O4 + OH− + H2O ↔ NiOOH + 2CoOOH + e− | (3) |
| CoOOH + OH− ↔ CoO2 + H2O + e− | (4) |
There is only one pair of redox peaks in the curve. It is considered that the redox reaction potential of Ni and Co in the charging and discharging process is roughly equal, so the total reaction formula is as follows:
| NiCo2O4 + 3OH− ↔ NiOOH + 2CoO2 + H2O + 3e− | (5) |
At the scanning rate of 10 mV s−1, the oxidation peak and reduction peak are 0.412 V and 0.241 V, respectively. The current density of oxidation peak is 16.1 A g−1, and that of reduction peak is 9.5 A g−1. With the increase of scanning rate, the oxidation peaks potential increases, the reduction peak potential decreases, and the peak current density also increases. When the scanning rate increases to 50 mV s−1, the oxidation peak and reduction peak are located at 0.512 V and 0.193 V, respectively. The current density of oxidation peak is 41.2 A g−1, and that of reduction peak is 15.1 A g−1.
According to the calculation, the specific capacitance of NiCo2O4 electrode at the scanning rate of 10, 20, 30, 40 and 50 mV s−1 is 566.2, 500.5, 447.8, 397.8 and 354.4 F g−1, respectively, as shown in Fig. 3(b). With the increase of the scanning rate, the specific capacitance of the electrode decreases, which indicates that the electrode material of the supercapacitor exhibits the multiplier performance similar to that of the battery, that is, with the increase of the charging and discharging current, the amount of electricity that can be stored and discharged decreases.
Fig. 3(c) shows the impedance spectrum of NiCo2O4 electrode measured by sinusoidal AC voltage signal with amplitude of 5 mV in the frequency range of 10−2 to 105. The intersection of the impedance spectrum with the real axis (horizontal axis) is the internal resistance value, which is 1.0 Ω. It can be seen from the full-frequency impedance spectrum that the internal resistance and charge transfer resistance of NiCo2O4 electrode are very small, and the impedance is mainly determined by the Warburg impedance in the process of material transfer.22,23
The specific capacitance and rate performance of NiCo2O4 electrode were analysed by constant current charge–discharge test. Fig. 3(d) shows the constant current charge–discharge curves of NiCo2O4 electrode measured at 1, 2, 5, 10, 15, 20 A g−1 at the potential window of 0–0.55 V. The curve of charging process is observed to rise rapidly at first, then slowly, and then quickly again. The curve of discharge process is the shape of rapid decline, then slow decline, and then rapid decline again. This is because the charging and discharging process of NiCo2O4 electrode is controlled by two kinds of energy storage principles: double layer capacitor and pseudocapacitor. With the increase of current density, both the electrostatic adsorption and desorption rate of the double electric layer and the redox reaction rate of the pseudocapacitor increase, and the duration of the rapid and slow change stages of the potential decreases simultaneously, as well as the charge–discharge time. Fig. 3(e) shows the discharge specific capacitance of NiCo2O4 electrode calculated according to eqn (6) at the current density of 1, 2, 5, 10, 15 and 20 A g−1, which are 694.2, 659.1, 589.6, 519.8, 476.5 and 441.0 F g−1 respectively. The curve reflects the magnification performance of NiCo2O4 electrode. When the current density increases from 1 A g−1 to 20 A g−1, the retention rate of specific capacitance reaches 63.5%, and the decline trend of specific capacitance slows down with the increase of current density. Compared to porous spherical nanostructures NiCo2O4,24 the prepared NiCo2O4 nanoparticles have better specific capacitance and rate performance.
 | (6) |
Cyclic stability is tested through thousands of constant current charge–discharge processes, Fig. 3(f) shows the cyclic stability curve of NiCo2O4 electrode measured at a potential window of 0–0.55 V and a current density of 10 A g−1 for 3000 cycles of charging and discharging. It can be seen that the specific capacitance of NiCo2O4 electrode remained basically unchanged in the first 250 cycles, and began to decline slowly after 250 cycles. After 3000 cycles, the specific capacitance decreased from the initial 519.2 F g−1 to 481.7 F g−1, and the retention rate of specific capacitance was 92.8%. It is shown that NiCo2O4 electrode has better cyclic stability than sea urchin NiCo2O4 microsphere (capacitance retention rate 81.6% after 5000 cycles at current density 5 A g−1).25 The strong crystal structure of NiCo2O4 makes it resistant to material structure damage, so it shows excellent cyclic stability and has practical application potential.
NiCo2O4 cathode electrode and GO anode electrode are prepared to make NiCo2O4//GO asymmetric supercapacitor, which can be charged and discharged for 3000 times at the current density of 10 A g−1. The electrochemical performance of NiCo2O4//GO asymmetric supercapacitor was tested by cyclic voltammetry test and constant current charge–discharge test, and the decay process was analysed by comparing the performance with that before cyclic.
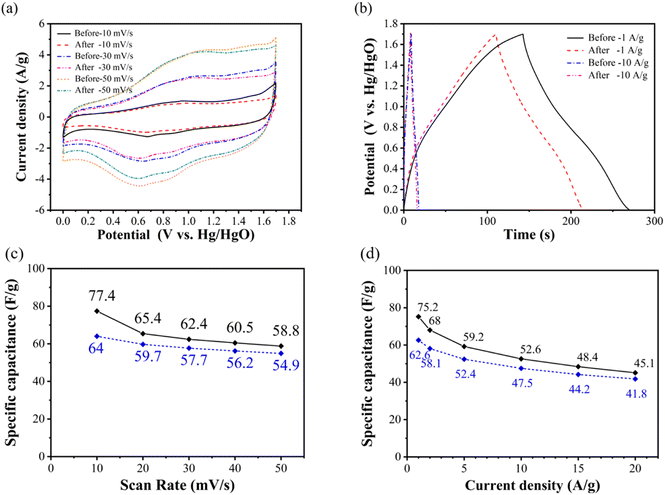
Fig. 4(a) shows the comparison of cyclic voltammetry curves of NiCo2O4//GO asymmetric supercapacitor with scanning rates of 10, 30 and 50 mV s−1 at the voltage range of 0–1.7 V before and after 3000 cycles. It can be seen that the charge–discharge current density of NiCo2O4//GO asymmetric supercapacitor decreases after cycling, and the charging current density after cycling changes little compared with that before cycling. It only decreases when it is higher than the oxidation peak potential and approaches the upper cut off potential, and shows the weakening of polarization phenomenon.
Fig. 4(b) shows the comparison of constant current charge and discharge curves of NiCo2O4//GO asymmetric supercapacitor with current density of 1 and 10 A g−1 in the voltage range of 0–1.7 V before and after cycling. It can be seen that the charge–discharge time after the cycle decreases, indicating that the specific capacitance decreases. In general, the specific capacitance retention rate is used to represent the cycle stability, and the specific capacitance loss is also an important method to represent the cycle decline.
Fig. 4(c) shows that the specific capacitance of the asymmetric supercapacitor before and after the cycle decreases to a certain extent at different scanning rates. Moreover, Fig. 4(d) shows the specific discharge capacitance of NiCo2O4//GO asymmetric supercapacitor calculated according to eqn (6) at the current density of 1, 2, 5, 10, 15 and 20 A g−1 before and after 3000 cycles. It can be seen that the specific capacitance decreases overall after cycling, but the multiplier performance improves instead. Before the cycle, when the current density increases from 1 A g−1 to 20 A g−1, the specific capacitance retention rate is 60.0%. After cycling, the specific capacitance retention rate is increased to 66.8%. This is because after 3000 cycles at 10 A g−1 current density, NiCo2O4//GO asymmetric supercapacitors exhibit greater specific capacitance loss at low current density than at high current density. Supercapacitor at 1 A g−1 current density, the specific capacitance loss is 16.8%, and at the current density of 20 A g−1, the specific capacitance loss is only 7.3%.
3.3 Study on the mechanism of electrode decay
After cycling, the discharge specific capacitance of NiCo2O4 electrode decreases, which is one of the main reasons for the performance decline of NiCo2O4//GO asymmetric supercapacitor. By ultrasonic oscillation, the binder polyvinylidene fluoride was quickly dissolved in 1-methyl-2-pyrrodanone to make the electrode active material fall off from the electrode sheet, and the recycled NiCo2O4 material was characterized by its surface morphology, crystal structure and elemental composition.The morphology of NiCo2O4 was analysed by scanning electron microscope. Fig. 5(a) and (d) show the material morphology at a scale of 10 μm before and after cycling, respectively. After cycling, the shape of aggregates becomes irregular compared with that before cycling, and the number of small particles increases significantly. Fig. 5(b) and (e) show the surface morphologies of aggregates at 100 nm before and after cycling, respectively; (c) and (f) show the surface morphologies of aggregates at 50 nm before and after cycling, respectively. The comparison of the surface morphology of aggregates before and after the cycle shows that the aggregates still have rough and slotted surface morphology, but the porosity increases. The proportion of pore area in Fig. 5(b) and (e) calculated on basis of gray scale increases from about 7.3% to 16.6%. The increase of porosity will reduce the charge transfer resistance, realize the rapid electron transfer of the electrode and reduce the volume change during the charge–discharge cycle, thus having a positive impact on the electrochemical performance and stability of the electrode materials.26,27
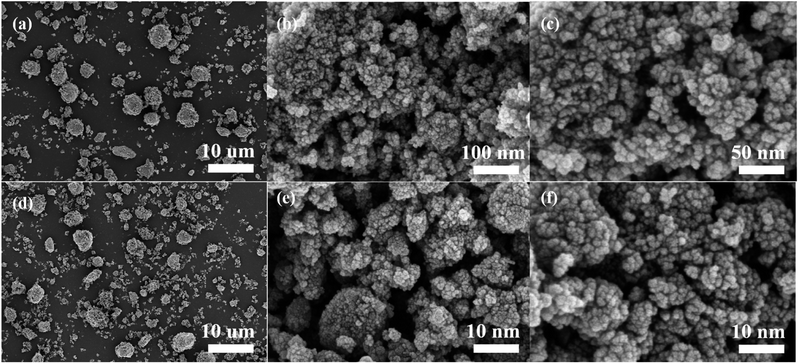 | ||
| Fig. 5 Comparison of scanning electron microscopy images before and after cyclic testing of cathode active material: (a)–(c) are before the cycle; (d)–(f) are after the cycle. | ||
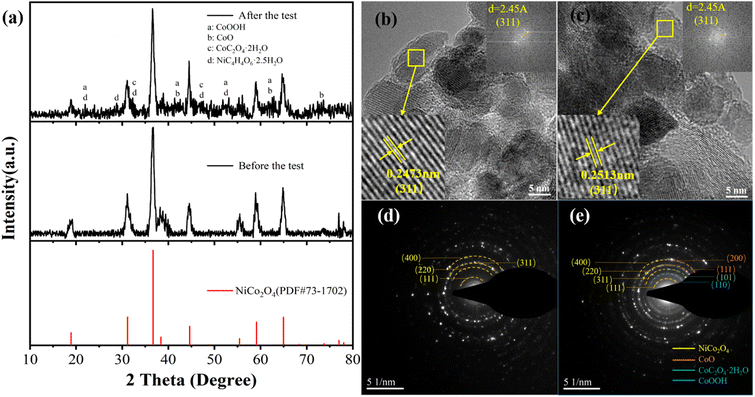
Through X-ray diffraction analysis, the crystal phase composition and crystal structure of NiCo2O4 material recovered from the recycled cathode electrode were analysed, and the results are shown in Fig. 6(a). The XRD pattern of the recycled material is no longer a single NiCo2O4 crystal phase, but a hybrid peak of multiple crystal phases superposition, such as CoOOH, CoO, CoC2O4·2H2O, NiC4H4O6·2.5H2O, appears at 2θ values of about 22°, 29°, 33°, 42°, 47°, 53°, 63° and 74°. The results show that the structure of NiCo2O4 is damaged and mixed with various crystals during the electrochemical cycle. The average grain size of NiCo2O4 after the cycle is 11.4 nm by using the half-height and width of the diffraction peak, which decreases compared with 13.3 nm before the cycle, which also indicates the failure of the crystal structure of NiCo2O4. The destruction of crystal structure and the disorder of crystal phase indicate the material destruction of NiCo2O4 nanoparticles during the electrochemical cycle. Fig. 6(b) and (c) compared HRTEM images before and after the cycle, which found that for the same crystal plane (311), the lattice spacing changes from 0.2473 nm to 0.2513 nm. As the crystal plane spacing becomes larger, the structural period of the crystal will also become larger, resulting in the deterioration of crystal stability. The increase of lattice spacing causes the 2θ value of the characteristic peak (311) in the XRD pattern to shift from 36.7° to 36.6°, which changes the crystal structure and ultimately leads to the degradation of the performance of NiCo2O4 electrode.28 Selected-area electron diffraction (SAED) was conducted to estimate the crystallinity of NiCo2O4, which is shown in the inset of Fig. 6(d). The diffraction rings can be indexed to the (111), (220), (311) and (400) planes of cubic NiCo2O4 as marked in Fig. 6(a), respectively, indicating the poly-crystalline structure of NiCo2O4. Fig. 6(e) is the diffraction ring pattern after the cycle. Compared with Fig. 6(d), it is found that many impurities are produced, in which the characteristic crystal plane shown by the generation of impurity can correspond to the impurities produced in the XRD pattern. Orange represents the impurity CoO two characteristic crystal planes are (200), (111) respectively. Green is the (101) characteristic crystal plane of CoC2O4·2H2O; blue is the newly added diffraction ring corresponding to the (110) crystal plane of CoOOH.
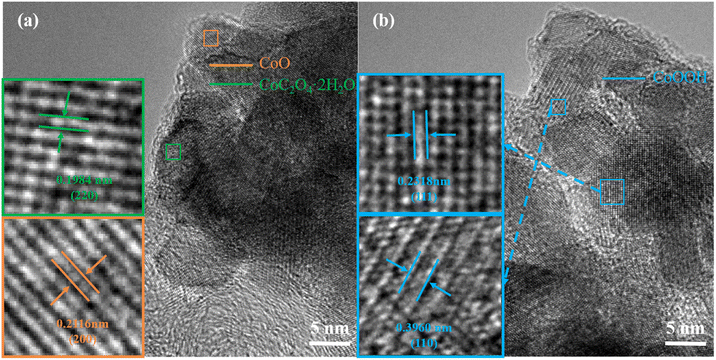
Fig. 7 shows the HRTEM diagram after cycling. It can be seen in Fig. 7(a) that a new lattice spacing of 0.1984 nm appears after cycling, corresponding to the (220) characteristic crystal face of the newly formed impurity CoC2O4·2H2O. Orange corresponds to the CoOOH characteristic crystal face whose crystal spacing is 0.2116 nm. In Fig. 7(b), it can be seen that the two characteristic crystal faces of the impurity CoOOH (111) and (110) correspond to lattice spacing of 0.2318 and 0.3960 nm, respectively. These HRTEM diagrams confirm the above analysis combined with XRD and SAED diagrams, proving the formation of the above-mentioned impurities. The comparative analysis further confirmed the formation of various impurities after circulation. The above analysis of the crystal structure shows that the crystal structure of the electrode has been destroyed after the cyclic test, leading to the deterioration of the performance.
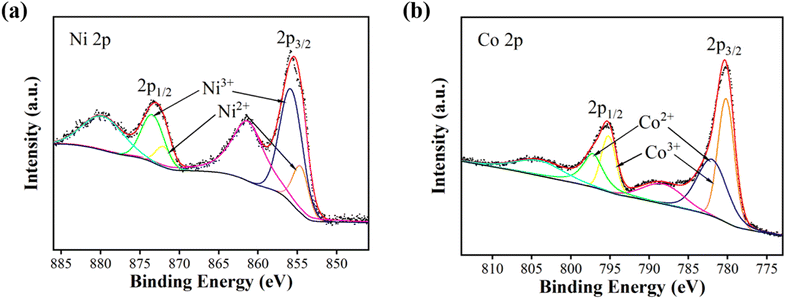
The elemental valence of NiCo2O4 was analysed by XPS, and the ratio of the content of +2-valent element and +3-valent element was calculated. The change of elemental valence in NiCo2O4 after cyclic decay was studied. Fig. 8 shows the comparison of XPS spectrums after the cycle. (a) and (b) are Ni 2p spectrum and Co 2p spectrum after the cycle, respectively. After the cycle, the peaks of 2p1/2 and 2p3/2 of the Ni 2p spectrum remain around 873.1 eV and 855.8 eV, and the peak-to-peak of the Ni 2p spectrum also remain unchanged. The 2p1/2 and 2p3/2 peaks of the Co 2p spectrum are about 795.0 eV and 780.0 eV, which slightly decrease compared with before the cycle, but the peak-to-peak remains unchanged. The XPS atlas was used to calculate the peak area of Ni and Co in the 2p3/2 hybrid orbital and the ratio of the two valence elements in the cycled NiCo2O4. The results are shown in Tables 3 and 4. The value of Ni2+/Ni3+ is 0.29, and the value of Co2+/Co3+ is 0.92. After cycling, the content of Ni2+ in Ni increases, while the content of Co2+ in Co decreases, indicating that Ni in NiCo2O4 is more inclined to reduction, while Co is more inclined to oxidation during the electrochemical cycling process. The total ratio of +2-valent element to +3-valent element is reduced to 0.65, indicating that the redox reaction of NiCo2O4 is not completely reversible, and the active sites are reduced, leading to the deterioration of properties.
| Ni2+ | Ni3+ | Ratio of content Ni2+/Ni3+ | |||
|---|---|---|---|---|---|
| Binding energy (eV) | Area of peaks (%) | Binding energy (eV) | Area of peaks (%) | ||
| Before | 854.6 | 11.0 | 855.8 | 89.0 | 0.12 |
| After | 854.6 | 22.6 | 855.8 | 77.4 | 0.29 |
| Co2+ | Co3+ | Ratio of content Co2+/Co3+ | |||
|---|---|---|---|---|---|
| Binding energy (eV) | Area of peaks (%) | Binding energy (eV) | Area of peaks (%) | ||
| Before | 782.0 | 60.0 | 780.2 | 40.0 | 1.50 |
| After | 782.0 | 48.0 | 780.2 | 52.0 | 0.92 |
Fig. 9(a) EIS comparison of NiCo2O4 electrode before and after cycling. According to the figure, the RΩ value after cycling decreases from 1.0 Ω to 0.9 Ω, and the Rct value from 0.3 Ω to 0.1 Ω, and the impedance mode is also greatly reduced, but the electrochemical impedance of NiCo2O4 electrode decreases after cycling. After cycling, the specific capacitance of NiCo2O4 electrode is mainly affected by the crystal phase change of NiCo2O4 material, the destruction of crystal structure and the reduction of active site, and the performance declines, while the power performance is little affected by the change of NiCo2O4 material. The electrochemical impedance of NiCo2O4 is more affected by the dispersion of NiCo2O4 aggregates and the increase of porosity.
The charge storage capacity reflected by the specific capacitance is the most important electrochemical performance of the electrode, so it is considered that the electrochemical performance of the electrode deteriorates overall after cycling. The current density will affect the cyclic stability of NiCo2O4//GO asymmetric supercapacitor. Fig. 9(b) shows the cycle stability curve of NiCo2O4//GO asymmetric supercapacitor measured by 5, 10, 15 and 20 A g−1 cycles of charge and discharge 3000 times at the voltage range of 0–1.7 V. The specific capacitance of NiCo2O4//GO asymmetric supercapacitor drops rapidly in the first few hundred cycles, and then the curve flattens out. During the cycle, material destruction and the reduction of active sites lead to the performance decline, while the increase of porosity slows down the performance decline to some extent. With the increase of current density, the cyclic decay of NiCo2O4//GO asymmetric supercapacitor is intensified, and the cyclic decay is extremely fast at the high current density of 20 A g−1.
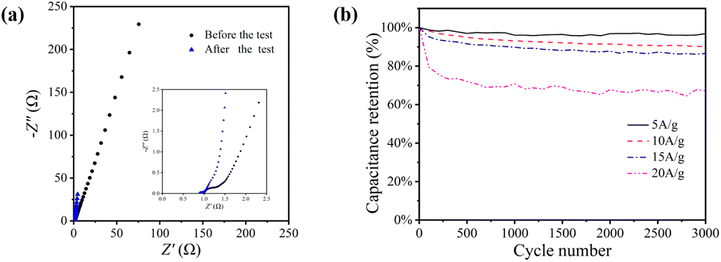 | ||
| Fig. 9 (a) EIS comparison curves before and after the cycle (b) cyclic stability curve comparison of NiCo2O4//GO asymmetric supercapacitor. | ||
In order to improve the cycle stability of the electrode material, the first is to make NiCo2O4 nanoparticles grow directly on the collector, which can improve its electrochemical performance and cycle stability. The traditional polyvinylidene fluoride (PVDF) binder is easy to absorb the electrolyte and swell, resulting in a decline in the bonding performance, thus making its electrochemical performance decline. Second, the surface morphology of the fluid collector can be changed. The larger the surface roughness of the fluid collector, the larger the conductive contact area between the active substance and the fluid collector, the higher the adhesion strength, and the more difficult it is to peel off during the charging and discharging process, thus having higher cyclic stability. Third, it is necessary to ensure that the electrode material reduces contact with the air during work to prevent oxidation into other impurities during work, resulting in changes in the composition and crystal structure of NiCo2O4; besides, reducing the electrode load during operation and reducing the current density of the electrode material can greatly improve its cycle stability.29–31
4. Conclusions
In order to study the degradation mechanism of NiCo2O4//GO asymmetric supercapacitors, NiCo2O4 nanoparticles were prepared by hydrothermal method with a single phase and a smaller grain size of 13.3 nm. The aggregate particle size of the material is widely distributed and the surface morphology is rough and interstitial. NiCo2O4 electrode was prepared by coating method using NiCo2O4 as electrode active material. NiCo2O4//GO asymmetric supercapacitor was constructed and tested for 3000 times of charging and discharging at a current density of 10 A g−1. The cyclic decay of the NiCo2O4 electrode before and after the cycle is analysed. The cyclic decay of the asymmetric supercapacitor is mainly caused by the decay of the pseudocapacitance of the active material of the NiCo2O4 electrode, and is also affected by other factors such as the decay of electrolyte and fluid collector. The following conclusions were reached:By comparing XRD patterns before and after the cycle, it can be seen that there are heterogeneous peaks of multiple crystal phases superposition, such as CoOOH, CoO, CoC2O4·2H2O, NiC4H4O6·2.5H2O, etc., which indicates that the structure of NiCo2O4 is damaged and a variety of crystal phases are mixed during the electrochemical cycle. This leads to the degradation of electrode performance. After the cycle, the aggregate particles of NiCo2O4 materials are more dispersed and the porosity increases, but the surface morphology is still rough. According to the analysis of the HETEM and SAED diagrams, the lattice spacing of the crystal structure increases before and after the cycle, and the crystal structure is in disorder due to the generation of new substances. Compared with the previous damage, the stability of the electrode has been reduced and the performance of the pseudocapacitor has been decreased. This is one of the main reasons leading to the performance decline of asymmetric supercapacitors. The results of X-ray photoelectron spectroscopy showed that the relative content of Ni2+ in Ni increased, the relative content of Co3+ in Co increased, and the total ratio of +2-valent element to +3-valent element decreased from 0.78 to 0.65, and the active site decreased. The change of crystal phase, the increase of lattice spacing leading to the destruction of crystal structure and the decrease of active sites are the main reasons for the degradation of electrochemical performance of NiCo2O4 electrode represented by specific capacitance, while the agglomeration particles are more dispersed, and the increase of porosity has a positive effect on slowing down the degradation. Therefore, when the electrode is used, it is necessary to minimize the contact with the air and control it to work at the most appropriate current density in order to delay the degradation of the electrode material. It has a good reference significance for improving the cycle stability of electrode materials.
Conflicts of interest
None.Acknowledgements
This research was supported by 111 Project (B17034).References
- Z. Lin, E. Goikolea and A. Balducci, et al., Materials for supercapacitors: when Li-ion battery power is not enough, Mater. Today, 2018, 21(4), 419–436 CrossRef CAS
.
- B. E. Conway, Electrochemical Supercapacitors: Scientific, Fundamentals, and Technological Applications, Kluwer Academic/Pemum Publishers, New York, 1999 Search PubMed
.
- Y. Shao, M. El-Kady and J. Sun, et al., Design and Mechanisms of Asymmetric Supercapacitors (Review), Chem. Rev., 2018, 118(18), 9233–9280 CrossRef CAS PubMed
.
- Q. Zhang and G. Li, Experimental Study on a Semi-active Battery-Supercapacitor Hybrid Energy Storage System for Electric Vehicle Application, IEEE Trans. Power Electron., 2020, 35(1), 1014–1021 Search PubMed
.
- Z. Song, J. Li and J. Hou, et al., The battery-supercapacitor hybrid energy storage system in electric vehicle applications: a case study, Energy, 2018, 145(1), 433–441 CrossRef
.
- X. Ni, K. Li and C. Li, et al., Construction of NiCo2O4 nanoflake arrays on cellulose-derived carbon nanofibers as a freestanding electrode for high-performance supercapacitors, Front. Chem. Sci. Eng., 2023, 17(6), 691–703 CrossRef CAS
.
- F. Li, Q. Li and H. Kimura, et al., Morphology controllable urchin-shaped bimetallic nickel-cobalt oxide/carbon composites with enhanced electromagnetic wave absorption performance, J. Mater. Sci. Technol., 2023, 148(17), 250–259 CrossRef
.
- M. A. Yewale, R. A. Kadam and N. K. Kaushik, et al., Interconnected plate-like NiCo2O4 microstructures for supercapacitor application, Mater. Sci. Eng., B, 2023, 287 Search PubMed
.
- L. Pio Di Noia, F. Genduso and R. Miceli, et al., Optimal Integration of Hybrid Supercapacitor and IPT System for a Free-Catenary Tramway, IEEE Trans. Ind. Appl., 2019, 55(1), 794–801 Search PubMed
.
- C. Julien and A. Mauger, Nanostructured MnO2 as electrode materials for energy storage (review), Nanomaterials, 2017, 7(11), 396 CrossRef
.
- T. Liu and Y. Li, et al., Addressing the Achilles' heel of pseudocapacitive materials: long-term stability, InfoMat, 2020, 2(5), 807–842 CrossRef CAS
.
- S. Liu, L. Wei and H. Wang, et al., Review on reliability of supercapacitors in energy storage applications, Applied Energy, 2020, 278, 115436 CrossRef CAS
.
- Y. Sun, J. Zhang and X. Sun, et al., High-performance spinel NiMn2O4 microspheres self-assembled with nanosheets by microwave-assisted synthesis for supercapacitors, CrystEngComm, 2020, 22(9), 1645–1652 RSC
.
- F. Bao, X. Wang and X. Zhao, et al., Controlled growth of mesoporous ZnCo2O4 nanosheet arrays on Ni foam as high-rate electrodes for supercapacitors, RSC Adv., 2014, 4, 2393–2397 RSC
.
- T. Liu, S. Zhou, X. Yu, C. Mao, Y. Wei, X. Yu, L. Chen, X. Zhao, G. Tian and L. Chen, RSC Adv., 2022, 12, 4029–4041 RSC
.
- L. Miao, Z. Song, W. Du, X. Zheng, Y. Lv, L. Gan and M. Liu, Advances in organic cathode materials for aqueous multivalent metal-ion storage, Mater. Chem. Front., 2023, 7, 2731–2749 RSC
.
- J. Wei, Study on nickel cobalt oxide nanostructure and supercapacitor performance, Shenyang University of Technology, Shenyang, 2019 Search PubMed
.
- Z. Weiqian, Study on preparation and electrochemical application of nickel cobalate materials with different morphologies, Qilu University of Technology, Jinan, 2019 Search PubMed
.
- G. Guo, K. Ouyang and J. Yu, et al., Facile Synthesis of LaCoO3 with a High Oxygen Vacancy Concentration by the Plasma Etching Technique for High-Performance Oxygen Ion Intercalation Pseudocapacitors, ACS Appl. Energy Mater., 2019, 3(1), 300–308 CrossRef
.
- X. Liu, Y. Zhang and X. Xia, et al., Self-assembled porous NiCo2O4 hetero-structure array for electrochemical capacitor, J. Power Sources, 2013, 239, 157–163 CrossRef CAS
.
- S. Gao, F. Liao and S. Ma, et al., Network-like mesoporous NiCo2O4 grown on carbon cloth for high-performance pseudocapacitors, J. Mater. Chem. A, 2015, 3(32), 16520–16527 RSC
.
- J. Barqi, S. M. Masoudpanah and M. Hasheminiasari, et al., Nanoribbon-like NiCo2O4/reduced graphene oxide nanocomposite for high-performance hybrid supercapacitor, J. Alloys Compd., 2023, 930 Search PubMed
.
- J.-G. Seong, T. H. Ko and D. Lei, et al., Engineered NiCo-LDH nanosheets-and ZnFe2O4 nanocubes-decorated carbon nanofiber bonded mats for high-rate asymmetric supercapacitors, Green Energy Environ., 2022, 7(6), 1228–1240 CrossRef CAS
.
- C. Li, Y. Liu and G. Li, et al., Preparation and electrochemical properties of nanostructured porous spherical NiCo2O4 materials, RSC Adv., 2020, 10(16), 9438–9443 RSC
.
- S. Yan, S. Luo and M. Sun, et al., Facile hydrothermal synthesis of urchin-like NiCo2O4 as advanced electrochemical pseudocapacitor materials, Int. J. Energy Res., 2021, 45, 20186–20198 CrossRef CAS
.
- B. Krüner, A. Schreiber and A. Tolosa, et al., Nitrogen-containing novolac-derived carbon beads as electrode material for supercapacitors, Carbon, 2018, 132, 220–231 CrossRef
.
- H. Yang, X. Sun and H. Zhu, et al., Nano-porous carbon materials derived from different biomasses for high performance supercapacitors, Ceram. Int., 2020, 46, 5811–5820 CrossRef CAS
.
- T. Liu and Y. Li, et al., Addressing the Achilles' heel of pseudocapacitive materials: long-term stability, InfoMat, 2020, 2(5), 807–842 CrossRef CAS
.
- X. Chen, Q. Su and J. Yu, et al., Experimental study on the degradation mechanism of LaCoO3-based symmetric supercapacitors, RSC Adv., 2021, 11(41), 25170–25178 RSC
.
- X. Zheng, L. Miao and Z. Song, et al., In situ nanoarchitecturing of conjugated polyamide network-derived carbon cathodes toward high energy-power Zn-ion capacitors, RSC Adv., 2022, 10(2), 611–621 CAS
.
- G. Guanlun and S. Qiwei, Cycling stability of Fe2O3 nanosheets as supercapacitor sheet electrodes enhanced by MgFe2O4 nanoparticles, RSC Adv., 2023, 6, 3643–3651 Search PubMed
.
| This journal is © The Royal Society of Chemistry 2023 |

