DOI:
10.1039/D3RA05202H
(Paper)
RSC Adv., 2023,
13, 27599-27607
Heat transfer mechanism in graphene reinforced PEEK nanocomposites
Received
1st August 2023
, Accepted 2nd September 2023
First published on 15th September 2023
Abstract
The thermal conductivity of graphene is in the range of 3000–5000 W m−1 K−1, showing great potential in high thermal conductivity devices. However, the thermal conductivity of graphene-reinforced polymer is typically lower than 10 W m−1 K−1, which is far from theoretical expectations. To understand the mechanisms of heat transfer in graphene-reinforced polymers, this work investigated the effect of graphene addition on the thermal conductive performance of polyetheretherketone (PEEK) matrix. The study examined the number of layers, deflection angles, and interlayer distances using molecular dynamics (MD) simulations. The results showed that the improvement of thermal conductivity of PEEK nanocomposite was not only related to the content of graphene but also to the angle between the benzene ring in the molecular chain of PEEK and the transfer direction of heat flow. Increasing the number of graphene layers is more beneficial to the enhancement of thermal conductivity. In particular, the enhancement of thermal conductivity is most significant when the number of graphene layers is the same, and the interlayer distance is less than the truncation radius.
1. Introduction
The gradual increase of highly integrated and efficient requirements in the field of the modern electronics industry has led to a significant reduction in the size of the devices and an increase in power consumption. The integration and intelligence of devices lead to an increasing demand for their heat dissipation capability, which directly affects their lifetime and performances.1–3 Polymer composites have been widely used in electronics,4,5 energy, aerospace, and daily life because of their good formability, lightweight, and low cost properties.6–8 There is further need for high thermal conductivity of polymer composites to meet the requirements of efficient and integrated development in the electronics industry. Polymers usually exhibit amorphous structures, and most of them are thermal insulators,9,10 resulting in a relatively low thermal conductivity11–13 (0.1–0.5 W m−1 K−1) due to weak interactions between polymer molecular chains and excessive phonon scattering14 caused by various defects (voids, entanglements, chain ends and impurities15).
Fillers with high thermal conductivity are often added to polymers to enhance their thermal conductivity. Compared to metallic materials (such as Si, Cu, Al, Ni, and others),16–18 two-dimensional (2D) materials (such as graphene and hexagonal boron nitride) have a sheet-like morphology and greater thermal conductivity. This characteristic allows them to interconnect more easily in the polymer matrix and establish heat transfer paths, which significantly enhances the thermal conductivity of nanocomposites.19–21 Graphene is a 2D carbon-based nanomaterial that has undergone extensive study22–24 due to its excellent mechanical properties (Young's modulus of ∼1 TPa (ref. 25)), high specific surface area (2600 m2 g−1 (ref. 26)), outstanding electrical properties (high electron mobility of 250![[thin space (1/6-em)]](https://www.rsc.org/images/entities/char_2009.gif) 000 cm2 V−1 s−1 (ref. 27)), and thermal conductivity (5000 W m−1 K−1 (ref. 28)). Numerous polymers, such as polyimide,29,30 polycarbonate,31 polypropylene (PP),32 and polyetheretherketone (PEEK),33,34 among others, have been blended with graphene or graphene derivatives35,36 to enhance their mechanical, electrical, and thermal properties.
000 cm2 V−1 s−1 (ref. 27)), and thermal conductivity (5000 W m−1 K−1 (ref. 28)). Numerous polymers, such as polyimide,29,30 polycarbonate,31 polypropylene (PP),32 and polyetheretherketone (PEEK),33,34 among others, have been blended with graphene or graphene derivatives35,36 to enhance their mechanical, electrical, and thermal properties.
Numerous studies have reported that nanoparticles can enhance the thermal conductivity of nanoreinforced composites.37,38 However, most of these studies have primarily focused on the relationship between the degree of thermal conductivity improvement and nanomaterial content,39,40 with the molecular scale information often missing. Many researchers consider the nanomaterial content as the most important factor affecting thermal conductivity and ignore the effect of nanomaterial addition on polymers. Currently, experimental techniques are unable to obtain the observations mentioned previously. Since the introduction of the molecular dynamics (MD) method by Alder and Wainwright in 1957,41 MD has been extensively used in various fields such as chemistry, biomedicine, materials science and engineering, and physics.42–45 Thus, the potential improvement mechanism of thermal conductivity by nanomaterials can be examined further at the molecular level based on MD simulations.
Most of the current molecular simulation works use simple models with regularly arranged 2D nanofillers; however, the nanofillers in most nanocomposites are randomly distributed. This study examines the heat transfer properties of PEEK nanocomposites with randomly distributed graphene, and the accuracy of the simulation outcomes is authenticated through experimental characterization of thermal conductivity for graphene/PEEK nanomaterials that are randomly distributed. Additionally, large-scale MD simulations are utilized to explore how the number of layers, deflection angles, and interlayer distance of graphene impacts thermal conductivity.
2. Computation details and method
2.1. Molecular model for monomer
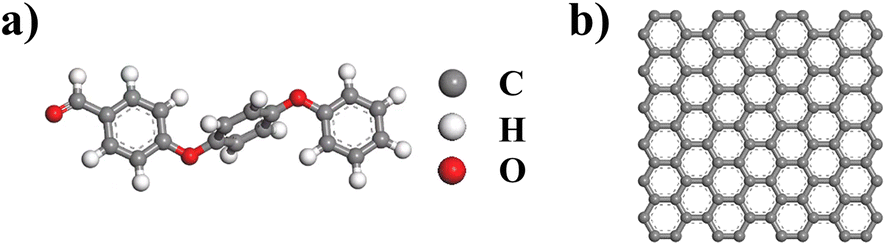
The initial model of the PEEK composite was constructed by Materials Studio 2017 (Accelrys, U.S.). The corresponding molecular structures of PEEK and graphene are shown in Fig. 1.
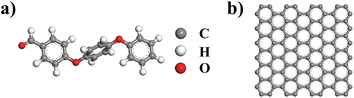 |
| | Fig. 1 (a) Molecular structure of the PEEK monomer; (b) molecular structure of monolayer graphene. | |
2.2 Randomly distributed graphene/PEEK model
In the initial model, the nanocomposite matrix consists of 90 PEEK chains with 20 PEEK repeating units in each chain. Graphene, consisting of 104 atoms, was chosen as the reinforcing material for the PEEK polymer, and graphene was randomly distributed in the box to form an initial model with a three-dimensional periodic boundary condition of 80 Å × 80 Å × 300 Å.
2.3 Graphene/PEEK model with different distribution
A single cell model consisting of 40 PEEK molecular chains was first established, and then four sets of models were replicated by LAMMPS software and assembled into graphene nanosheets with different distribution forms (67 Å × 67 Å × 67 Å) to form graphene/PEEK models with different numbers of layers, deflection angles, and spacings.
2.4 Calculating of thermal conductivity
The initial model was obtained and translated to the MD simulation package LAMMPS46 for calculations of thermal conductivity. The atomic interactions within the PEEK molecular chains were described using the polymer consistent force field (PCFF)47 while the van der Waals interactions between PEEK and graphene were described using the 9-6 Lennard-Jones (LJ) potential function, following the settings in Materials Studio. The adaptive intermolecular reactive empirical bond order (AIREBO) potential was used to describe the C–C atomic interactions for graphene.48,49 This potential function is suitable for calculating the mechanical50 and thermal properties51 of carbon nanostructures. The models were with periodic boundary conditions, with a truncation radius of 12.5 Å. To avoid failure of the equilibrium simulation due to unsuitable initial configuration of the molecular structure, the nanocomposite models were first obtained with optimized structures using the conjugate gradient method for energy minimization. The models were then relaxed for 500 ps at 300 K in the canonical ensemble (NVT). Afterward, the model was relaxed for another 500 ps at 300 K in the isothermal-isobaric ensemble (NPT).
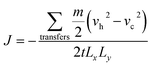
The Müller-Plathe reverse perturbation nonequilibrium molecular dynamics (RNEMD) method proposed by Florian Müller-Plathe52 is used to simulate the thermal conductivity of graphene/PEEK nanocomposites. First, after the molecular model underwent NVT, NPT relaxation, 2 ns (2000000 steps) of simulations were performed using this method to reach the non-equilibrium steady state. After the system reached the non-equilibrium steady state, the thermal conductivity was calculated at 1 ns intervals and repeated four times. The standard deviation was estimated from these four calculations. All calculations were performed in small time steps of 1 fs. The thermal conductivity was calculated using Fourier's law, where the thermal conductivity is λ, heat flux is J, and temperature gradient is ΔT. The thermal conductivity was calculated as follows:
| |
 | (1) |
The RNEMD method generates heat fluxes by exchanging the particle velocities in different regions. We divide the molecular model into N regions with the same width in the z-direction, defining the middle region as the hot bath region and setting only the left end as the cold bath region because of periodic boundary conditions. The temperature of each region is obtained by statistically averaging the temperatures of all atoms in the region. The temperatures of the atoms in the regions are calculated by the following equation:
| |
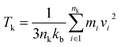 | (2) |
The atomic mass is mi, velocity is vi, and Boltzmann constant is kb. The heat flux is caused by the exchange of velocity vectors from the cold bath region to the hot bath region. The exchange of the velocity of the hottest atoms in the cold bath region with the velocity of the coldest atoms in the hot bath region leads to an increase in the temperature in the hot bath region, thus creating a temperature gradient between the cold–hot regions until a steady state is reached. During the velocity exchange process, the velocities of the same mass of atoms need to be exchanged in order to keep the total momentum, total kinetic energy, and total energy constant. The heat flux can be derived from the following equation:
| |
 | (3) |
The subscripts h and c denote hot and cold atoms of the same mass m exchanged at speed. Lx and Ly are the lengths of the boxes in the x and y directions, respectively, and the number 2 in the denominator is determined due to the periodicity of the z direction since energy can be transferred in both directions from the hot bath region to the cold bath region.
3. Experiments
3.1 Preparation of graphene/PEEK nanocomposites
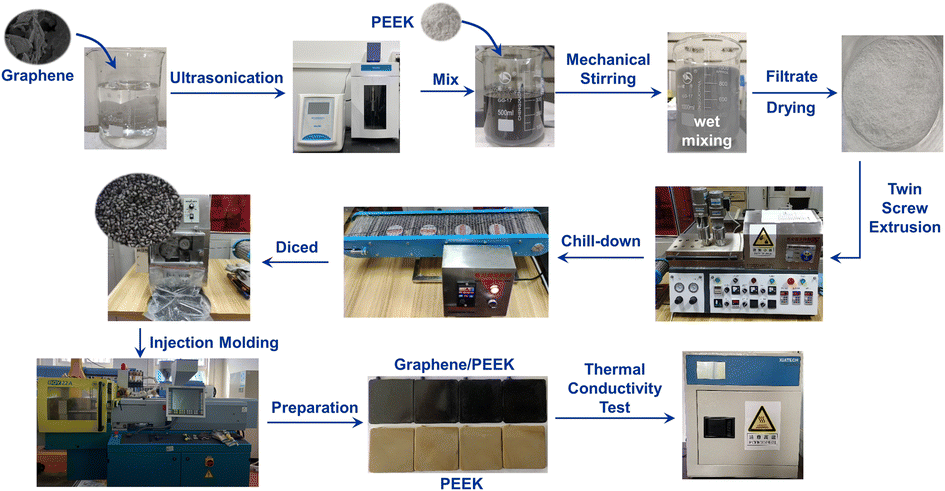
The graphene (Changzhou 2D Carbon Ltd, China) was pre-treated in anhydrous ethanol using a cell breaker (JY98-IIIDN, Shanghai huxishiye Ltd, China) at 1000 W power for 45 min and then mixed the ultrasonic treated solution with PEEK powder (550PF-300, Jilin Joinature Polymer Co., Ltd, China) for mechanical stirring. The mass ratios of graphene to PEEK powder were 1:99, 3:97, and 5:95. The mixed solution was stirred in a magnetic stirrer (MS7-H0-S, Beijing Longxing Instruments, China) for 4 h. The graphene/PEEK powder was obtained by removing anhydrous ethanol by filtration, and the mixed powder was placed in a vacuum drying oven (DZF-6050, Beijing Beifang Lihui Instrument Equipment Co., Ltd, China) and dried to constant weight in a vacuum at 100 °C. The graphene/PEEK composites were prepared by the wet mixing method and melt mixing, which allowed the filler to be more dispersed in the matrix. After drying to constant weight in a vacuum drying oven at 100 °C, the graphene/PEEK blended powder was further melted, mixed (400 °C, 50 rpm), and cut into pellets in a twin-screw extruder (SJZS-10B, Wuhan Ruiming Machinery Factory, China). The obtained graphene/PEEK nanocomposites of 1 wt%, 3 wt%, and 5 wt% were shaped by injection molding technique (22A, BOY, Germany) to obtain 30 mm × 30 mm × 3 mm test samples for thermal conductivity testing. As control experiments, pure PEEK samples were also prepared using exactly the same conditions. The experimental process is shown in Fig. 2.
 |
| | Fig. 2 PEEK and graphene/PEEK preparation flow chart. | |
3.2 Thermal conductivity testing
The thermal conductivity of the nanocomposites was tested by the hot wire method (TC3000, Xi'an XIA XI Electronic Technology Co., Ltd, China). The sample size was 30 mm × 30 mm × 3 mm. The hot wire and sensor were placed between the two samples and clamped between the air environment and room temperature (25 °C) with a sampling interval of 5 min, sampling time of 5 s, and sampling voltage of 1.5 eV. The different content samples were divided into 5 groups; each group was repeatedly measured 5 times, and the average value was taken as the thermal conductivity of the composites.
4. Results and discussion
4.1 Validation of simulation model
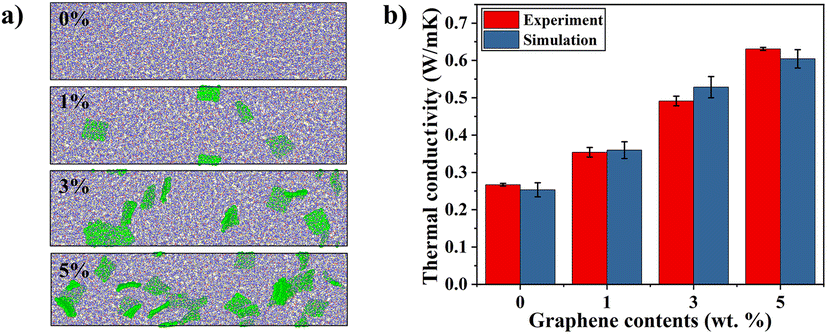
Fig. 3(a) shows the molecular configurations of randomly dispersed graphene/PEEK nanocomposites at different contents (0 wt%, 1 wt%, 3 wt%, 5 wt%), and Fig. 3(b) shows the comparison between simulation results and experimental characterization at different graphene contents (0 wt%, 1 wt%, 3 wt%, 5 wt%). Thermal conductivity (TC) simulation results are consistent with experimental characterizations, in which the TC of nanocomposites increases with the growth of graphene content, and the TC of the composite at 5% graphene content is 0.604 ± 0.012 W m−1 K−1, which is 138.73% higher than that of the pure PEEK system. The molecular simulation results were within an 8% error range from experimental measurements, which validates the accuracy of MD prediction of TC. Fig. 4(a) shows the SEM results of the PEEK polymer. It can be observed that the entire cross-section is relatively flat. Fig. 4(b)–(d) show the SEM results of graphene/PEEK composites with different graphene contents. The more prominent contour in the figure is the graphene sheet, which has a multi-layered and multi-angle distribution. As the graphene content increases, the density of the graphene sheets also increases, making it easier for them to come into contact with each other, forming more thermal conductivity networks and further improving heat transfer efficiency.
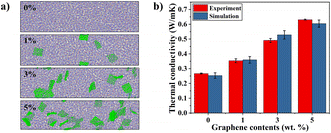 |
| | Fig. 3 (a) Molecular structure model of randomly distributed graphene/PEEK nanocomposites with different graphene contents (0 wt%, 1 wt%, 3 wt%, 5 wt%); (b) molecular dynamics simulation of different graphene contents compared with experimental results of TC. | |
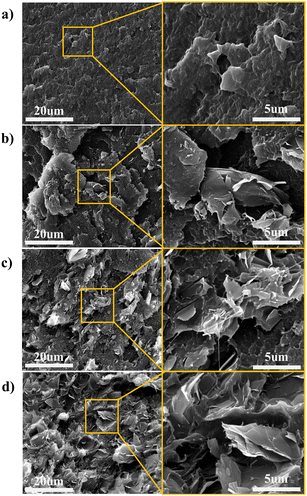 |
| | Fig. 4 (a) PEEK SEM results and local enlarged images; (b) 1 wt% graphene/PEEK SEM results and local enlarged images; (c) 3 wt% graphene/PEEK SEM results and local enlarged images; (d) 5 wt% graphene/PEEK SEM results and local enlarged images. | |
4.2 The number of graphene layers
To explain the improvement mechanism of graphene on the TC of graphene/PEEK composites, we developed a model of graphene/PEEK with different layer numbers (as shown in Fig. 5(a)). Different simulation times (5 ns, 6 ns, 7 ns, and 8 ns) were used for the 1–4 layer graphene/PEEK model under the same conditions to obtain the TC when reaching the equilibrium state. Fig. 5(b) shows the temperature gradient diagram of the graphene/PEEK systems with different layer numbers while reaching the equilibrium state of thermal transfer, satisfying the temperature transfer mode of heating conduction. Fig. 5(c) shows the variation in the TC of graphene/PEEK composites with different layer numbers of graphene. The TC of the graphene/PEEK composites increases first, reaching a peak value at 3 graphene layers with a maximum TC of 1.249 ± 0.026 W m−1 K−1, which is approximately 34.6% higher than that of the single-layered graphene/PEEK system. It decreases when the layer number of graphene is 4, at which point the TC is 1.061 ± 0.048 W m−1 K−1, which is 15.1% lower than that of the 3-layer graphene/PEEK system but is still 14.3% higher than that of the single-layer graphene/PEEK system.
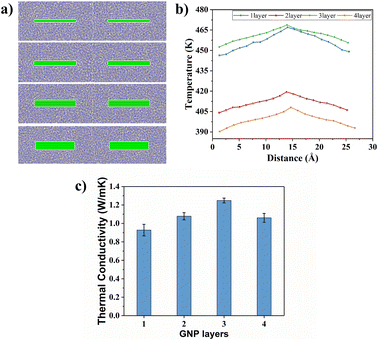 |
| | Fig. 5 (a) Molecular structure model of graphene/PEEK nanocomposites with different graphene layers (1, 2, 3, 4 layers); (b) simulated temperature gradient of graphene/PEEK TC for 1–4 layers; (c) comparison of simulated results of graphene/PEEK TC for 1–4 layers. | |
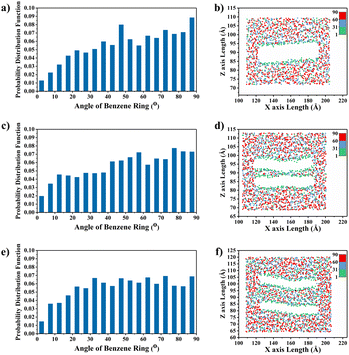
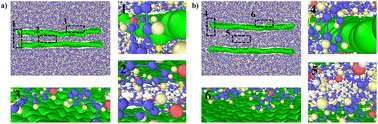
It is widely believed that the enhanced TC is due to the incorporation of a large amount of graphene flakes, which forms a continuous thermal conductive network, while the effect of heat transfer by the matrix is often neglected. The effect of graphene on the PEEK molecular chain during the process of heat transfer is discussed in this section. The angle between the benzene ring within the PEEK molecular chain and the direction of heat transfer (for ease of presentation, the angle between the benzene ring and the direction of heat transfer will be referred to as the orientation angle) can sensitively affect the effective transfer of heat flow, and the closer the angle converges to 0°, the more favorable these channels can benefit the heat transfer in the matrix. The summary of the orientation angle is shown in Fig. 6. The probability distribution of benzene ring orientation angles within the PEEK molecular chain within 15 Å of the graphene surface is provided, as shown in Fig. 7(a), (c), (e) and (g). The probabilities of different benzene ring orientation angles do not change significantly with the increase of layer number, and it can be assumed that the layer number of graphene plays a critical role in enhancing the TC of the polymer. Fig. 7(b), (d), (f) and (h) shows the position distribution of benzene rings with different orientation angles (1° – 31° – 60° – 90°) in the 15 Å range of 1–4 graphene layers. The orientation of the benzene rings near the upper and lower surfaces of graphene (green dots) tends to be more aligned with the direction of heat flow, and the benzene rings away from the upper and lower surfaces of graphene (red and blue dots) are more randomly oriented. In the simulated snapshots (Fig. 8) of 1, 3, 5, and 7, it can be seen that the orientation angle of the benzene ring on the graphene surface is small. Therefore, it can be concluded that the addition of graphene can induce the alignment of the benzene rings in the PEEK molecular chains on its surface, which is more conducive to effective heat transfer and reduces energy loss.
 |
| | Fig. 6 Schematic diagram of the angle between the twisted form of the benzene ring within the PEEK molecular chain and the direction of heat flow transfer. | |
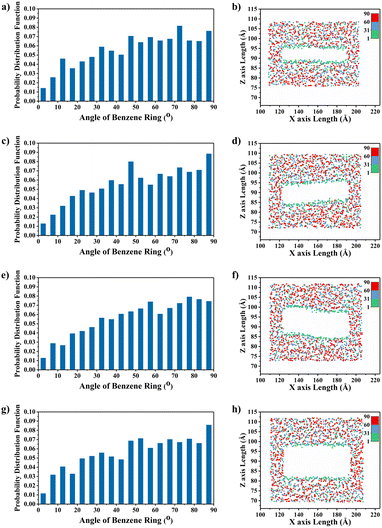 |
| | Fig. 7 Probability distribution function of the angle of the benzene ring within the PEEK in the 15 Å range for different layers of graphene: (a) 1-layer graphene, (c) 2-layer graphene, (e) 3-layer graphene, (g) 4-layer graphene; location distribution of the angle of the benzene ring within the PEEK in the 15 Å range for different layers of graphene: (b) 1-layer graphene, (d) 2-layer graphene, (f) 3-layer graphene, (h) 4-layer graphene. | |
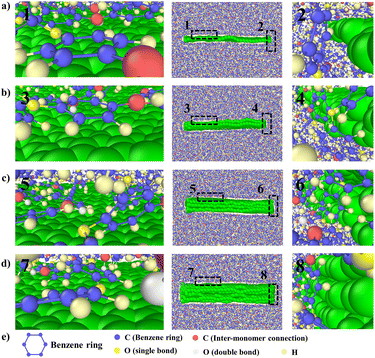 |
| | Fig. 8 Graphene/PEEK simulation snapshot: (a) 1-layer graphene, (b) 2-layer graphene, (c) 3-layer graphene, (d) 4-layer graphene; 1, 3, 5, 7 are the benzene ring shapes on the surface of graphene, 2, 4, 6, 8 are the benzene ring shapes of graphene ends; (e) description of the atomic information in the snapshot. | |
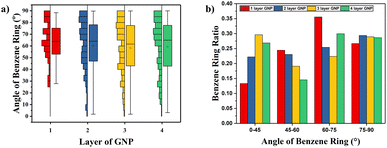
According to the results in Fig. 5(c), graphene/PEEK composite shows a decrease in TC when four layers of graphene are packed together. To explore the reason for this decrease, the ratio of the orientation of benzene rings within the range of 15 Å around the graphene ends of different layers is summarized, as shown in Fig. 9(a). The ratio of benzene rings at the end of 2–4 layers of graphene with an orientation angle of 0–25° is higher than that at the end of a single layer of graphene, which further supports the conclusion that the increase in the number of graphene layers can enhance the TC of graphene/PEEK system. In Fig. 9(b), the ratio of benzene rings at the ends of 2–4 layers of graphene within 75–90° is not significantly different, while the ratio of benzene rings at the ends of 4 layers of graphene in the range of 60–75° is significantly higher than the ratio of benzene rings around the ends of 2–3 layers of graphene, and the orientation angle is larger, thus causing the decrease in TC for a four-layers graphene/PEEK composite. In the simulated snapshots (Fig. 8) of 2, 4, 6, 8, it can be seen that the larger orientation angle of the benzene ring at the end of the graphene.
 |
| | Fig. 9 (a) Probability distribution of the angle of the phenyl ring inside the PEEK in the range of 15 Å at the end position of different layers of graphene; (b) statistical comparison of the angle of the phenyl ring inside the PEEK in the range of 15 Å at the end position of different layers of graphene at different angles. | |
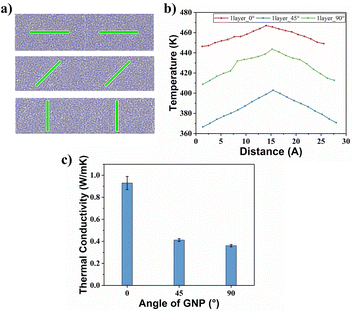
4.3 Configuration angles of graphene
The effect of different deflection angles of graphene on the TC of graphene/PEEK composites needs to be discussed as graphene is randomly distributed in real conditions. As shown in Fig. 10(a), we modeled graphene/PEEK composites with three different graphene deflection angles of 0°, 45°, and 90° and performed TC simulations with different time lengths (5 ns, 6 ns, 7 ns, and 8 ns) under the same conditions as described in the above sections. Fig. 10(b) shows the temperature gradient diagram of the graphene/PEEK system with different graphene angles while reaching the equilibrium state of TC simulation, which satisfies the temperature transfer mode of heat conduction. Fig. 10(c) shows the variation in TC of graphene/PEEK composites under three different deflection angles of graphene. As the graphene angle gradually changes to 90°, the angle between graphene and heat flow direction gradually increases, and the TC of the graphene/PEEK composite gradually decreases. The TC was 0.361 ± 0.011 W m−1 K−1 when the graphene was perpendicular to the heat flow direction, which was only 39% of the TC when the graphene deflection angle was aligned with the heat flow. However, even with a perpendicular configuration, this configuration still shows a higher TC than the pure PEEK material. The addition of graphene increases the TC of graphene/PEEK composites regardless of the direction of graphene, but the angle between the graphene and the heat flow direction can sensitively affect the TC. The smaller angle between the graphene and the heat flow direction will lead to a greater TC.
 |
| | Fig. 10 (a) Molecular structure models of graphene/PEEK nanocomposites with different graphene angle distributions (0°, 45°, 90°); (b) simulated temperature gradients of graphene/PEEK TC with different graphene angle distributions; (c) comparative results of graphene/PEEK TC simulations with different graphene angle distributions. | |
In order to explain the mechanisms how this deflection angle changes the heat transfer in the composites, the angle of the benzene rings in the PEEK molecular chains around graphene surface is summarized with respect to the direction of heat flow. The probability distribution of the orientation angle in the range of 15 Å away from the graphene is calculated, as shown in Fig. 11(a), (c) and (e). As the deflection angle of graphene gradually increases, the proportion of small-angle benzene rings within the PEEK molecular chains around graphene gradually decreases, and the proportion of large-angle benzene rings gradually increases, which is more negative to the effective transfer of heat flow. Fig. 11(b), (d) and (f) shows the position distribution of benzene rings with different orientation angles in the range of 15 Å away from the graphene surface. It can be found that the addition of graphene induces the twist of benzene rings within the PEEK molecular chain aligned with its own angle. For example, graphene flakes with a deflection angle of 45° will motivate the benzene ring angles to fall in the range of 40–50°, resulting in a heat flow transfer path that is not aligned with the direction of heat flow, increasing the loss of energy. Similarly, the orientation angle around the graphene with a deflection angle of 90° is also approximately 90°, making the heat flow transfer path perpendicular to the heat flow direction, which results in even greater energy loss, leading to further reduction of TC. In the simulated snapshots (Fig. 12), it can be seen that the orientation angle of the benzene ring on the graphene surface is consistent with the graphene deflection direction.
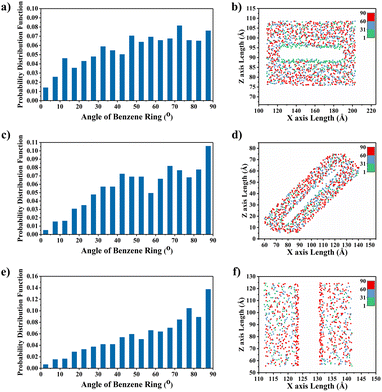 |
| | Fig. 11 Probability distribution functions of the angle between the benzene ring and the heat flow transfer direction within PEEK in the 15 Å range of graphene at different angles: (a) 0° graphene, (c) 45° graphene, (e) 90° graphene; distribution of the benzene ring position between the angle between the benzene ring and the heat flow transfer direction within PEEK in the 15 Å range of graphene at different angles: (b) 0° graphene, (d) 45° graphene, (f) 90° graphene. | |
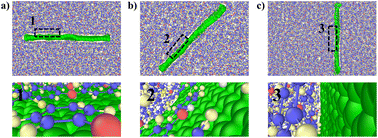 |
| | Fig. 12 Graphene/PEEK simulation snapshot: (a) 0° graphene, (b) 45° graphene, (c) 90° graphene; 1, 2, 3 are the benzene ring shapes on the surface of graphene with different deflection angles. | |
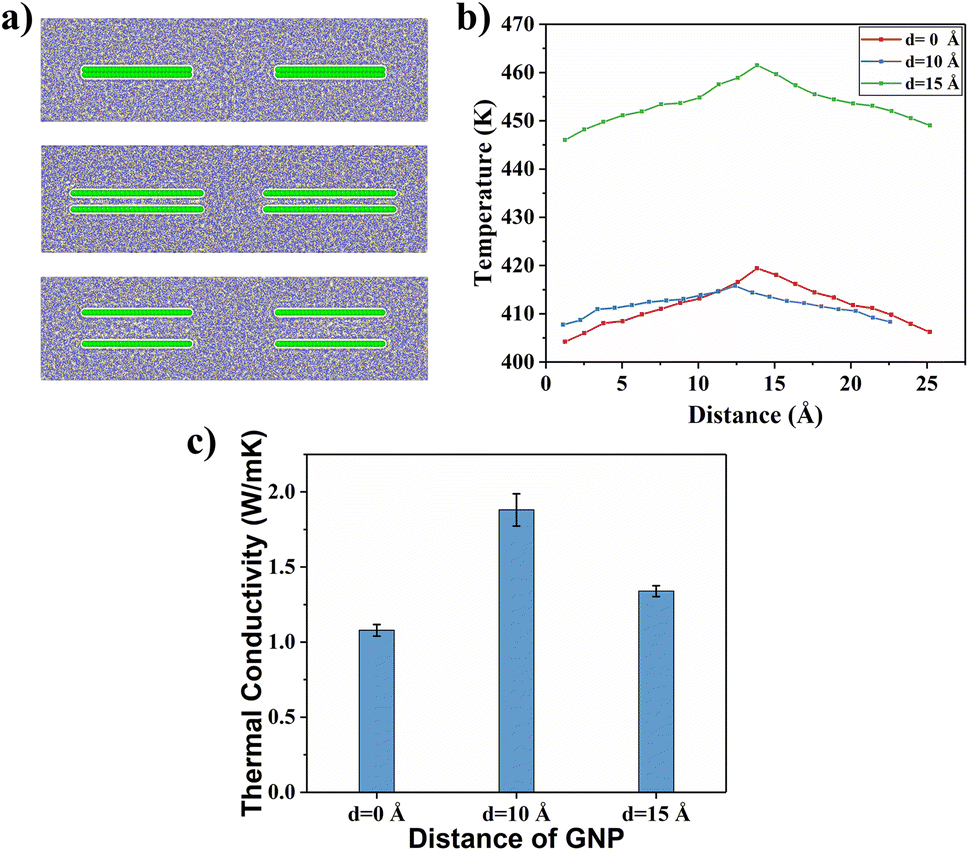
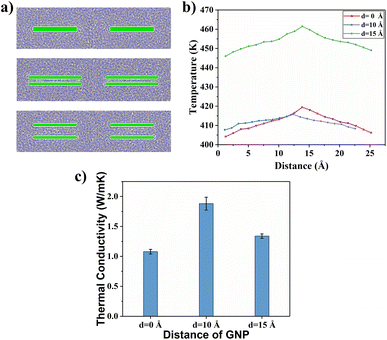
4.4 Spacing between graphene layers
The effect of spacing between graphene layers on the TC of the composites for a bilayer graphene/PEEK composites structure needs to be discussed. As shown in Fig. 13(a), three different interlayer distances (d = 0 Å, d = 10 Å, and d = 15 Å) were modeled, and TC simulations of different durations (5 ns, 6 ns, 7 ns, and 8 ns) were performed under the same conditions, as described in above sections. Fig. 13(b) shows the temperature gradient diagram of the graphene/PEEK system for these different cases while reaching the equilibrium state of TC simulation, which satisfies the temperature transfer mode of heat conduction. Fig. 13(c) shows the variation in TC of the graphene/PEEK composites at three different interlayer distances. The graphene/PEEK composite at d = 10 Å has the highest TC of 1.881 ± 0.107 W m−1 K−1, which is nearly 74.49% higher than that of the graphene/PEEK composite at d = 0 Å. The TC of the graphene/PEEK composite at d = 15 Å is 1.339 ± 0.036 W m−1 K−1, which is nearly 24.21% higher than that of the graphene/PEEK composite at d = 0 Å. The TC of the composite can be improved by mediating the spacing between the graphene layers within the truncation radius (12.5 Å), but the TC decreases when the interlayer distance of graphene is larger than the truncation radius.
 |
| | Fig. 13 (a) Molecular structure model of graphene/PEEK composites with different spacing of bilayer graphene (d = 0 Å, d = 10 Å, d = 15 Å); (b) simulated temperature gradient of TC of graphene/PEEK composites with different spacings of bilayer graphene; (c) comparison of TC simulation results of graphene/PEEK composites with different spacings of bilayer graphene. | |
To further understand the efficiency of different interlayer distances on the enhancement of TC of graphene/PEEK composites, the probability distribution of the orientation angle of the benzene rings within 15 Å around graphene is summarized, as shown in Fig. 14(a), (c) and (e). As the interlayer distance of graphene increases, the proportion of benzene rings with low orientation angles (less than 15°) is enhanced, which improves the efficiency of heat flow transfer. When the interlayer distance exceeds the truncation radius, the proportion of benzene rings with low orientation angles (less than 15°) decreases, but it is still higher than the proportion of benzene rings with a small orientation angle when the interlayer distance of graphene is 0 Å. Fig. 14(b), (d) and (f) shows the distribution of the orientation angles within 15 Å from the surface of graphene at different interlayer distances. It can be found that the bilayer graphene structure (with interlayer distances of 10 Å and 15 Å) can form four regions of benzene rings (green dots). The larger the proportion of benzene rings with low orientation angles, the easier heat transfers in the material, thus enhancing the TC of the composite. At a graphene interlayer distance of 15 Å, the benzene ring structure between graphene layers is more in the range of 30–90° (blue and red dots), while the benzene ring structure between graphene layers at a graphene interlayer distance of 10 Å is more in the range of 0–30°, which further explains the higher TC results at a graphene interlayer distance smaller than the truncation radius than at a graphene interlayer distance larger than the truncation radius. The benzene ring orientation of graphene surface and interlayer can be shown in the simulation snapshot (Fig. 15).
 |
| | Fig. 14 Probability distribution functions of the phenyl ring angles within PEEK in the 15 Å range for different pitch bilayer graphene: (a) d = 0 Å bilayer graphene, (c) d = 10 Å bilayer graphene, (e) d = 15 Å bilayer graphene; distribution of the phenyl ring positions of the phenyl ring angles within PEEK in the 15 Å range for different pitch bilayer graphene: (b) d = 0 Å bilayer graphene, (d) d = 10 Å bilayer graphene, (f) d = 15 Å bilayer graphene. | |
 |
| | Fig. 15 Graphene/PEEK simulation snapshot: (a) d = 10 Å bilayer graphene, (b) d = 15 Å bilayer graphene; 1, 4 are the benzene ring shapes of graphene ends, 2, 5 are the benzene ring shape of graphene interlayer, 3, 6 are the benzene ring shapes on the surface of graphene. | |
In order to explain the variability of the interlayer distance of graphene on the TC enhancement when the spacing is smaller than the truncation radius and larger than the truncation radius, the ratio of the orientation of benzene rings within the range of 15 Å around the graphene ends of different interlayer distances was calculated, as shown in Fig. 16(a). The proportions of benzene rings with lower orientation angles around both ends of graphene at both d = 10 Å and d = 15 Å interlayer distances are higher than the proportions of benzene rings with lower orientation angles around both ends of graphene at d = 0 Å. The higher the proportion of benzene rings with low orientation angles, the greater the enhancement of energy transfer efficiency, which explains why the graphene layering further enhances the TC of the composite. In Fig. 16(b), it can be found that the proportion of benzene rings with interlayer distance between graphene layers smaller than the truncation radius (d = 10 Å) is larger at benzene ring orientation angles less than 30°, while the proportion of benzene rings with interlayer distance between graphene layers larger than the truncation radius (d = 15 Å) is larger at benzene ring orientation angles greater than 30°. The benzene ring orientation of graphene ends can be seen in the simulation snapshot (Fig. 15). The larger this proportion of benzene rings with large orientation angles in the PEEK matrix, the more difficult the heat flow transfer becomes, resulting in the TC of the graphene/PEEK composites at d = 15 Å is less than the TC of the graphene/PEEK composites at d = 10 Å. This further indicates that a lower orientation angle of the benzene ring is more favorable for heat flow transfer, resulting in a more significant increase in TC.
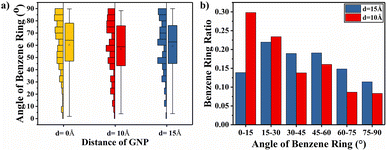 |
| | Fig. 16 (a) Probability distribution of the angle between the benzene rings inside the polyether ether ketone and the heat flow transfer direction in the range of 15 Å at the end position of bilayer graphene with different pitches; (b) statistical comparison of the angle between the benzene ring inside the polyether ether ketone and the heat flow transfer direction in the range of 15 Å at the end position of bilayer graphene with different pitches at different angles. | |
5. Conclusions
In this study, molecular dynamics (MD) method was used to explain the physical mechanisms of thermal transfer in graphene/PEEK nanocomposites, which helps to understand the enhancement TC by graphene. The accuracy of the MD prediction of the TC was validated by experimental characterizations. Further analysis showed that increasing the number of graphene layers can improve the TC of the nanocomposites. The larger the angle of deflection of graphene with respect to the direction of heat flow, the less favorable the effective heat transfer happens, thus reducing the TC of the nanocomposites. The interlayer distance of the bilayer graphene structure has the most significant improvement on the TC of the nanocomposites when it is smaller than the truncation radius (d = 10 Å). In addition, the addition of graphene affects the orientation of the benzene ring within the nearby PEEK molecular chain. When the benzene ring orientation is more aligned with the heat flow transfer direction, the energy transfer is more efficient, resulting in a significant improvement in TC.
In summary, this work provides a further understanding of the role of nanofillers in the heat transfer properties of nanocomposites. In real engineering applications, nanofillers in prepared nanocomposites can have different number of layers, arrangements (angles and positions), and interlayer spacings, and nanofillers can affect the molecular structure orientation of the matrix. All these factors have a synergistic effect on the heat transfer properties of nanocomposites; therefore, the TC measurements of nanocomposites with the same nanofiller content can show inconsistent results. Although further analysis is needed, the observations of this work also indicate that both the distribution pattern of the nanofillers and their influence on the molecular structure of the matrix are of non-negligible importance to the TC enhancement effect of the nanocomposites.
Author contributions
Dongyu Li: conceptualization, methodology, validation, writing – original draft. Tong Li: conceptualization, methodology, funding acquisition, writing – review & editing, supervision. Zebei Mao: conceptualization, methodology, validation. Yahui Zhang: methodology, writing – review & editing. Bo Wang: funding acquisition, writing – review & editing, supervision.
Conflicts of interest
The authors declare that they have no known competing financial interests or personal relationships that could have appeared to influence the work reported in this paper.
Acknowledgements
T. L. and B. W. would like to thank the support from the National Natural Science Foundation of China (12172077, 11825202).
Notes and references
- S. Zhai, P. Zhang, Y. Xian, J. Zeng and B. Shi, Int. J. Heat Mass Transfer, 2018, 117, 358–374 CrossRef CAS.
- S. Li, Q. Zheng, Y. Lv, X. Liu, X. Wang, P. Y. Huang, D. G. Cahill and B. Lv, Science, 2018, 361, 579–581 CrossRef CAS PubMed.
- F. Tian and Z. Ren, Angew Chem. Int. Ed. Engl., 2019, 58, 5824–5831 CrossRef CAS PubMed.
- Y. Zhang, Y.-J. Heo, Y.-R. Son, I. In, K.-H. An, B.-J. Kim and S.-J. Park, Carbon, 2019, 142, 445–460 CrossRef CAS.
- A. L. Moore and L. Shi, Mater. Today, 2014, 17, 163–174 CrossRef CAS.
- L. Wang, H. Qiu, C. Liang, P. Song, Y. Han, Y. Han, J. Gu, J. Kong, D. Pan and Z. Guo, Carbon, 2019, 141, 506–514 CrossRef CAS.
- C. Fu, C. Yan, L. Ren, X. Zeng, G. Du, R. Sun, J. Xu and C.-P. Wong, Compos. Sci. Technol., 2019, 177, 118–126 CrossRef CAS.
- X. Yang, Y. Guo, X. Luo, N. Zheng, T. Ma, J. Tan, C. Li, Q. Zhang and J. Gu, Compos. Sci. Technol., 2018, 164, 59–64 CrossRef CAS.
- H. Chen, V. V. Ginzburg, J. Yang, Y. Yang, W. Liu, Y. Huang, L. Du and B. Chen, Prog. Polym. Sci., 2016, 59, 41–85 CrossRef CAS.
- X. Xu, J. Zhou and J. Chen, Adv. Funct. Mater., 2020, 30, 1904704 CrossRef CAS.
- S. Paszkiewicz, A. Szymczyk, D. Pawlikowska, J. Subocz, M. Zenker and R. Masztak, Nanomaterials, 2018, 8, 264 CrossRef PubMed.
- B. Maira, K. Takeuchi, P. Chammingkwan, M. Terano and T. Taniike, Compos. Sci. Technol., 2018, 165, 259–265 CrossRef CAS.
- Y. Guo, L. Pan, X. Yang, K. Ruan, Y. Han, J. Kong and J. Gu, Composites, Part A, 2019, 124, 105484 CrossRef CAS.
- S. Shen, A. Henry, J. Tong, R. Zheng and G. Chen, Nat. Nanotechnol., 2010, 5, 251–255 CrossRef CAS PubMed.
- J. Chen, X. Huang, B. Sun, Y. Wang, Y. Zhu and P. Jiang, ACS Appl. Mater. Interfaces, 2017, 9, 30909–30917 CrossRef CAS PubMed.
- A. R. J. Hussain, A. A. Alahyari, S. A. Eastman, C. Thibaud-Erkey, S. Johnston and M. J. Sobkowicz, Appl. Therm. Eng., 2017, 113, 1118–1127 CrossRef CAS.
- Z. Han and A. Fina, Prog. Polym. Sci., 2011, 36, 914–944 CrossRef CAS.
- D. D. L. Chung, Appl. Therm. Eng., 2001, 21, 1593–1605 CrossRef CAS.
- H. Song, J. Liu, B. Liu, J. Wu, H.-M. Cheng and F. Kang, Joule, 2018, 2, 442–463 CrossRef CAS.
- Z. Wu, C. Xu, C. Ma, Z. Liu, H. M. Cheng and W. Ren, Adv. Mater., 2019, 31, e1900199 CrossRef PubMed.
- Z. Liu, J. Li and X. Liu, ACS Appl. Mater. Interfaces, 2020, 12, 6503–6515 CrossRef CAS PubMed.
- J. R. Potts, D. R. Dreyer, C. W. Bielawski and R. S. Ruoff, Polymer, 2011, 52, 5–25 CrossRef CAS.
- D. G. Papageorgiou, I. A. Kinloch and R. J. Young, Carbon, 2015, 95, 460–484 CrossRef CAS.
- A. P. A. Raju, A. Lewis, B. Derby, R. J. Young, I. A. Kinloch, R. Zan and K. S. Novoselov, Adv. Funct. Mater., 2014, 24, 2865–2874 CrossRef CAS.
- C. Lee, X. Wei, J. W. Kysar and J. Hone, Science, 2008, 321, 385–388 CrossRef CAS PubMed.
- Y. Zhu, S. Murali, W. Cai, X. Li, J. W. Suk, J. R. Potts and R. S. Ruoff, Adv. Mater., 2010, 22, 3906–3924 CrossRef CAS PubMed.
- K. S. Novoselov, A. K. Geim, S. V. Morozov, D. Jiang, M. I. Katsnelson, I. V. Grigorieva, S. V. Dubonos and A. A. Firsov, Nature, 2005, 438, 197–200 CrossRef CAS PubMed.
- A. A. Balandin, S. Ghosh, W. Bao, I. Calizo, D. Teweldebrhan, F. Miao and C. N. Lau, Nano Lett., 2008, 8, 902–907 CrossRef CAS PubMed.
- J. Dong, C. Yin, X. Zhao, Y. Li and Q. Zhang, Polymer, 2013, 54, 6415–6424 CrossRef CAS.
- X. Wu, H. Li, K. Cheng, H. Qiu and J. Yang, Nanoscale, 2019, 11, 8219–8225 RSC.
- H. Kim and C. W. Macosko, Polymer, 2009, 50, 3797–3809 CrossRef CAS.
- R. J. Young, M. Liu, I. A. Kinloch, S. Li, X. Zhao, C. Vallés and D. G. Papageorgiou, Compos. Sci. Technol., 2018, 154, 110–116 CrossRef CAS.
- L. Yang, S. Zhang, Z. Chen, Y. Guo, J. Luan, Z. Geng and G. Wang, J. Mater. Sci., 2013, 49, 2372–2382 CrossRef.
- A. Martínez-Gómez, S. Quiles-Díaz, P. Enrique-Jimenez, A. Flores, F. Ania, M. A. Gómez-Fatou and H. J. Salavagione, Composites, Part A, 2018, 113, 180–188 CrossRef.
- S. Quiles-Díaz, P. Enrique-Jimenez, D. G. Papageorgiou, F. Ania, A. Flores, I. A. Kinloch, M. A. Gómez-Fatou, R. J. Young and H. J. Salavagione, Composites, Part A, 2017, 100, 31–39 CrossRef.
- P. Enrique-Jimenez, S. Quiles-Díaz, H. J. Salavagione, D. Wesner, H. Schönherr, J. González-Casablanca, R. García-Quismondo, G. Martínez, M. A. Gómez-Fatou, F. Ania and A. Flores, Eur. Polym. J., 2017, 97, 1–13 CrossRef CAS.
- C. Li, H. Guo, X. Tian and X. Tian, J. Therm. Stresses, 2016, 40, 389–401 CrossRef.
- Z. Lule and J. Kim, Composites, Part A, 2019, 124, 105506 CrossRef CAS.
- J. Chen, X. Huang, B. Sun and P. Jiang, ACS Nano, 2019, 13, 337–345 CrossRef CAS PubMed.
- X. Zhang, C. Tan, Y. Ma, F. Wang and W. Yang, Compos. Sci. Technol., 2018, 162, 180–187 CrossRef CAS.
- B. J. Alder and T. E. Wainwright, J. Chem. Phys., 1957, 27, 1208–1209 CrossRef CAS.
- B. Wang, K. Zhang, C. Zhou, M. Ren, Y. Gu and T. Li, RSC Adv., 2019, 9, 12836–12845 RSC.
- K. Zhang, J. Du, M. Ren, B. Wang and T. Li, J. Phys. Chem. B, 2021, 125, 9588–9600 CrossRef CAS PubMed.
- T. Li, Z. Mao, J. Du and Z. Song, Nanomaterials, 2022, 12, 3136 CrossRef CAS PubMed.
- M. Wang, Y. Liu, H. Zhang, Y. Wu and L. Pan, Int. J. Heat Mass Transfer, 2022, 194, 123027 CrossRef CAS.
- S. Plimpton, J. Comput. Phys., 1995, 117, 1–19 CrossRef CAS.
- H. Sun, S. J. Mumby, J. R. Maple and A. T. Hagler, J. Am. Chem. Soc., 2002, 116, 2978–2987 CrossRef.
- S. J. Stuart, A. B. Tutein and J. A. Harrison, J. Chem. Phys., 2000, 112, 6472–6486 CrossRef CAS.
- D. W. Brenner, O. A. Shenderova, J. A. Harrison, S. J. Stuart, B. Ni and S. B. Sinnott, J. Phys.: Condens.Matter, 2002, 14, 783–802 CrossRef CAS.
- H. Zhan, G. Zhang, J. M. Bell, V. B. C. Tan and Y. Gu, Nat. Commun., 2020, 11, 1905 CrossRef CAS PubMed.
- H. Zhan, G. Zhang, Y. Zhang, V. B. C. Tan, J. M. Bell and Y. Gu, Carbon, 2016, 98, 232–237 CrossRef CAS.
- F. Müller-Plathe, J. Chem. Phys., 1997, 106, 6082 CrossRef.
|
| This journal is © The Royal Society of Chemistry 2023 |
Click here to see how this site uses Cookies. View our privacy policy here. 
 Open Access Article
 This Open Access Article is licensed under a Creative Commons Attribution-Non Commercial 3.0 Unported Licence
 *a,
Zebei Maoa,
Yahui Zhangab and
Bo Wangab
*a,
Zebei Maoa,
Yahui Zhangab and
Bo Wangab