 Open Access Article
Asterarcys quadricellulare algae-mediated copper oxide nanoparticles as a robust and recyclable catalyst for the degradation of noxious dyes from wastewater†
Manisha Khandelwala,
Sunita Choudharyb,
Harish b,
Ashok Kumawat
 c,
Kamakhya Prakash Misra
 c,
Devendra Singh Rathore
 d and
Rama Kanwar Khangarot
 *a
*a
aDepartment of Chemistry, University College of Science, Mohanlal Sukhadia University, Udaipur-313001, Rajasthan, India. E-mail: ramakanwar@mlsu.ac.in
bDepartment of Botany, University College of Science, Mohanlal Sukhadia University, Udaipur-313001, Rajasthan, India
cDepartment of Physics, School of Basic Sciences, Manipal University Jaipur, Jaipur-303007, Rajasthan, India
dDepartment of Environmental Sciences, Mohanlal Sukhadia University, Udaipur-313001, Rajasthan, India
First published on 25th September 2023
Abstract
The present article explores the synthesis of copper oxide nanoparticles (CuO NPs) utilizing Asterarcys quadricellulare algal extract and examines the effect of various reaction parameters on the size and morphology of the nanoparticles. The samples were thoroughly characterized using XRD, FTIR, UV-vis, FE-SEM, and EDS techniques. The XRD analysis disclosed that the size of the synthesized nanoparticles could be controlled by adjusting the reaction parameters, ranging from 4.76 nm to 13.70 nm along the highest intensity plane (111). FTIR spectroscopy provided evidence that the phytochemicals are present in the algal extract. We have compared the photocatalytic activity of biologically and chemically synthesized CuO NPs and observed that biologically synthesized CuO NPs showed better photocatalytic activity than chemically synthesized CuO NPs. The biosynthesized CuO NPs (S8) demonstrated outstanding photodegradation activity towards four different organic dyes, namely BBY, BG, EBT, and MG, with degradation percentages of 95.78%, 98.02%, 94.15%, and 96.04%, respectively. The maximum degradation efficacy of 98.02% was observed for the BG dye at optimized reaction conditions and 60 min of visible light exposure. The kinetics of the photodegradation reaction followed the pseudo-first-order kinetic model, and the rate constant (k) was calculated using the Langmuir–Hinshelwood model for each dye. This study provides an efficient and sustainable approach for synthesizing CuO NPs with superior photocatalytic degradation efficiency towards organic dyes.
Introduction
Wastewater treatment is a critical area of research due to its significance in protecting the ecosystem. With the advancement in industrialization and urbanization, the amount of wastewater produced has increased exponentially, leading to the release of harmful pollutants into the ecosystem.1,2 Organic dyes are widely utilized in the textile,3 leather,4 paper,5 and food industries6 and have emerged as one of the significant pollutants in wastewater. These dyes pose a substantial threat to the environment as they are non-biodegradable and can persist for a longer time, leading to water pollution and health hazards due to their toxicity, carcinogenicity, and mutagenicity.7 The commonly used dyes are bismarck brown Y (BBY), brilliant green (BG), eriochrome black T (EBT), malachite green (MG), and so on, which have adverse impacts on the environment. BBY, BG, and MG dyes are used in the dyeing of wool, silk, leather, textile, and paper and also in the preparation of biological stains.8–10 EBT dye is utilized as a complexometric indicator for metal ions in analytical chemistry.11 The presence of these organic dyes in wastewater is associated with severe health hazards, including toxicity to aquatic organisms and potential risks to human health, such as respiratory difficulties, skin irritation, and allergies. Consequently, researchers have focused their efforts on developing methods to eliminate these dyes from water sources in order to mitigate their environmental impact.12 Various chemical and physical methods have been employed to solve the problem, such as coagulation, flocculation, ion exchange, membrane filtration, and adsorption.13 Although these physiochemical approaches are effective in separating the dyes from wastewater, the toxicity of the dyes from the environment is not eliminated completely. Moreover, these physiochemical methods are costly and ineffective, leading to the generation of secondary byproducts requiring additional processing. Over the last decade, photocatalysis has gained attention as a potential method for the efficient degradation of organic dyes from wastewater.14,15 This method involves the use of a photocatalyst, typically composed of metal oxide nanoparticles, to facilitate the breakdown of organic pollutants under the influence of light.16Metallic nanomaterials obtained from earth-abundant and inexpensive metals have gained considerable attention owing to their potential as practicable alternatives to rare and expensive metals such as gold,17 silver,18,19 platinum,20 titanium,21 etc. Among many nanomaterials understudy the copper oxide nanoparticles (CuO NPs) have gained considerable attention due to their desirable physical and chemical properties, including catalytic, optical, electrical, and magnetic properties.22,23 Additionally, having a high surface area to volume ratio, CuO NPs exhibit antibacterial and biocidal properties and are effective in reducing organic pollutants like organic dyes, heavy metals, phenols, nitrogen-containing fertilizers, insecticides, and other agrochemicals.24,25 As a result, researchers have identified CuO NPs as a viable solution for removing organic dyes from wastewater.
Several methods have been developed for the synthesis of CuO NPs, including chemical, physical, and biological approaches. Among these, the biological method is green, reliable, eco-friendly, cost-effective, and novel for the synthesis of CuO NPs.26 The biogenic route of copper-based nanomaterials synthesis includes utilization of plant extracts, viz., root, bark, stem, leaf, flower, fruit, and seed and also microorganisms, for example, algae, bacteria, yeast, virus, and fungi.27 Especially, the use of algae for synthesizing CuO NPs has yet to be extensively studied. Algae contain several bioactive compounds, such as polysaccharides, proteins, and enzymes, that aid in the reduction and stabilization of metal ions, resulting in the synthesis of nanoparticles with high purity and yield.28 Moreover, algal extract offers superior control over the shape and size of the synthesized nanoparticles. Therefore, the algal extract-mediated synthesis of nanoparticles is a promising and sustainable approach for the green synthesis of nanoparticles with potential applications in various fields such as medicine, energy, and environmental remediation.29 There are only a few reports published on the synthesis of CuO NPs using algal extract. In 2014, Abboud et al. synthesized highly stable CuO NPs by utilizing brown algae Bifurcaria bifurcate and studied their antibacterial activity against two different strains of bacteria Staphylococcus aureus and Enterobacter aerogenes.30 Ramaswamy et al. reported the synthesis of CuO NPs using brown algae (Sargassum polycystum) mediated the synthesis of CuO NPs. The synthesized CuO NPs showed good anticancer activity against breast MCF-7 cells.31 Parsaee and co-workers studied the biosynthesis of CuO NPs via ultrasound method utilizing the Cystoseira trinodis algal extract as an eco-friendly and time-saving process. The synthesized NPs were used to study the photocatalytic degradation of methylene blue (MB) dye.32 Banerjee and co-authors synthesized CuO NPs using Anabaena cylindrica algae extract. The also investigated the influence of the concentration of algal extract, pH, stirring speed, and Cu2+ ions concentration on the size and shape of CuO NPs.33 Simultaneously, Rubilar and colleagues studied the synthesis of CuO NPs using protein fraction of brown algae Macrocystis pyrifera.34 In 2021, Kumar et al. reported the Sargassum longifolium algal extract mediated synthesis of CuO NPs and studied their antioxidant and antibacterial properties.35 However, the synthesis of CuO NPs using the Asterarcys quadricellulare is hitherto unreported.
Therefore, the present work aims to explore the synthesis of CuO NPs utilizing Asterarcys quadricellulare algal extract. The effect of various reaction parameters, such as pH, reaction time, the volume of algal extract, and the concentration of copper ions on the size and morphology of CuO NPs were also examined. The synthesized nanoparticles were characterized by different techniques, including XRD, FTIR, UV-vis, and FE-SEM coupled with EDS. Additionally, we have investigated the efficiency of the synthesized CuO NPs in the photocatalytic degradation of commonly used organic dyes, such as BBY, BG, EBT, and MG.
The significance of this research lies in its ability to simultaneously address two major environmental challenges. By employing a green approach for the synthesis of CuO NPs, we have followed the principles of green chemistry, which are essential for a sustainable environment and human health. Algae can have harmful effects on the environment and human health when they grow uncontrollably. Algal blooms can deplete oxygen in the water, create toxins that can harm humans and animals, and upset the natural balance of aquatic ecosystems. Additionally, algal blooms can have a negative economic impact on the fishing and tourism industries and can attach themselves to boats and other structures, causing fouling and damage. Therefore, using algae as a source of nanoparticle synthesis shall help to maintain the balance in the ecosystem by reducing the levels of algae in the environment and mitigating the adverse effects of algae. Furthermore, the elimination of organic dyes, i.e., BBY, BG, EBT, and MG, using the algal-mediated CuO NPs cleans the water bodies by removing noxious dyes from the wastewater. Overall, the research presented here is potentially transformative, offering dual benefits for environmental remediation and sustainability.
Experimental section
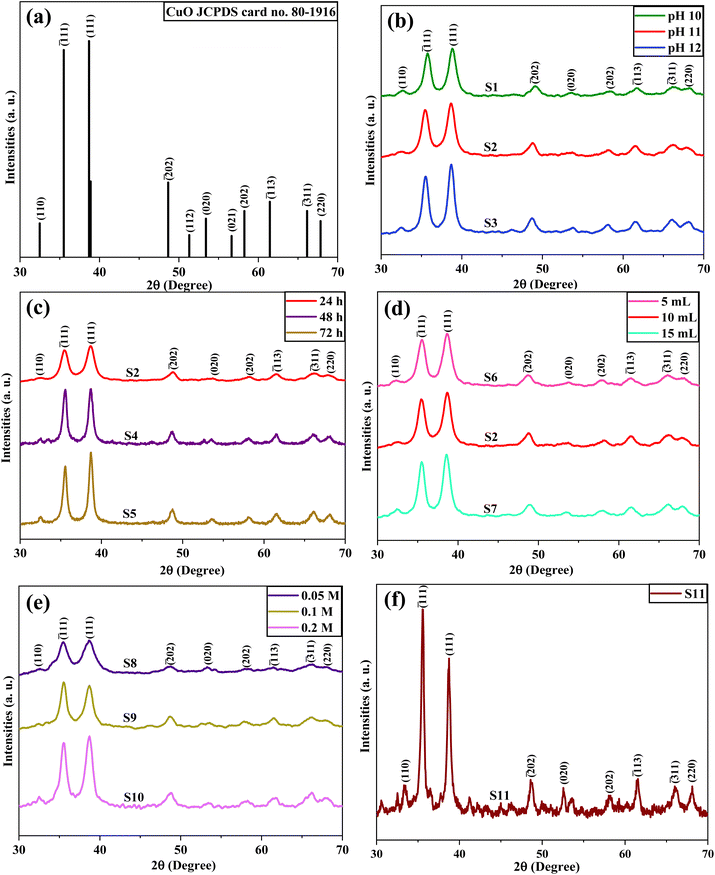
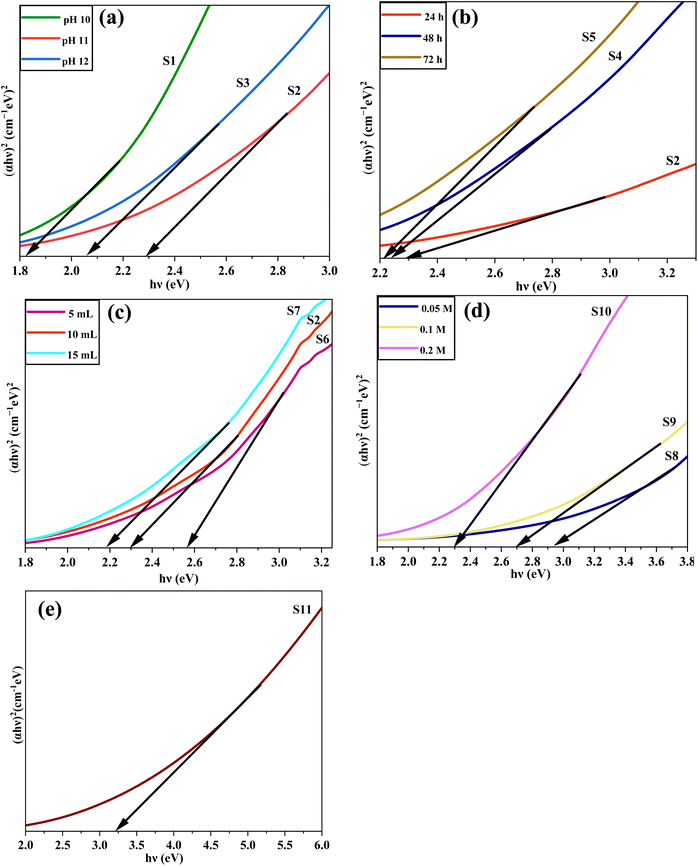
The materials and methods used for the synthesis of CuO NPs and photocatalytic experiments are discussed in detail in the ESI.† The algal-mediated CuO NPs were synthesized by varying single parameter and keeping other parameters constant. The entire manuscript contains some notations for the convenience of the readers. The sample names S1, S2, and S3 were used to denote the synthesized CuO NPs at pH 10, 11, and 12, respectively. The sample names S2, S4, and S5 were used to depict the synthesized CuO NPs at varying reaction time 24 h, 48 h, and 72 h, respectively. The synthesized CuO NPs at the different volumes of algal extract were designated as S6, S2, and S7 for the 5 mL, 10 mL, and 15 mL algal extract volumes, respectively. The S8, S9, and S10 sample names were utilized to denote the synthesized CuO NPs at different concentrations of the copper ions 0.05 M, 0.1 M, and 0.2 M, respectively. Lastly, the S11 sample name was used to represent the chemically synthesized CuO NPs.Results and discussion
Optimization of the biosynthesis of CuO NPs
The impact of the various parameters on the Asterarcys quadricellulare algal extract-mediated green synthesis of CuO NPs was investigated. These parameters were found to be significant in controlling the size and morphology of the biosynthesized CuO NPs. The parameters include the effect of pH, reaction time, the volume of algal extract, and the concentration of copper ions, which will be elaborated upon in the subsequent sections.| S. no. | Sample name | pH | Time | Volume of algal extract | Concentration of copper ions | Temperature | Size of CuO NPs |
|---|---|---|---|---|---|---|---|
| 1 | S1 | 10 | 24 h | 10 mL | 0.2 M | 60 °C | 8.61 nm |
| 2 | S2 | 11 | 24 h | 10 mL | 0.2 M | 60 °C | 8.05 nm |
| 3 | S3 | 12 | 24 h | 10 mL | 0.2 M | 60 °C | 9.41 nm |
| S. no. | Sample name | Time | pH | Volume of algal extract | Concentration of copper ions | Temperature | Size of CuO NPs |
|---|---|---|---|---|---|---|---|
| 1 | S2 | 24 h | 11 | 10 mL | 0.2 M | 60 °C | 8.05 nm |
| 2 | S4 | 48 h | 11 | 10 mL | 0.2 M | 60 °C | 11.64 nm |
| 3 | S5 | 72 h | 11 | 10 mL | 0.2 M | 60 °C | 13.70 nm |
| S. no. | Sample name | Volume of algal extract | pH | Time | Concentration of copper ions | Temperature | Size of CuO NPs |
|---|---|---|---|---|---|---|---|
| 1 | S6 | 5 mL | 11 | 24 h | 0.2 M | 60 °C | 7.34 nm |
| 2 | S2 | 10 mL | 11 | 24 h | 0.2 M | 60 °C | 8.05 nm |
| 3 | S7 | 15 mL | 11 | 24 h | 0.2 M | 60 °C | 8.49 nm |
| S. no. | Sample name | Concentration of copper ions | pH | Time | Volume of algal extract | Temperature | Size of CuO NPs |
|---|---|---|---|---|---|---|---|
| 1 | S8 | 0.05 M | 11 | 24 h | 5 mL | 60 °C | 4.73 nm |
| 2 | S9 | 0.1 M | 11 | 24 h | 5 mL | 60 °C | 6.65 nm |
| 3 | S10 | 0.2 M | 11 | 24 h | 5 mL | 60 °C | 7.62 nm |
Proposed mechanism for Asterarcys quadricellulare algal-mediated green synthesis of CuO NPs
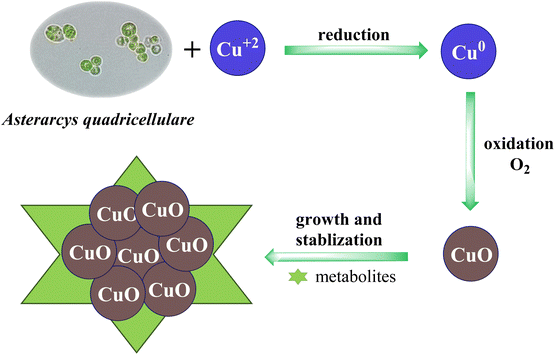
The synthesis of CuO NPs using Asterarcys quadricellulare algae proceeded via two steps, i.e., reduction and oxidation, through the action of algal biomass or its metabolites such as carbohydrates, proteins, enzymes, and lipids. In the first step, metabolites function as a reducing agent and transform the Cu2+ ions to Cu0. In the second step, the Cu0 formed in the first step undergo oxidation to form CuO NPs. The oxidation process was initiated by the dissolved oxygen present in the reaction medium. The subsequent crystal growth continued until the CuO NPs attained a stable size and morphology.37,38 The metabolites also act as a capping and stabilizing agent in the agglomeration of CuO NPs. The plausible mechanism of CuO NPs synthesis using Asterarcys quadricellulare algae is illustrated in Fig. 1.Characterization techniques
![[1 with combining macron]](https://www.rsc.org/images/entities/char_0031_0304.gif) 11), (111), (
11), (111), (![[2 with combining macron]](https://www.rsc.org/images/entities/char_0032_0304.gif) 02), (020), (202), (
02), (020), (202), (![[1 with combining macron]](https://www.rsc.org/images/entities/char_0031_0304.gif) 13), (
13), (![[3 with combining macron]](https://www.rsc.org/images/entities/char_0033_0304.gif) 11), and (220) planes, respectively. The XRD peaks were well indexed with the standard JCPDS card no. 80-1916 (Fig. 2a).39 These results indicate that the CuO NPs have a polycrystalline nature, monoclinic structure, and end-centered lattice. No additional peak was observed in all samples, which indicated that the synthesized CuO NPs were phase pure.
11), and (220) planes, respectively. The XRD peaks were well indexed with the standard JCPDS card no. 80-1916 (Fig. 2a).39 These results indicate that the CuO NPs have a polycrystalline nature, monoclinic structure, and end-centered lattice. No additional peak was observed in all samples, which indicated that the synthesized CuO NPs were phase pure.
Upon conducting a thorough analysis of the major XRD peaks, it was observed that there was a slight shift in the 2θ values on a variation of the reaction parameters. Fig. S1† displays a plot of the diffraction angles corresponding to prominent peaks of (![[1 with combining macron]](https://www.rsc.org/images/entities/char_0031_0304.gif) 11) and (111) planes against the sample names. The influence of pH, reaction time, algal extract volume, and copper salt ions concentration on the 2θ values was observed. The analysis showed that the 2θ values initially decreased when the pH increased from 10 to 11, and then the 2θ values increased as the pH reached 12. An increase in the reaction time resulted in elevated 2θ values along both major crystallographic planes (
11) and (111) planes against the sample names. The influence of pH, reaction time, algal extract volume, and copper salt ions concentration on the 2θ values was observed. The analysis showed that the 2θ values initially decreased when the pH increased from 10 to 11, and then the 2θ values increased as the pH reached 12. An increase in the reaction time resulted in elevated 2θ values along both major crystallographic planes (![[1 with combining macron]](https://www.rsc.org/images/entities/char_0031_0304.gif) 11) and (111). This could be attributed to the growth of the crystal lattice structure with prolonged reaction time. Furthermore, with the enhancement of algal extract volume, the 2θ values decreased along (
11) and (111). This could be attributed to the growth of the crystal lattice structure with prolonged reaction time. Furthermore, with the enhancement of algal extract volume, the 2θ values decreased along (![[1 with combining macron]](https://www.rsc.org/images/entities/char_0031_0304.gif) 11) plane and increased along (111) plane. It was observed that an increase in Cu2+ ions concentration resulted in an increase in the 2θ values along the (
11) plane and increased along (111) plane. It was observed that an increase in Cu2+ ions concentration resulted in an increase in the 2θ values along the (![[1 with combining macron]](https://www.rsc.org/images/entities/char_0031_0304.gif) 11). However, for the (111) plane, the 2θ values first decreased and then increased with increasing Cu2+ ions concentration.
11). However, for the (111) plane, the 2θ values first decreased and then increased with increasing Cu2+ ions concentration.
 | (1) |
The intensities of crystallographic planes with Miller indices (hkl) are denoted by I(hkl), and their corresponding γ(hkl) values are listed in Table 5. The increase in the pH value degraded the crystal growth of CuO NPs along the (110) plane and improved it along the (111) plane, as indicated by γ(hkl) values. The γ(hkl) values with an increase in the reaction time enhanced along the (111) plane and degrade along the (110) plane. With the increase in the algal extract volume the crystal growth reduced along the (111) plane. The random variation of γ(hkl) along other crystallographic planes and factors indicated the random growth and distribution of particles.
| Orientation parameters (γ(hkl)) | |||||||||
|---|---|---|---|---|---|---|---|---|---|
| Sample name | (110) | (![[1 with combining macron]](https://www.rsc.org/images/entities/char_0031_0304.gif) 11) 11) |
(111) | (![[2 with combining macron]](https://www.rsc.org/images/entities/char_0032_0304.gif) 02) 02) |
(020) | (202) | (![[1 with combining macron]](https://www.rsc.org/images/entities/char_0031_0304.gif) 13) 13) |
(![[3 with combining macron]](https://www.rsc.org/images/entities/char_0033_0304.gif) 11) 11) |
(220) |
| S1 | 0.0799 | 0.1888 | 0.2166 | 0.0955 | 0.0751 | 0.0789 | 0.0853 | 0.0933 | 0.0864 |
| S2 | 0.0677 | 0.2000 | 0.2310 | 0.0956 | 0.0640 | 0.0764 | 0.0882 | 0.0901 | 0.0863 |
| S3 | 0.0618 | 0.2175 | 0.2501 | 0.0878 | 0.0640 | 0.0740 | 0.0806 | 0.0844 | 0.0795 |
| S4 | 0.0557 | 0.2675 | 0.2700 | 0.0848 | 0.0525 | 0.0569 | 0.0739 | 0.0738 | 0.0647 |
| S5 | 0.0524 | 0.2565 | 0.3129 | 0.0829 | 0.0439 | 0.0509 | 0.0647 | 0.0734 | 0.0621 |
| S6 | 0.0775 | 0.2146 | 0.2351 | 0.0865 | 0.0673 | 0.0698 | 0.0839 | 0.0865 | 0.0788 |
| S7 | 0.0806 | 0.2015 | 0.2107 | 0.0857 | 0.0775 | 0.0725 | 0.0837 | 0.1005 | 0.0872 |
| S8 | 0.0809 | 0.1785 | 0.1985 | 0.0934 | 0.0917 | 0.0826 | 0.0867 | 0.0992 | 0.0884 |
| S9 | 0.0745 | 0.2192 | 0.1948 | 0.0952 | 0.0738 | 0.0767 | 0.0945 | 0.0886 | 0.0826 |
| S10 | 0.0857 | 0.2013 | 0.1994 | 0.0964 | 0.0727 | 0.0788 | 0.0860 | 0.0947 | 0.0848 |
| S11 | 0.0745 | 0.2677 | 0.2133 | 0.0824 | 0.0722 | 0.0620 | 0.0824 | 0.0716 | 0.0734 |
 | (2) |
| Crystallite size (tS) (nm) | |||||||||||
|---|---|---|---|---|---|---|---|---|---|---|---|
| Sample name | (110) | (![[1 with combining macron]](https://www.rsc.org/images/entities/char_0031_0304.gif) 11) 11) |
(111) | (![[2 with combining macron]](https://www.rsc.org/images/entities/char_0032_0304.gif) 02) 02) |
(020) | (202) | (![[1 with combining macron]](https://www.rsc.org/images/entities/char_0031_0304.gif) 13) 13) |
(![[3 with combining macron]](https://www.rsc.org/images/entities/char_0033_0304.gif) 11) 11) |
(220) | tWH | Microstrain (ε) |
| S1 | 6.12 | 8.59 | 8.61 | 6.38 | 28.51 | 25.58 | 7.62 | 7.66 | 9.16 | 6.00 | −0.0089 |
| S2 | 4.46 | 7.24 | 8.05 | 6.25 | 4.73 | 10.88 | 9.48 | 4.14 | 18.40 | 4.51 | −0.0114 |
| S3 | 5.55 | 9.51 | 9.41 | 6.56 | 8.29 | 6.43 | 6.77 | 5.34 | 9.51 | 13.07 | 0.0118 |
| S4 | 3.05 | 12.43 | 11.64 | 6.95 | 1.88 | 2.64 | 6.17 | 4.86 | 4.46 | 8.66 | 0.0196 |
| S5 | 4.33 | 13.18 | 13.70 | 8.92 | 4.30 | 4.34 | 6.16 | 6.88 | 5.37 | 12.48 | 0.0130 |
| S6 | 7.20 | 7.11 | 7.34 | 5.12 | 3.84 | 8.04 | 3.77 | 16.59 | 7.20 | 8.35 | 0.0074 |
| S7 | 7.14 | 9.11 | 8.49 | 5.24 | 11.46 | 4.37 | 5.24 | 11.35 | 4.26 | 16.70 | 0.0151 |
| S8 | 5.52 | 6.18 | 4.73 | 2.85 | 6.56 | 2.74 | 3.38 | 4.07 | 4.71 | 8.77 | 0.0206 |
| S9 | 12.58 | 10.33 | 6.65 | 7.13 | 5.16 | 2.56 | 8.00 | 3.79 | 9.60 | 13.86 | 0.0288 |
| S10 | 7.59 | 9.50 | 7.62 | 6.90 | 13.54 | 11.98 | 9.10 | 5.81 | 8.04 | 8.83 | 0.0010 |
| S11 | 17.16 | 20.48 | 17.68 | 14.46 | 19.07 | 11.08 | 13.53 | 9.66 | 12.43 | 86.62 | 0.0095 |
 | (3) |
| δ(hkl) × 1015 m−2 | |||||||||
|---|---|---|---|---|---|---|---|---|---|
| Sample name | (110) | (![[1 with combining macron]](https://www.rsc.org/images/entities/char_0031_0304.gif) 11) 11) |
(111) | (![[2 with combining macron]](https://www.rsc.org/images/entities/char_0032_0304.gif) 02) 02) |
(020) | (202) | (![[1 with combining macron]](https://www.rsc.org/images/entities/char_0031_0304.gif) 13) 13) |
(![[3 with combining macron]](https://www.rsc.org/images/entities/char_0033_0304.gif) 11) 11) |
(220) |
| S1 | 0.0267 | 0.0135 | 0.0135 | 0.0246 | 0.0012 | 0.0015 | 0.0172 | 0.0170 | 0.0119 |
| S2 | 0.0503 | 0.0191 | 0.0154 | 0.0256 | 0.0447 | 0.0084 | 0.0111 | 0.0583 | 0.0029 |
| S3 | 0.0325 | 0.0110 | 0.0113 | 0.0232 | 0.0145 | 0.0242 | 0.0218 | 0.0351 | 0.0111 |
| S4 | 0.1075 | 0.0065 | 0.0074 | 0.0207 | 0.2829 | 0.1435 | 0.0263 | 0.0423 | 0.0503 |
| S5 | 0.0533 | 0.0057 | 0.0053 | 0.0126 | 0.0541 | 0.0531 | 0.0263 | 0.0211 | 0.0347 |
| S6 | 0.0192 | 0.0198 | 0.0186 | 0.0381 | 0.0678 | 0.0155 | 0.0704 | 0.0036 | 0.0193 |
| S7 | 0.0196 | 0.0120 | 0.0139 | 0.0364 | 0.0076 | 0.0524 | 0.0364 | 0.0078 | 0.0551 |
| S8 | 0.0328 | 0.0262 | 0.0447 | 0.1231 | 0.0232 | 0.1332 | 0.0875 | 0.0604 | 0.0451 |
| S9 | 0.0063 | 0.0094 | 0.0226 | 0.0197 | 0.0375 | 0.1526 | 0.0156 | 0.0697 | 0.0108 |
| S10 | 0.0173 | 0.0111 | 0.0172 | 0.0210 | 0.0054 | 0.0070 | 0.0121 | 0.0296 | 0.0155 |
| S11 | 0.0034 | 0.0024 | 0.0032 | 0.0048 | 0.0027 | 0.0081 | 0.0055 | 0.0107 | 0.0065 |
There is no definite trend of the variation of (δ(hkl)) along any crystallographic plane.
![[thin space (1/6-em)]](https://www.rsc.org/images/entities/char_2009.gif) cos
cos![[thin space (1/6-em)]](https://www.rsc.org/images/entities/char_2009.gif) θ on the y-axis and sin
θ on the y-axis and sin![[thin space (1/6-em)]](https://www.rsc.org/images/entities/char_2009.gif) θ on the x-axis, and a linear fit was applied to the curve to compare it with the given eqn (4) (ref. 42) (Fig. S2†).
θ on the x-axis, and a linear fit was applied to the curve to compare it with the given eqn (4) (ref. 42) (Fig. S2†).
 | (4) |
The equation of the trend-line fit, along with the regression factor (R2), was presented in the inset of the W–H plot for each sample in Fig. S2.† However, it should be noted that the W–H plot is known to neglect several factors, which can result in poor goodness of fit. This is evident from the data points being far away from the trend-line fit, and the uncertainties being represented by the standard error bars. As a result, lower values of the regression factors were observed for all the samples. The constant C was taken as 0.9, and the correction factor was used in the equation to account for any deviations from the ideal model. Overall, the W–H plot provides an approximate evaluation of the impact of strain on crystallite size, but the results should be interpreted with caution due to the limitations of the method.
The average crystallite size (tWH) and the microstrain obtained by performing the W–H plot are already listed in Table 6. The initial two samples (S1–S2) show the compressive strain, and thereafter (S3–S11), its nature changes to tensile. It was noticed that the higher microstrain caused a larger difference between the crystallite sizes obtained by two methods (tS and tWH). The strongest intensity peak, i.e., (111), was taken to compare both crystallite sizes. The sample with the lowest amount of microstrain had close values of tS and tWH, and that with the largest one had farther tS and tWH.
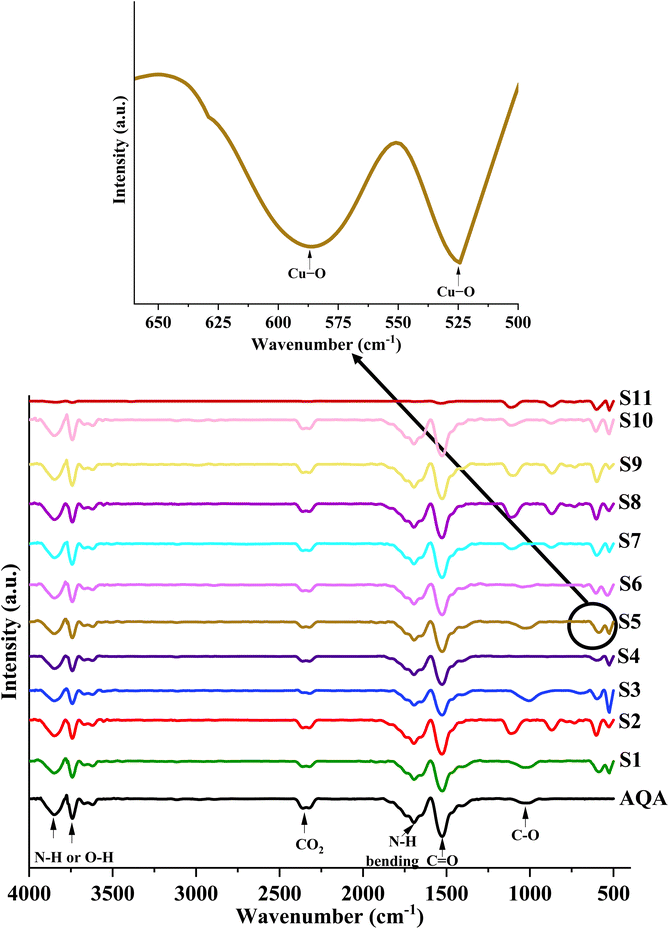
The samples S1 to S11 show additional characteristic peaks at 603 and 522 cm−1. The peaks at 603 and 522 cm−1 were associated with the Cu–O stretching vibrations, matching with B2u mode.52,53 The peaks observed in the spectrum of algae can also be seen in the spectra of biosynthesized CuO NPs. This suggests that proteins, polysaccharides, amides, and long-chain fatty acids are the metabolites responsible for reducing, capping, and stabilizing biosynthesized CuO NPs.
The chemically synthesized CuO NPs represented by S11 showed peaks at 3576, 1113, 603, and 524 cm−1. The small hump at 3576 cm−1 and 1113 cm−1 were ascribed to O–H stretching and O–H bending vibrations, respectively. These peaks were observed due to water molecules adsorbed at the surface of the nanoparticles. The prominent peaks at 603 and 524 cm−1 manifested the presence of Cu–O stretching vibrations.52
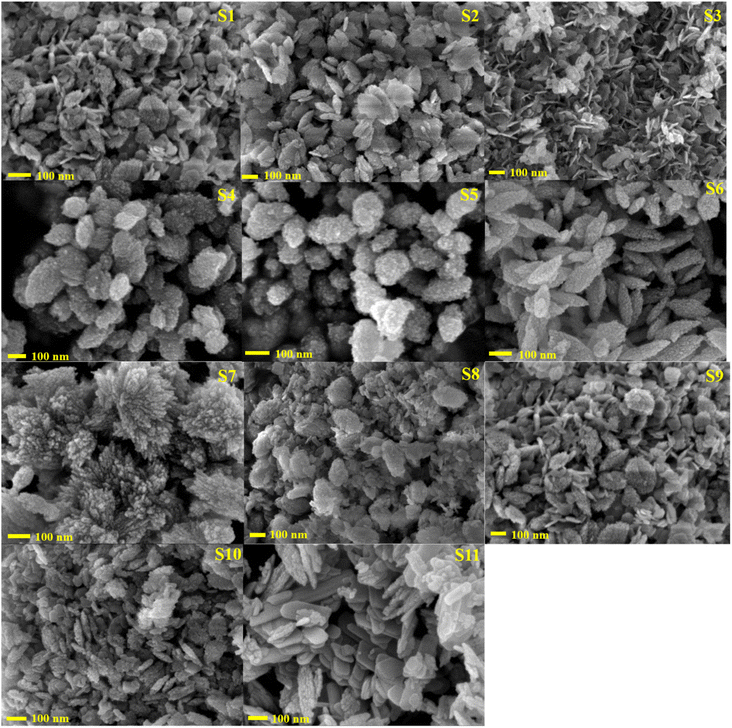 | ||
| Fig. 5 FE-SEM image of the biosynthesized CuO NPs (S1–S10) and chemically synthesized CuO NPs (S11). | ||
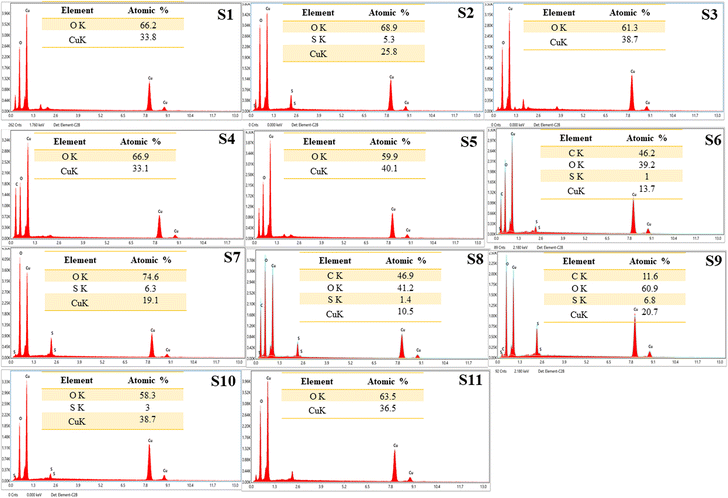
The EDS spectra of all the synthesized CuO NPs are represented in Fig. 6. The spectra showed the characteristic peaks of copper (Cu) and oxygen (O) elements, indicating the presence of CuO NPs. The Cu peak was detected at around 8 keV, while the O peak was observed at around 0.5 keV. The spectrum analysis of some samples revealed the presence of minor peaks that corresponded to sulfur (S) and carbon (C), which are likely attributed to the phytochemicals found in the algal extract coated on the nanoparticles.
Photocatalytic degradation of BBY, BG, EBT, and MG organic dyes
This study examined the photocatalytic activity of synthesized CuO NPs for the degradation of organic dyes such as BBY, BG, EBT, and MG under visible light illumination. The structures of all four dyes are shown in Fig. S3.† The degradation of BBY, BG, EBT, and MG dyes were analyzed using UV-visible spectrophotometer at maximum absorbance wavelength peaks of 450 nm,8 624 nm,56 548 nm,57 and 617 nm,58 respectively. We performed the three sets of experiments, adsorption (in the dark with a catalyst), photolysis (in the light without the catalyst), and photocatalysis (in the light with the catalyst), for all the selected dyes and each sample of CuO NPs (S1–S11). In the two sets, i.e., adsorption and photolysis, very less dye degradation was noticed. While in the case of photocatalysis, significant degradation of dyes was observed (Fig. S4†). The biosynthesized CuO NPs were more efficient than the chemically synthesized CuO NPs for the dilapidation of the dyes. The biosynthesized CuO NPs, S8, exhibited the highest photocatalytic activity, while chemically synthesized CuO NPs, S11, showed the lowest photocatalytic activity. Therefore, in this paper, we have disclosed the results of the S8 sample of CuO NPs only. The effect of various reaction parameters, such as pH, catalyst dosage, and initial dye concentration, on the degradation of all the selected four dyes using biosynthesized CuO NPs (S8) were examined to determine the optimal condition for the dye degradation.Effect of reaction parameters on photocatalytic activity of BBY, BG, EBT, and MG dyes
From Fig. S5b,† it was observed that the degradation efficiency of BG dye was increased with an increase in the pH values. The photodegradation rate was enhanced from 58.88% to 85.20% as pH was increased from 3 to 9. With a further increase in pH value to 11, the colour of the dye disappears abruptly within 1 min. At pH 11, the central carbon atom of the BG dye molecule acquired electrophilic nature and is suitable for reacting with hydroxide anions. Hence, the BG dye molecules become unstable at higher pH 11 value.59,60 Therefore, we have selected pH 9 to optimize other parameters for the BG dye degradation.
A similar effect of pH was observed with the MG dye (Fig. S5d†). The photodegradation rate was enhanced from 48.88% to 84.32% by varying the pH from 3 to 9. The 97.99% degradation was observed with pH 11 within 1 min due to the instability of the dye at a higher pH value. Both BG and MG dyes possess cationic nature. In an alkaline medium, the large concentration of OH− ions lead to a negative charge on the catalyst surface. This increases the electrostatic attraction between the negatively charged catalyst surface and cationic dye molecules, resulting in enhanced adsorption of the dye molecules on the catalyst surface.61 Consequently, the degradation rate of the BG and MG dyes was increased at higher pH values. Conversely, in an acidic medium, the excess of H+ ions result in a positive charge on the catalyst surface. This positively charged catalyst surface repels cationic dye molecules and decreases the adsorption process. Hence, at lower pH values, the degradation rate of the BG and MG dyes was reduced.60
Fig. S5c† demonstrates the degradation rate of EBT dye on CuO NPs through photocatalysis at various pH values. Results showed that at pH values of 3, 5, 7, 9, and 11, the degradation rates were 50.47%, 58.68%, 71.28%, 80.07%, and 83.81%, respectively. The photocatalytic degradation of the dye was found to decrease in an acidic environment compared to neutral pH conditions, whereas the degradation rate increased in a basic environment. The highest rate of degradation was observed at pH 11. A similar result of the effect of pH on EBT dye dilapidation was observed by Lanjwani et al.11 In the basic medium, the concentration of OH− ions increased. An increase in the concentration of hydroxyl ions results in a corresponding increase in the concentration of hydroxyl radicals (˙OH).62 The increase in hydroxyl radicals (˙OH) results in a higher rate of photocatalytic degradation of EBT dye.
From the findings, we can infer that the optimized pH values for the photodegradation of BBY, BG, EBT, and MG dyes using biosynthesized CuO NPs were 3, 9, 11, and 9, respectively.
The results showed that the degradation percentage of BBY dye increased up to 0.05 g of the catalyst and then decreased with a further increase in catalyst loading up to 0.09 g (Fig. S6a†). The maximum degradation of 87.37% was observed at 0.05 g catalyst loading.
On the other hand, the observed degradation rate of BG dye with 0.01, 0.03, 0.05, 0.07, and 0.09 g catalyst loading were 88.28%, 93.04%, 95.72%, 96.92%, and 81.93% after 60 min, respectively (Fig. S6b†). The results demonstrated that the degradation rate was enhanced with an increase in the catalyst loading from 0.01 g to 0.07 g after a further increase in the catalyst loading decreased the degradation efficacy. The optimized CuO NPs catalyst dosage for BG dye was found to be 0.07 g.
For EBT dye, an increment in the degradation efficiency was observed up to optimal catalyst dosage; after that, subsequent increment in the dosage of the catalyst reduced the percentage of dye degradation (Fig. S6c†). The degradation rate increased from 51.46% to 85.84%, with an increase in catalyst loading from 0.01 g to 0.05 g after 90 min of light illumination. The maximum degradation efficiency of 85.84% was achieved at 0.05 g catalyst loading, followed by a decreased degradation rate of 80.56% at 0.09 g catalyst loading.
For MG dye, the optimized catalyst dosage was found to be 0.03 g (Fig. S6d†). The degradation rate increased from 93.04% to 95.72%, with an increase in catalyst dosage from 0.01 g to 0.03 g, afterwards a decrease in degradation efficiency was observed. The degradation rate was reduced to 81.92% at 0.09 g catalyst loading.
Based on the findings, it can be inferred that the optimal catalyst dosage for the BBY, BG, EBT, and MG dyes degradation was 0.05 g, 0.07 g, 0.05 g, and 0.03 g, respectively. The upgradation in the degradation efficacy up to a particular value of the catalyst loading was mainly ascribed to more numbers of available active sites. Nevertheless, after an optimum dosage, a decrease in the degradation rate was observed due to the turbidity of the solution with more catalyst particles or the aggregation of the catalyst. Because of the aggregation of the catalyst particles, a smaller number of active sites were available for the degradation of the dye on the surface of the catalyst, which reduced the efficacy of the CuO NPs to degrade the dyes.
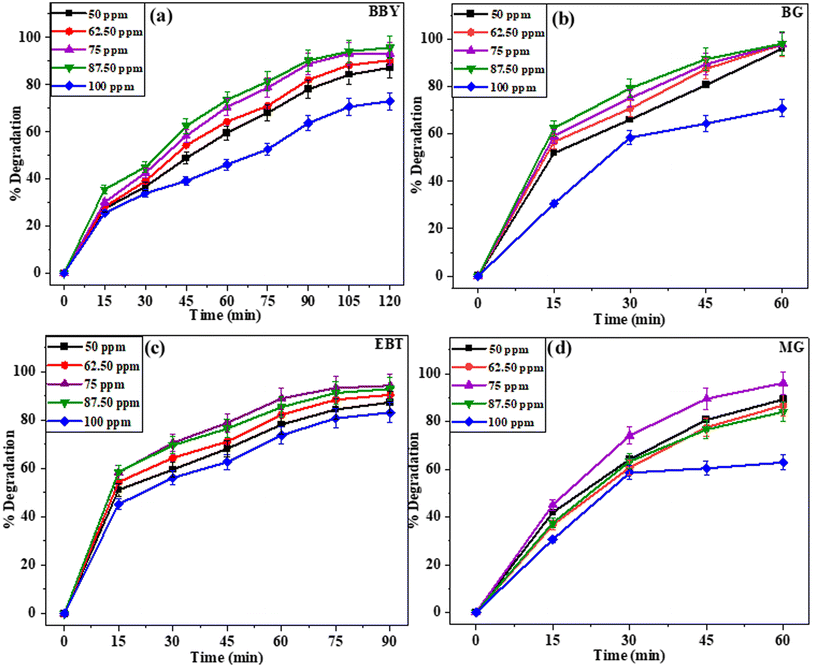 | ||
| Fig. 7 The effect of initial dye concentration on the degradation percentage of dyes: (a) BBY, (b) BG, (c) EBT, and (d) MG using biosynthesized CuO NPs (S8). | ||
The degradation of BBY dye was studied at different initial concentrations (50–100 ppm) over a period of 120 min (Fig. 7a). The degradation rate increased with increasing initial dye concentration from 50 ppm to 87.50 ppm, reaching a maximum of 95.78% degradation at 87.50 ppm of initial dye concentration. However, at the highest concentration of 100 ppm, the degradation rate decreased to 73.03%.
The degradation rate of BG dye was observed to be 96.05%, 97.72%, 97.89%, 98.02%, and 70.80% for initial dye concentrations of 50, 62.50, 75, 87.50, and 100 ppm, respectively, after 60 min (Fig. 7b). Similar to the BBY dye results, the highest degradation rate was observed at an initial BG dye concentration of 87.50 ppm, which resulted in a degradation rate of 98.02%. However, the degradation rate decreased significantly to 70.80% at the highest concentration of 100 ppm.
The degradation rate of EBT dye with 50, 62.50, 75, 87.50, and 100 ppm initial dye concentrations was 87.25%, 90.34%, 94.15%, 92.78%, and 83.03% after 90 min (Fig. 7c). The highest degradation rate was observed at an initial EBT dye concentration of 75 ppm, which resulted in 94.15% degradation.
The degradation rate of MG dye was found to be 89.20%, 86.72%, 96.04%, 84.02%, and 62.80% for initial dye concentrations of 50, 62.50, 75, 87.50, and 100 ppm, respectively, after 60 min of light radiation (Fig. 7d). The maximum rate of dilapidation was seen at an initial dye concentration of 75 ppm. Although, at the highest concentration of 100 ppm, the degradation rate was reduced significantly to 62.80%.
The observed behaviour of dependence of photocatalytic degradation rate on the initial dye concentration can be attributed to the fact that a higher initial concentration of the dye may lead to the saturation of active sites on the surface of the nanoparticles, thereby hindering the degradation process. In addition to this, as the concentration of the dye was increased, the colour of solution became more intense, thereby impeding the penetration of light to the catalyst surface. These outcomes suggest that the initial dye concentration is a crucial factor in determining the photodegradation efficiency of dyes.
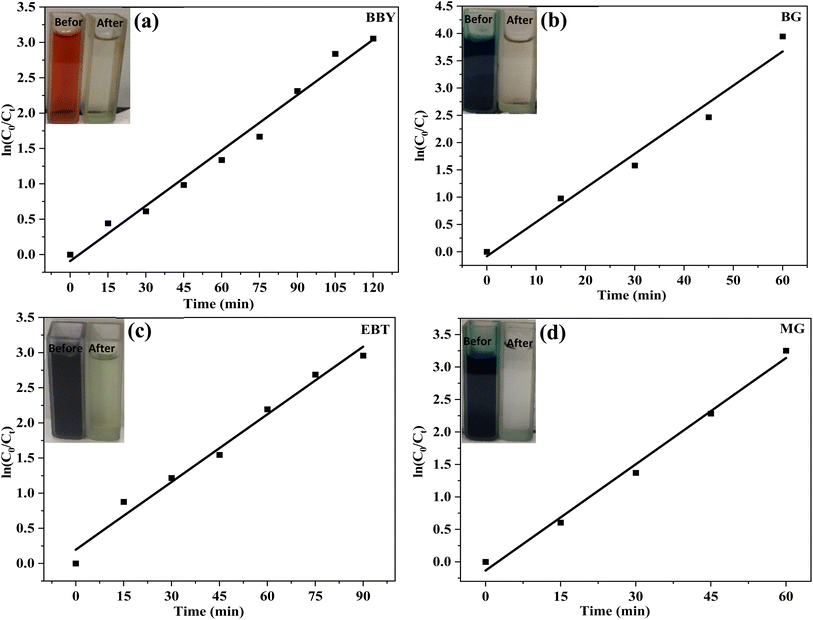
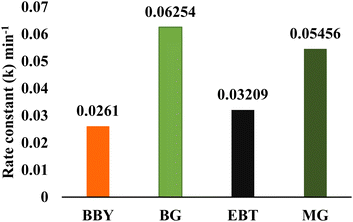
| S. no. | Dye | pH | Catalyst dosage | Initial concentration of dye | Degradation time (min) | % degradation | Rate constant (k) (min−1) | R2 |
|---|---|---|---|---|---|---|---|---|
| 1 | BBY | 3 | 0.05 g | 87.50 ppm | 120 | 95.78% | 0.0261 | 0.98484 |
| 2 | BG | 9 | 0.07 g | 87.50 ppm | 60 | 98.02% | 0.06254 | 0.97635 |
| 3 | EBT | 9 | 0.05 g | 75 ppm | 90 | 94.15% | 0.03209 | 0.98195 |
| 4 | MG | 11 | 0.03 g | 75 ppm | 60 | 96.04% | 0.05456 | 0.99175 |
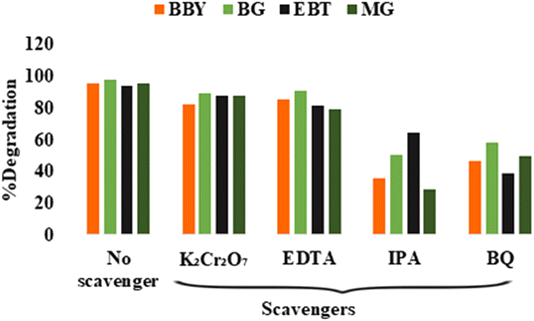
The degradation efficiency of BBY, BG, EBT, and MG dyes was significantly affected by the addition of IPA and BQ scavengers, as evidenced by the substantial reduction in the percentage degradation (Fig. 11). The degradation rate was reduced to 35.41%, 50.87%, 64.91%, and 28.49% for BBY, BG, EBT, and MG dyes, respectively, by IPA scavenger. Similarly, the addition of a BQ scavenger also diminished the degradation rate to 46.85%, 58.67%, 38.96%, and 49.76% for BBY, BG, EBT, and MG dyes, respectively. The degradation of all dyes was reduced in the presence of IPA and BQ, indicating that hydroxyl radicals (˙OH) and superoxide anion radicals (O2˙−) were the major contributors to the degradation of dyes. Whereas EDTA and K2Cr2O7 did not significantly affect the photodegradation process of all four dyes. These results suggest that the primary contributors to dye degradation were hydroxyl radicals (˙OH) and superoxide anion radicals (O2˙−). The electrons (e−) and holes (h+) were not directly involved in the degradation process, instead played a role in the formation of the hydroxyl radicals (˙OH) and superoxide anion radicals (O2˙−).
| ECB = χ(AaBb) − 0.5Eg + Ee | (5) |
| EVB = ECB + Eg | (6) |
| χ(AaBb) = [χ(A)a·χ(B)b]1/(a+b) | (7) |
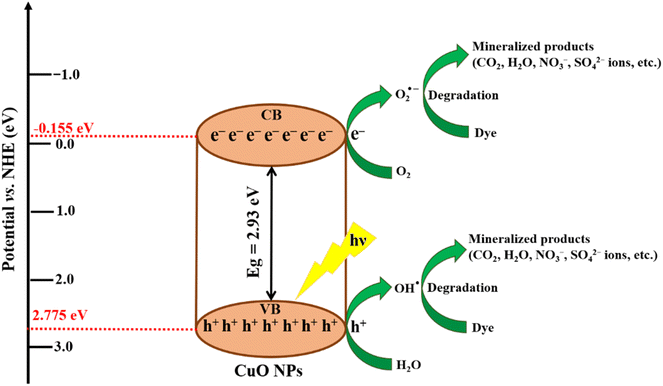
The Eg refers to the band gap of the CuO NPs (S8), which is 2.93 eV. Ee represents the energy of a free electron on the Normal Hydrogen Electrode (NHE) scale, which is −4.50 eV.63 To calculate χ(AaBb), eqn (7) is used, which demonstrates the geometric mean of the electronegativity values of the constituent atoms, i.e., copper (Cu) and oxygen (O).64 The electronegativity of copper (Cu) and oxygen (O) are 4.48 eV and 7.54 eV, respectively.65 The calculated band edge potential of the valence band (EVB) and conduction band (ECB) was 2.775 eV and −0.155 eV, respectively.
The proposed mechanism of dye dilapidation is schematically illustrated in Fig. 12. Under exposure of visible light, the CuO NPs photocatalyst undergoes a process of electron (e−) excitation from the valence band (VB) to the conduction band (CB). Due to this process, positively charged holes (h+) were generated in the VB and electrons (e−) in the CB. The generated electrons react with the adsorbed oxygen molecules (O2) on the surface of the photocatalyst, producing superoxide anion radicals (O2˙−), while the holes in the VB oxidize water to form free hydroxyl radicals (˙OH). The free radicals produced during the process further initiate a series of reactions, eventually resulting in the degradation of organic dyes. Additionally, the metabolites of algae capped on the CuO NPs enhance the adsorption of dye molecules on the photocatalyst surface. The plausible reactions incorporated in the photodegradation of dyes (BBY, BG, EBT, and MG dye) using the CuO NPs are revealed by eqn (8)–(16).
 | (8) |
 | (9) |
 | (10) |
| hVB+ + H2O → ˙OH + H+ | (11) |
| O2 + eCB− → O2˙− (dissolved oxygen) | (12) |
| ˙OH + 3Dye1 → 3Dye1 (Leuco unstable form) | (13) |
| O2˙− + 3Dye1 → 3Dye1 (Leuco unstable form) | (14) |
 | (15) |
 | (16) |
Conclusions
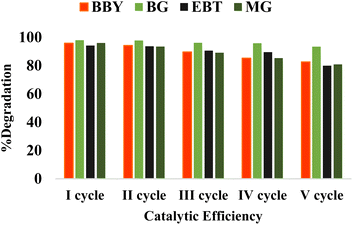
The proposed strategy for the green synthesis of CuO NPs using an Asterarcys quadricellulare algal extract includes a novel, simple, and eco-friendly approach. The study of various reaction parameters for the biosynthesis of CuO NPs disclosed that changing the pH, time, volume of algal extract, and concentration of copper ions, provided the different shapes and sizes of the synthesized CuO NPs. The best results were obtained with the reaction condition, pH 11, 24 h time, 5 mL volume of algal extract, and 0.05 M concentration of the copper ions. The minute change in the reaction conditions provided the desirable change in the crystallite size, band gap value, and shape of the synthesized CuO NPs. The biosynthesized CuO NPs demonstrate excellent degradation efficiency for BBY, BG, EBT, and MG dyes, under visible light radiations. The degradation of dyes continued after five consecutive cycles showing higher stability and reusability of the CuO NPs catalyst. Therefore, biosynthesized CuO NPs can be effectively used for the degradation of dyes and helps in the wastewater treatment process. Owing to the environmental benefits of algal-mediated CuO NPs, further research utilizing these nanoparticles for antibacterial activity are in progress in our laboratory.Author contributions
Manisha Khandelwal: investigation, visualization, data curation, formal analysis, methodology, writing – original draft. Sunita Choudhary: formal analysis, data curation. Harish: software, resources, validation. Ashok Kumawat: data curation, formal analysis. Kamakhya Prakash Misra: formal analysis, resources, validation, writing-review & editing. Devendra Singh Rathore: software, resources, validation. Rama Kanwar Khangarot: conceptualization, visualization, methodology, resources, supervision, validation, writing-review & editing.Conflicts of interest
There are no conflicts to declare.Acknowledgements
The authors are grateful to the Department of Chemistry, Mohanlal Sukhadia University, Udaipur (Raj.), India, for providing the necessary laboratory facilities. The authors thank the Department of Physics, Department of Botany, and Department of Environmental Sciences, Mohanlal Sukhadia University, Udaipur, for providing the XRD facility, algal culture, and UV-vis spectrophotometer, respectively. The authors acknowledge the facilities of Manipal University Jaipur (MUJ), India, for UV-vis, FTIR, and FE-SEM coupled with EDS. RKK and MK thank University Grants Commission, New Delhi, India, for UGC-Start-Up Project [No. F. 30-476/2019 (BSR)] and Fellowship [115/CSIRNETJUNE2019], respectively, for providing financial support to conduct the research work. DSR thanks the Science and Engineering Research Board, Department of Science and Technology (DST), New Delhi, for a core research grant (CRG/2019/006919).References
- R. H. Waghchaure, V. A. Adole and B. S. Jagdale, Inorg. Chem. Commun., 2022, 109764 CrossRef CAS.
- H. He, Z. Luo and C. Yu, J. Photochem. Photobiol., A, 2020, 401, 112735 CrossRef CAS.
- R. Al-Tohamy, S. S. Ali, F. Li, K. M. Okasha, Y. A.-G. Mahmoud, T. Elsamahy, H. Jiao, Y. Fu and J. Sun, Ecotoxicol. Environ. Saf., 2022, 231, 113160 CrossRef CAS.
- J. Essomba, J. Alla, P. Belibi and N. Fathima, Int. J. Environ. Sci. Technol., 2022, 19, 5181–5194 CrossRef CAS.
- H. A. Hamad, S. AbdElhafez, M. Elsenety, M. K. Sorour, N. Amin, O. Abdelwahab and E. Z. El-Ashtoukhy, Fuel, 2022, 323, 124288 CrossRef CAS.
- M. M. Silva, F. H. Reboredo and F. C. Lidon, Foods, 2022, 11, 379 CrossRef CAS.
- M. Khandelwal, D. Sharma, G. Pemawat and R. K. Khangarot, in Current and Future Perspectives of Environmental Pollution and its Remediation, Thanuj International Publishers, Tamil Nadu, 2022, vol. 1, pp. 36–49 Search PubMed.
- S. Begum, S. R. Mishra and M. Ahmaruzzaman, Inorg. Chem. Commun., 2022, 143, 109721 CrossRef CAS.
- M. Bhaumik, A. Maity and H. G. Brink, J. Colloid Interface Sci., 2022, 611, 408–420 CrossRef CAS.
- K. Selvam, C. Sudhakar, T. Selvankumar, B. Senthilkumar, W. Kim, M. M. Al-Ansari and L. Al-Humaid, Appl. Nanosci., 2023, 13, 2837–2843 CrossRef CAS.
- M. F. Lanjwani, M. Y. Khuhawar, T. M. J. Khuhawar, A. H. Lanjwani, S. Q. Memon, W. A. Soomro and I. K. Rind, J. Cluster Sci., 2022, 1–12 Search PubMed.
- B. Pandey, P. Singh and V. Kumar, Environ. Nanotechnol., Monit. Manage., 2021, 16, 100596 CAS.
- G. Bal and A. Thakur, Mater. Today: Proc., 2022, 50, 1575–1579 CrossRef CAS.
- H. He, Z. Luo, Z.-Y. Tang and C. Yu, Appl. Surf. Sci., 2019, 490, 460–468 CrossRef CAS.
- H. He, Z. Luo and C. Yu, Colloids Surf., A, 2021, 613, 126099 CrossRef CAS.
- Z. Masood, A. Ikhlaq, A. Akram, U. Y. Qazi, O. S. Rizvi, R. Javaid, A. Alazmi, M. Madkour and F. Qi, Catalysts, 2022, 12, 741 CrossRef CAS.
- R. K. Singh, S. S. Behera, K. R. Singh, S. Mishra, B. Panigrahi, T. R. Sahoo, P. K. Parhi and D. Mandal, J. Photochem. Photobiol., A, 2020, 400, 112704 CrossRef CAS.
- K. Mahmood, U. Amara, S. Siddique, M. Usman, Q. Peng, M. Khalid, A. Hussain, M. Ajmal, A. Ahmad and S. H. Sumrra, J. Nanostruct. Chem., 2022, 12, 329–341 CrossRef CAS.
- H. Naeem, H. M. Tofil, M. Soliman, A. Hai, S. H. H. Zaidi, N. Kizilbash, D. Alruwaili, M. Ajmal and M. Siddiq, Molecules, 2023, 28, 926 CrossRef CAS PubMed.
- K. Saeed, I. Khan, T. Gul and M. Sadiq, Appl. Water Sci., 2017, 7, 3841–3848 CrossRef CAS.
- K. Khalid, A. Zahra, U. Amara, M. Khalid, M. Hanif, M. Aziz, K. Mahmood, M. Ajmal, M. Asif and K. Saeed, Chemosphere, 2023, 338, 139531 CrossRef CAS.
- R. K. Khangarot, M. Khandelwal and R. Singh, in Metal Nanocomposites for Energy and Environmental Applications, Springer, 2022, pp. 489–508 Search PubMed.
- H. He, J. Xiao, Z. Liu, B. Yang, D. Wang, X. Peng, L. Zeng, Z. Li, L. Lei, M. Qiu and Y. Hou, Chem. Eng. J., 2023, 453, 139751 CrossRef CAS.
- M. Khandelwal, A. Kumawat, K. P. Misra and R. K. Khangarot, Part. Sci. Technol., 2022, 41, 640–652 CrossRef.
- T. Naseem and T. Durrani, Environ. Chem. Ecotoxicol., 2021, 3, 59–75 CrossRef CAS.
- H. N. Cuong, S. Pansambal, S. Ghotekar, R. Oza, N. T. Thanh Hai, N. M. Viet and V.-H. Nguyen, Environ. Res., 2022, 203, 111858 CrossRef CAS PubMed.
- S. Yadav, A. Jain and P. Malhotra, Green Chem., 2019, 21, 937–955 RSC.
- S. S. Chan, S. S. Low, K. W. Chew, T. C. Ling, J. Rinklebe, J. C. Juan, E. P. Ng and P. L. Show, Environ. Res., 2022, 212, 113140 CrossRef CAS.
- A. Mukherjee, D. Sarkar and S. Sasmal, Front. Microbiol., 2021, 12, 693899 CrossRef.
- Y. Abboud, T. Saffaj, A. Chagraoui, A. El Bouari, K. Brouzi, O. Tanane and B. Ihssane, Appl. Nanosci., 2014, 4, 571–576 CrossRef CAS.
- S. V. P. Ramaswamy, S. Narendhran and R. Sivaraj, Bull. Mater. Sci., 2016, 39, 361–364 CrossRef CAS.
- H. Gu, X. Chen, F. Chen, X. Zhou and Z. Parsaee, Ultrason. Sonochem., 2018, 41, 109–119 CrossRef CAS PubMed.
- P. Bhattacharya, S. Swarnakar, S. Ghosh, S. Majumdar and S. Banerjee, J. Environ. Chem. Eng., 2019, 7, 102867 CrossRef CAS.
- K. Araya-Castro, T.-C. Chao, B. Durán-Vinet, C. Cisternas, G. Ciudad and O. Rubilar, Processes, 2020, 9, 78 CrossRef.
- S. Rajeshkumar, N. T. Nandhini, K. Manjunath, P. Sivaperumal, G. Krishna Prasad, S. S. Alotaibi and S. M. Roopan, J. Mol. Struct., 2021, 1242, 130724 CrossRef CAS.
- N. Ain, N. Safdar and A. Yasmin, Colloids Surf., B, 2019, 178, 66–73 CrossRef CAS PubMed.
- D. Letchumanan, S. P. Sok, S. Ibrahim, N. H. Nagoor and N. M. Arshad, Biomolecules, 2021, 11, 564 CrossRef CAS PubMed.
- H. Veisi, B. Karmakar, T. Tamoradi, S. Hemmati, M. Hekmati and M. Hamelian, Sci. Rep., 2021, 11, 1983 CrossRef CAS.
- S. Asbrink and A. Waskowska, J. Phys.: Condens. Matter, 1991, 3, 8173 CrossRef.
- A. Sharma, R. Khangarot, K. P. Misra, D. Misra, S. Chattopadhyay, P. D. Babu and N. Halder, Phys. Scr., 2021, 075803 CrossRef.
- A. Sharma, R. K. Khangarot, N. Kumar, S. Chattopadhyay and K. P. Misra, Mater. Technol., 2021, 36, 541–551 CrossRef CAS.
- A. Sharma, A. Kumawat, B. Raput, R. K. Khangarot, U. Valiyaneerilakkal, S. Chattopadhyay and K. P. Misra, Effect of Heavy Al Doping on Microstructural and Morphological Behavior of ZnO Thin Film Deposited by Sol-Gel Spin Coating, AIP Publishing LLC, 2021, vol. 2352, p. 040001 Search PubMed.
- A. Arya, V. Mishra and T. S. Chundawat, Chem. Data Collect., 2019, 20, 100190 CrossRef CAS.
- S. Tharani, D. Bharathi and R. Ranjithkumar, Biocatal. Agric. Biotechnol., 2020, 30, 101838 CrossRef.
- M. Forouzandeh-Malati, F. Ganjali, E. Zamiri, S. Zarei-Shokat, F. Jalali, M. Padervand, R. Taheri-Ledari and A. Maleki, Langmuir, 2022, 38, 13728–13743 CrossRef CAS PubMed.
- K. S. Prasad, H. Patel, T. Patel, K. Patel and K. Selvaraj, Colloids Surf., B, 2013, 103, 261–266 CrossRef CAS PubMed.
- S. Shende, A. Gade and M. Rai, Environ. Chem. Lett., 2017, 15, 427–434 CrossRef CAS.
- A. Arya, K. Gupta, T. S. Chundawat and D. Vaya, Bioinorg. Chem. Appl., 2018, 2018, 7879403 Search PubMed.
- B. Sharma, D. D. Purkayastha, S. Hazra, L. Gogoi, C. R. Bhattacharjee, N. N. Ghosh and J. Rout, Mater. Lett., 2014, 116, 94–97 CrossRef CAS.
- C. Adina, F. Florinela, T. Abdelmoumen and S. Carmen, Rom. Biotechnol. Lett., 2010, 15, 5738–5744 CAS.
- S. Vasantharaj, S. Sathiyavimal, M. Saravanan, P. Senthilkumar, K. Gnanasekaran, M. Shanmugavel, E. Manikandan and A. Pugazhendhi, J. Photochem. Photobiol., B, 2019, 191, 143–149 CrossRef CAS PubMed.
- M. Bilal, M. Ikram, T. Shujah, A. Haider, S. Naz, A. Ul-Hamid, M. Naz, J. Haider, I. Shahzadi and W. Nabgan, ACS Omega, 2022, 7, 41614–41626 CrossRef CAS.
- K. M. Navada, G. Nagaraja, J. N. D'Souza, S. Kouser, R. Ranjitha and D. Manasa, Appl. Nanosci., 2020, 10, 4221–4240 CrossRef CAS.
- A. Sharma, A. Kumawat, S. Chattopadhyay, R. K. Khangarot, N. Halder, R. Misra and K. P. Misra, Mater. Today: Proc., 2022, 60, 21–25 CrossRef CAS.
- A. Sharma, A. Kumawat, S. Chattopadhyay, R. K. Khangarot, R. Misra and K. P. Misra, Mater. Technol., 2021, 1–10 Search PubMed.
- S. Bose, B. K. Tripathy, A. Debnath and M. Kumar, Ultrason. Sonochem., 2021, 75, 105592 CrossRef CAS PubMed.
- Y. M. Hunge, A. A. Yadav and S.-W. Kang, Catalysts, 2022, 12, 1290 CrossRef CAS.
- K. D. Sirdeshpande, A. Sridhar, K. M. Cholkar and R. Selvaraj, Appl. Nanosci., 2018, 8, 675–683 CrossRef CAS.
- S. Kaur, S. Sharma, A. Umar, S. Singh, S. Mehta and S. K. Kansal, Superlattices Microstruct., 2017, 103, 365–375 CrossRef CAS.
- T. B. Mbuyazi and P. A. Ajibade, Results Mater., 2022, 16, 100328 CrossRef CAS.
- P. Muhambihai, V. Rama and P. Subramaniam, Environ. Nanotechnol., Monit. Manage., 2020, 14, 100360 Search PubMed.
- M. Karimi-Shamsabadi, M. Behpour, A. K. Babaheidari and Z. Saberi, J. Photochem. Photobiol., A, 2017, 346, 133–143 CrossRef CAS.
- P. L. Meena, K. Poswal, A. K. Surela and J. K. Saini, Adv. Compos. Hybrid Mater., 2023, 6, 16 CrossRef CAS.
- M. Mousavi, A. Habibi-Yangjeh and M. Abitorabi, J. Colloid Interface Sci., 2016, 480, 218–231 CrossRef CAS PubMed.
- R. G. Pearson, Inorg. Chem., 1988, 27, 734–740 CrossRef CAS.
Footnote |
| † Electronic supplementary information (ESI) available: All experimental details are explained. See DOI: https://doi.org/10.1039/d3ra05254k |
| This journal is © The Royal Society of Chemistry 2023 |

