 Open Access Article
Occurrence of moisture in deep gas-bearing shale matrix and its impacts on methane adsorption/desorption capability under favorable reservoir conditions
Dengfeng Zhang *abc,
Xuewei Caic,
Yi Xuc,
Xing Tangc and
Hanxing Suc
aState Key Laboratory of Shale Oil and Gas Enrichment Mechanisms and Effective Development, Beijing 100083, PR China. E-mail: plum0627@163.com
bKey Laboratory of Shale Oil and Gas Exploration & Production, SINOPEC, Beijing 100083, PR China
cFaculty of Chemical Engineering, Kunming University of Science and Technology, Kunming 650500, PR China
First published on 6th October 2023
Abstract
To comprehend impacts of moisture on exploring and producing shale gas, the rules of pseudo-in situ moisture occurrence in deep shales were revealed through low-pressure N2 adsorption and desorption, and CO2 adsorption measurements. The influences of pseudo-in situ moisture on CH4 adsorption/desorption in the shales were explored at 353.15 K and pressures up to 30 MPa by using the volumetric method. Results showed that the pseudo-in situ moisture content of the shales ranges between 0.57% and 0.94%, which positively correlates with clay mineral content but negatively correlates with organic matter and quartz. The clay minerals contribute more to moisture occurrence mainly via adsorption effect. The pores with the diameters of 1.10–4.10 nm of the shales serve as dominant space for accommodating moisture. Moreover, the pseudo-in situ moisture reduces saturated adsorption capacity and isosteric adsorption heat of CH4 on the shales, suggesting the weakened adsorption affinity toward CH4-shale system. Typically, the minor pseudo-in situ moisture could significantly weaken CH4 adsorption capability of the shales with low clay mineral content through blocking pore throats of organic matter–hosted pores. However, the abundant pseudo-in situ moisture only slightly reduces CH4 adsorption capability of the shales with high clay mineral content due to continuous distribution of organic matter–hosted pores. The aforementioned different roles are dominated by the difference in occurrence characteristics of organic matter–hosted pores and clay mineral-hosted pores between the shales with low clay mineral content and the shales with high clay mineral content. Furthermore, the pseudo-in situ moisture strengthens CH4 adsorption/desorption hysteresis on the shales associated with moisture uptake-induced clay mineral swelling, thereby raising difficulty for CH4 desorption from the shales.
1 Introduction
Shale gas, an important category of unconventional natural gas, is pivotal to reduce dependence on foreign oil and gas resources and address environmental issues caused by massive consumption of traditional fossil fuels for China.1,2 The key component of shale gas is methane (CH4). It mainly occurs within shale reservoirs in physisorption state in nano-scale pores of organic matter and inorganic minerals,3 free state in large-scale pores and fractures, and dissolution state in kerogen or asphaltene.4–6 Among them, the volume fraction of in situ physiosorbed CH4 always occupies 40–85% of the total shale gas reserves.7,8 Thus, further knowledge on CH4-shale adsorption system is critical to reveal occurrence mechanism of shale gas, thereby benefiting its exploration and production.Up to now, CH4-shale adsorption system has been well investigated. Many studies indicate that adsorption capability of shale matrix for CH4 depends on the critical physicochemical properties of shale matrix and reservoir conditions such as pressure and temperature. The former mainly comprises total organic carbon (TOC) content, thermal maturity, inorganic mineral compositions, and moisture.9 Concretely, organic matter develops abundant nano-scale pores,10,11 particularly the micropores with pore diameters below 2.00 nm, thereby serving as main adsorption sites for CH4 molecules. Thus, the studies on the Lower Silurian Longmaxi shales in the Sichuan Basin in China,12 the Ordovician, Silurian, and Devonian shales in Appalachia Basin in America,13 the Upper Triassic Yan-Chang shales in Ordos Basin in China,14 the Devonian-Mississippian Woodford shales in America,15 the Paleozoic shales in south China,16 and the Cambrian shales in the Yangtze Platform in China indicate the remarkably positive correlation between CH4 adsorption capacity and TOC content.17 The impacts of thermal maturity of shale matrix on CH4 adsorption are complicated. Some studies found that the elevated thermal maturity of organic matter could accommodate more adsorption sites,18,19 thereby increasing CH4 adsorption capacity normalized by TOC on shale matrix. However, thermal maturity of shale reservoirs increases with burial depth. As the reservoir depth increases, the enhanced compaction could lead to negative impact of thermal maturity on CH4 adsorption capacity of high or overmature shales through reducing adsorption space.20–22 Apart from organic matter, shale matrix is abundant in various inorganic minerals. Thereinto, the clay minerals, typically including kaolinite, smectite, illite, and chlorite, contain plentiful micropores, contribute greatly to CH4 adsorption on shale matrix.23–26
Notably, there is always moisture existing in shale gas systems. Moisture molecules are prone to occupy hydrophilic clay mineral-hosted pores or block organic matter-hosted pore throat.11,27,28 Under such situations, moisture could take up adsorption sites or isolate pores from CH4.29 As a result, even minor moisture with mass fraction of 0.72–7.05% could remarkably decrease the saturated CH4 adsorption capacity of the shale samples derived from the Langmuir model fitting by 16.67–81.82%.30 It has been reported that CH4 and CO2 adsorption as single component or mixed gases decreases with increasing amount of moisture in shales.31 Besides, given the striking effects of moisture on gas adsorption in shales, many mathematical models including the modified Langmuir model and the absolute adsorption model have been developed to describe the CH4 adsorption on wet shale samples.32–34
Despite those considerable efforts have been made on occurrence rules of moisture in gas-bearing shales and their impacts on CH4 adsorption, there still exist some critical pending issues. One issue is that most studies on CH4 adsorption on dry or moist shales were conducted under mild pressures (7–25 MPa) and temperatures (298.15–348.15 K).29,35–38 However, the practical reservoir temperature and pressure corresponding to dessert area of shale gas in China are always greater than 353.15 K and 30 MPa, respectively.39 Thus, the knowledge on CH4 adsorption capability of shales and its correlation with moisture under favorable reservoir conditions is required. More importantly, compared with widely studied CH4 adsorption on shales, the insight to CH4 desorption capability of shales makes more sense to shale gas production as the adsorbed gas can only be recovered after desorption. However, the influence and mechanism of moisture on CH4 desorption on shales are still unknown.
In order to bridge the aforementioned knowledge gap, the occurrence rules of pseudo-in situ moisture in the deep shales originated from the representative shale gas producing area were revealed to explore the moisture effects on gas desorption under more reasonable reservoir conditions. The pseudo-in situ moisture dependence of adsorption/desorption capability of shales under favorable reservoir conditions was also addressed. Finally, the implications for shale gas exploration and production were indicated.
2 Experimental
2.1 Samples
The Fuling shale gas field as the first large-scale commercial shale gas field in China, has achieved cumulative production of 40 billion m3 as of October 8th, 2021. The main body of structural framework of this gas field is affiliated to the Wufeng–Longmaxi Formation shales in the Jiaoshiba area, Eastern Sichuan Basin.12,40 Overall, the average TOC content of the shales in this area is about 2.66%; the brittle mineral content ranges between 65% and 79%; in addition, the average porosity and gas content amount to 4.53% and 4.32 m3 t−1, respectively.41 Given the aforementioned resource abundance and hydraulic fracturing potential, a total of five gas-bearing shale samples with burial depth of 3812–3998 m were collected from the Jiaoshiba area for this study. The samples were labelled as K1, K3, K5, K7, and K10, respectively. In order to prevent unexpected alterations in critical physicochemical properties due to atmospheric oxidation, the collected shale samples were stored in the plastic bottles and flooded with inert helium.Previous study has indicated that the relative humidity (RH) of 75% well approaches to the in situ shale reservoirs in the Jiaoshiba area.35 Hence, the dry shale samples with particle sizes of 120–180 μm placed in the desiccator loaded with saturated sodium chloride (NaCl) solution were used to prepare the moist shale samples. The detailed preparation procedures can be found in ref. 42.
The moisture content (CH2O) of those moist samples is given as:
 | (1) |
2.2 TOC content measurement
According to the Standard GB/T19145-2003, the TOC content was estimated by using the ELEMENTRAC CS-i analyzer (Eltra, Germany). The inorganic carbon of the raw shale samples was completely removed using hydrochloric acid (HCl). The treated shale samples only containing organic carbon burned in the oxygen (O2) atmosphere. The released CO2 amount was quantitatively detected by the analyzer. Accordingly, the TOC content was estimated according to the CO2 amount. As shown in Table 1, the TOC content of all the shales falls into the range of 1.83–5.47%, which agrees with previously reported range for the shales in the Jiaoshiba area (0.46–7.13%).43 Furthermore, according to the enacted technical standard,44 the samples K1, K3, and K10 with TOC content above 4% are the ultra-high organic matter-containing shales; the sample K5 with TOC content range of 2–4% is the high organic matter-containing shale; the sample K7 with TOC content range of 1–2% is the middle organic matter-containing shale.| Sample | TOC | Quartz | K-feldspar | Plagioclase | Calcite | Dolomite | Pyrite | Clay minerals | Clay minerals | ||
|---|---|---|---|---|---|---|---|---|---|---|---|
| Illite | Illite/smectite mixture | Chlorite | |||||||||
| K1 | 5.47 | 65.1 | 0.7 | 4.7 | 3.2 | 2.8 | 3.9 | 19.6 | 85 | 13 | 2 |
| K3 | 4.68 | 57.4 | 1.2 | 4.5 | 2.4 | 4.0 | 7.4 | 23.1 | 81 | 15 | 4 |
| K5 | 3.64 | 36.6 | 0.2 | 4.1 | 2.5 | 3.4 | 3.9 | 49.3 | 82 | 9 | 9 |
| K7 | 1.83 | 40.0 | 1.9 | 7.2 | 3.2 | 2.4 | 3.0 | 42.3 | 74 | 14 | 12 |
| K10 | 5.45 | 66.5 | 1.4 | 4.2 | 6.0 | 2.1 | 2.7 | 17.1 | 92 | — | 8 |
2.3 Mineral composition analysis
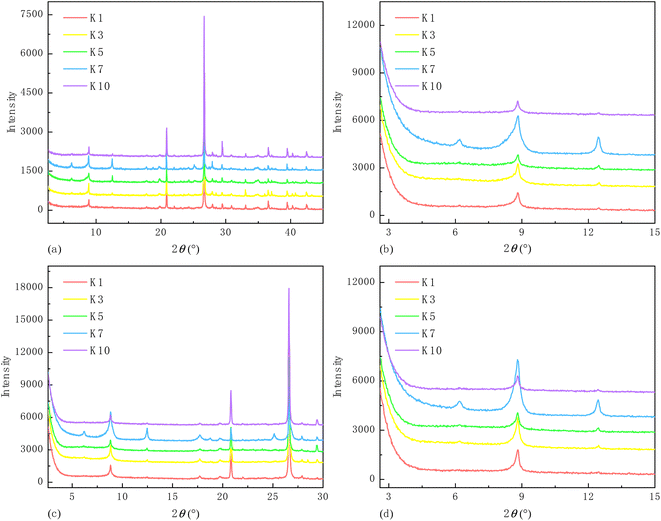
The non-clay and clay mineral compositions were estimated via X-ray diffraction (XRD) analysis. The original X-ray diffraction spectra are shown in Fig. 1. Thereinto, the full spectrum was analyzed to generate major types of non-clay minerals and the relative contents of non-clay and total clay minerals. The remaining diffraction spectra were used to identify clay mineral types according to the difference in peak intensity and position after various treatments. The adopted standard, detailed instrument parameters, characterizing procedures, and data processing method can be found in ref. 6.The results show that each shale sample is abundant in quartz and clay minerals; additionally, the latter is predominated by illite (Table 1).
2.4 Pore morphology observation
The Thermo Scientific Apreo 2 SEM loaded with a backscatter detector was used to observe pore morphology of the shale samples. The accelerating voltage and electron-beam current were set as 5.00 kV and 0.40 nA, respectively. Additionally, the Apreo 2 SEM was equipped with an energy-dispersive spectrometer (EDS) with accelerating voltage and electron-beam current of 20.00 kV and 3.20 nA, respectively. Prior to observation, the argon ion polishing was performed to each shale sample to obtain high-quality images.2.5 Pore structure characterization
According to pore diameter (D), the pores can be divided into the micropores (D < 2.00 nm), the mesopores (2.00 nm < D < 50.00 nm), and the macropores (D > 50.00 nm).45 In this study, the micro- and mesopores of the shales were quantitatively analyzed due to their crucial roles in CH4 adsorption/desorption and diffusion.46,47The micropore parameters were estimated by adsorption method using CO2 as probe molecule because of its superior accessibility into ultramicro- and micropores of porous media.8,48 The characterization was performed on the ASAP 2020 System manufactured by the Micromeritics, U.S.A. The micropore surface area (Smicro) and volume (Vmicro) could be generated via the Dubinin–Radushkevich (D–R) model fitting results toward adsorption data at operation temperature of 273.15 K.49,50 The average micropore diameter (Dmicro) and differential micropore volume distribution profile were obtained in accordance with the Dubinin–Astakhov (D–A) model and the nonlocal density functional theory (NLDFT),51 respectively.
The mesopore parameters were estimated through nitrogen (N2) adsorption/desorption conducted on the NOVA 4200e (Quantachrome, U.S.A.). Specifically, the raw N2 adsorption/desorption amounts were collected at the relative adsorption equilibrium pressures (P/P0) of 0.009–0.990 at 77.00 K. Accordingly, the mesopore surface area (Smeso) was obtained through applying the Brunauer–Emmett–Teller (BET) model fitting toward the adsorption amounts in the P/P0 of 0.04–0.29.52 The mesopore volume (Vmeso) was estimated from the Barrett–Joyner–Halenda (BJH) model.53 Additionally, the differential mesopore volume distribution profile was generated by applying the DFT combined with adsorption amounts.54
The aforementioned characterizations were conducted to the dry and moist samples. It is noteworthy that the degassing operated at the vacuum degree of 0.1325 Pa and the temperature of 333.15 K for 24.00 h was only performed to the dry samples to completely remove residual moisture and gas. Thus, the main space for accommodating H2O could be estimated through comparing pore parameters of dry and moist shales.
2.6 CH4 adsorption/desorption measurement
The volumetric method was adopted to determine CH4 isothermal adsorption/desorption capacity of the shale samples, mainly including leakage test, volume calibration, adsorption, and desorption. The experimental system mainly comprises pressure vessels i.e., reference vessel and sample vessel, air oven, and pressure transducers.The measured datum is defined as the Gibbsian surface excess (GSE). As for CH4 adsorption, its incrementation in GSE (mmol g−1) is:
 | (2) |
Repeating the above-mentioned measuring procedures by boosting or reducing bulk pressure in the sample vessel, the GSE corresponding to the nth measurement is:
 | (3) |
The GSE data reliability highly depends on the accuracy of temperature, pressure, and compressibility factor as shown in eqn (2). Therefore, the air oven with the temperature control accuracy below 0.10 K (UN450, Memmert, Germany) and the two Super TJE transducers with limit of detection of 0.05% of the full scale, i.e., 5000 psia (Honeywell, U.S.A.) were employed. Moreover, the Wagner & Span equation of state (EoS) was applied to generate CH4 compressibility factors.55 According to previously reported, the Wagner–Span EoS is competent to predict thermodynamic properties of CH4 within the temperature range from 270 to 350 K at pressures up to 30 MPa.55 In order to demonstrate the superiority of this equation of state, the relative deviation of compressibility factor (Z) defined as (Zexp − Zcal)/Zexp of CH4 obtained from various types of EoS was compared. It is found from Fig. 2 that the relative deviation of compressibility factor calculated from the Wagner–Span EoS is extremely less than that calculated from the other five types of EoS. Thus, the Wagner–Span EoS is widely selected to calculate compressibility factor and bulk density of CH4 in many studies.56,57
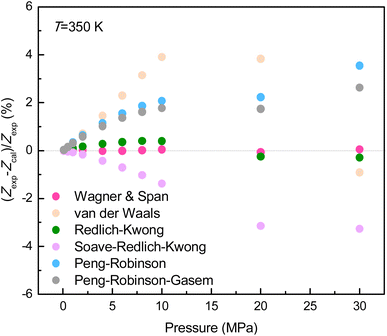 | ||
| Fig. 2 Relative deviation of compressibility factor of CH4 obtained from various types of equation of state. | ||
Given that the sampling depth range of 3812–3998 m corresponds to the burial depth of shale gas dessert area in the Jiaoshiba area, the reservoir temperature of 353.15 K and pressure of 30 MPa were adopted as the isothermal adsorption temperature (Tiso) and the maximal adsorption equilibrium pressure, respectively. In addition, each sample with mass of about 140.00 g was used to reduce the void volume of sample vessel to assure reliability of GSE data.
The analysis results of TOC content, inorganic mineral compositions, pore structure parameters, and CH4 adsorption/desorption capacity of the dry sample K1 were cited from our previous study.6
3 Results and discussion
3.1 Pseudo-in situ moisture abundance
The pseudo-in situ moisture content of all the moist shales ranges between 0.57% and 0.94% (Table 2). The moisture content of shale matrix is highly dependent on organic matter and inorganic minerals as previously indicated. Hence, the correlation analysis was made in Fig. 3. Overall, the negative correlation exists between pseudo-in situ moisture content and TOC content (Fig. 3a) and quartz content (Fig. 3b), which highly depends on strong hydrophobicity of organic matter and quartz.58–60 Oppositely, the clay minerals favor moisture occurrence (Fig. 3c). The clay minerals such as illite with high cation exchange capacity own strong hydrophilicity.61 Thus, they can combine H2O molecules via hydration of exchangeable cationic within the interlamellar space of clay minerals.62 Additionally, the micropores within the interlamellar space, the interparticle mesopores, and the macropores between clay aggregates could accommodate H2O molecules.62 Hence, the positive effect of clay minerals on moisture occurrence in shale matrix is widely acknowledged.27,63| Sample | K1 | K3 | K5 | K7 | K10 |
|---|---|---|---|---|---|
| CH2O | 0.57 | 0.63 | 0.94 | 0.90 | 0.62 |
 | ||
| Fig. 3 Physical property of shale matrix dependence of pseudo-in situ moisture content, (a) TOC content, (b) quartz content, and (c) clay mineral content. | ||
3.2 Pore space accommodating pseudo-in situ moisture
The adsorption force field overlap occurring in micropore space could strengthen adsorbate–adsorbent interactions, thereby leading to remarkable increase in adsorption capacity even at low equilibrium pressure.51 Therefore, the pattern of the CO2 adsorption isotherms displayed in Fig. 4 indicates that all the shale samples are abundant in micropores. The minor alterations found for the dry and moist shale samples imply that the micropores may not be the dominant pore space for accommodating the pseudo-in situ moisture.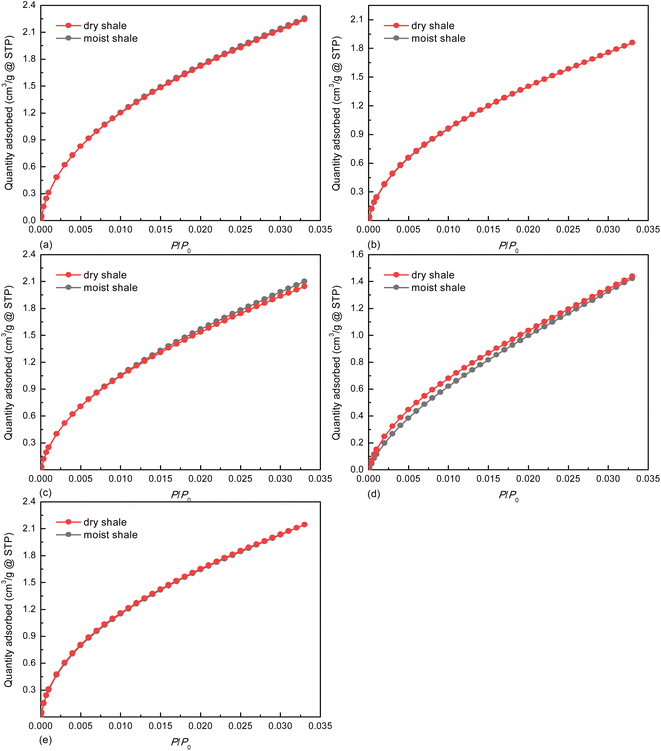 | ||
| Fig. 4 CO2 adsorption isotherms on deep shale samples at 273.15 K, (a) K1, (b) K3, (c) K5, (d) K7, and (e) K10. | ||
Based on the classification criteria recommended by the Brunauer–Deming–Deming–Teller method,64 all the N2 adsorption isotherms displayed in Fig. 5 belong to Type IV. Despite that the pseudo-in situ moisture does not alter the adsorption mechanism of N2 on the shales, it notably shifts down the adsorption/desorption isotherms for all the dry shales. This changing trend confirms that majority of the pores characterized by N2 adsorption/desorption method are occupied by the pseudo-in situ moisture. Moreover, the hysteresis phenomenon, i.e., separation between adsorption branch and desorption branch associated with capillary condensation of N2 molecules in mesopore space,65 exists for all the shales. According to the correlation between pore shape of porous media and hysteresis loop type,45 all the hysteresis loops belong to Type H4, probably indicating abundant narrow slit-like pores in the dry and moist shales.
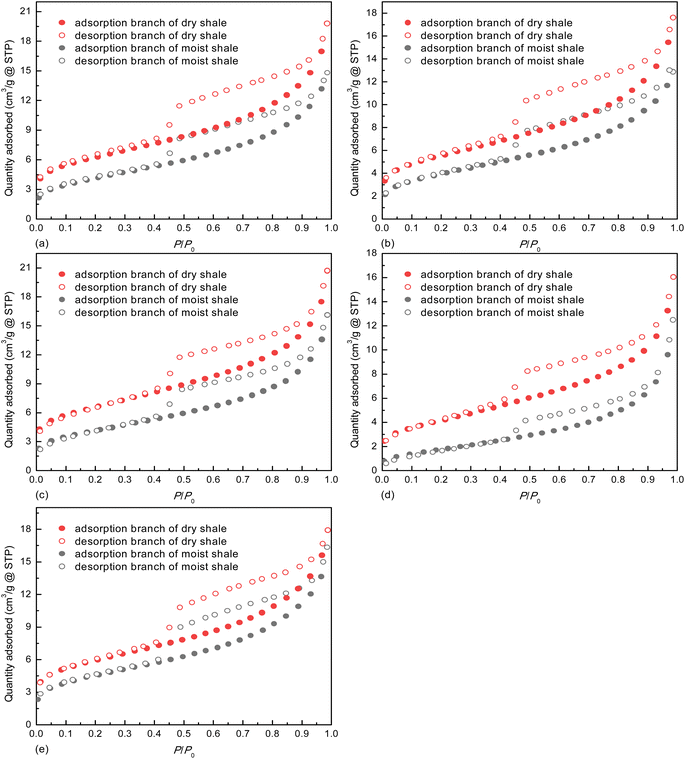 | ||
| Fig. 5 N2 adsorption/desorption isotherms on deep shale samples at 77.00 K, (a) K1, (b) K3, (c) K5, (d) K7, and (e) K10. | ||
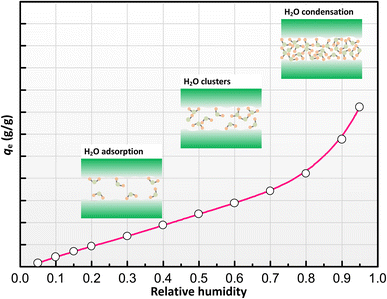
As for each shale sample, the pseudo-in situ moisture cannot alter its micropore parameters (Smicro, Vmicro, and Dmicro) but obviously reduce the mesopore surface area and volume (Table 3). To further reveal dominant pores of the deep gas-bearing shale samples for pseudo-in situ moisture occurrence, the differential micro- and mesopore volume distribution profiles obtained from the CO2 adsorption data and the N2 adsorption data, respectively, are plotted in Fig. 6. The difference found in the profiles clearly indicates that the pores with diameters of 1.10–4.10 nm dominate the pseudo-in situ moisture occurrence for each shale sample. Both organic matter, kerogen in particular, and clay minerals contribute to formation and evolution of pores of shale matrix.66–68 Currently, the micropore parameter analysis toward the natural and organic matter-free shales by using CO2 adsorption method suggests that organic matter–hosted pores rather than clay mineral-hosted pores contribute more to the pores with diameters below 1.10 nm.69 Other studies also indicate that the organic matter and clay minerals mainly dominate micro- and mesopore development, respectively.70–72 Meanwhile, the organic matter of all the deep gas-bearing shales tested in this study exhibits strong hydrophobicity as verified by the negative correlation displayed in Fig. 3a. The combination of these two points could explain the unnoticeable alterations in distribution profiles with pore diameters less than 1.10 nm between the dry and moist shale samples (Fig. 6). Moreover, it is found from Table 3 and Fig. 6c and d that the pseudo-in situ moisture significantly alter the pore structure of the samples K5 and K7 with the higher clay mineral content (Table 1). Such agreement demonstrates the positive effect of clay minerals on moisture occurrence. Furthermore, the moisture occurrence in shale matrix mainly comprises adsorbed moisture, water clusters, and condensed water.30 As illustrated in Fig. 7,30 the moisture adsorption often occurs in micropores and partial mesopores with small diameters at low relative humidity; the water clusters formed due to hydrogen bond interactions between adjacent water molecules are formed at medium relative humidity;73 the water condensation only occurs in macropores with preferable sites at high relative humidity.60 Therefore, in accordance with the relative humidity determined for preparing moist shale samples and pore diameter range alterations, the pores with diameters of 1.10–4.10 nm are most likely the dominant interaction space between the pseudo-in situ moisture and the shales. The aforementioned moisture occurrence mechanism also explains the unchanged distribution profiles within diameters between 4.10 nm and 34.00 nm.
| Sample | State | Smicro (m2 g−1) | Vmicro (cm3 g−1) | Dmicro (nm) | Smeso (m2 g−1) | Vmeso (cm3 g−1) | Dmeso (nm) |
|---|---|---|---|---|---|---|---|
| K1 | Moist | 17.57 | 0.0070 | 1.51 | 14.83 | 0.022 | 6.16 |
| Dry | 17.70 | 0.0071 | 1.49 | 21.31 | 0.030 | 5.74 | |
| K3 | Moist | 14.12 | 0.0057 | 1.52 | 13.96 | 0.019 | 5.69 |
| Dry | 14.10 | 0.0057 | 1.51 | 18.96 | 0.027 | 5.74 | |
| K5 | Moist | 17.02 | 0.0068 | 1.52 | 14.76 | 0.024 | 6.74 |
| Dry | 16.55 | 0.0066 | 1.51 | 22.69 | 0.032 | 5.64 | |
| K7 | Moist | 11.45 | 0.0046 | 1.70 | 6.88 | 0.019 | 11.23 |
| Dry | 10.59 | 0.0042 | 1.66 | 14.69 | 0.025 | 6.75 | |
| K10 | Moist | 16.71 | 0.0067 | 1.50 | 15.87 | 0.025 | 6.36 |
| Dry | 16.17 | 0.0065 | 1.50 | 20.08 | 0.028 | 5.51 |
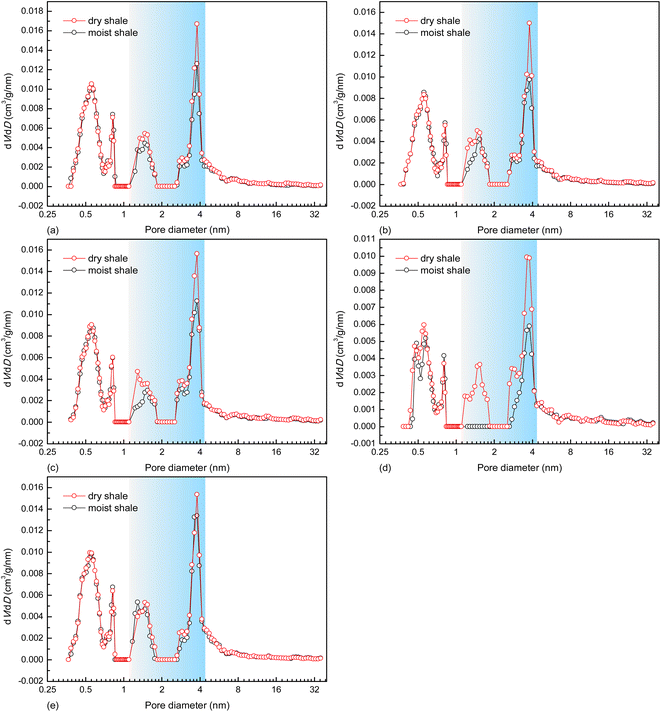 | ||
| Fig. 6 Differential pore volume distribution profiles of deep shale samples, (a) K1, (b) K3, (c) K5, (d) K7, and (e) K10. | ||
3.3 Influences of pseudo-in situ moisture on CH4 adsorption equilibrium
Fig. 8 displays the GSE adsorption isotherms at the favorable reservoir conditions. All the isotherms display a maximum in the adsorption amount with rising pressure. The maximum pattern and the reason for that have been widely reported.74–76 The pseudo-in situ moisture notably reduces CH4 adsorption capacity for each dry shale. In order to quantitatively explore the aforementioned negative impact, the Ono–Kondo (O–K) lattice theory with advantages of predicting adsorption equilibrium behaviors of various fluids under reservoir conditions was employed in this study.57,77 This model is derived based on thermodynamic equilibrium theory with the following linear form:56
 | (4) |
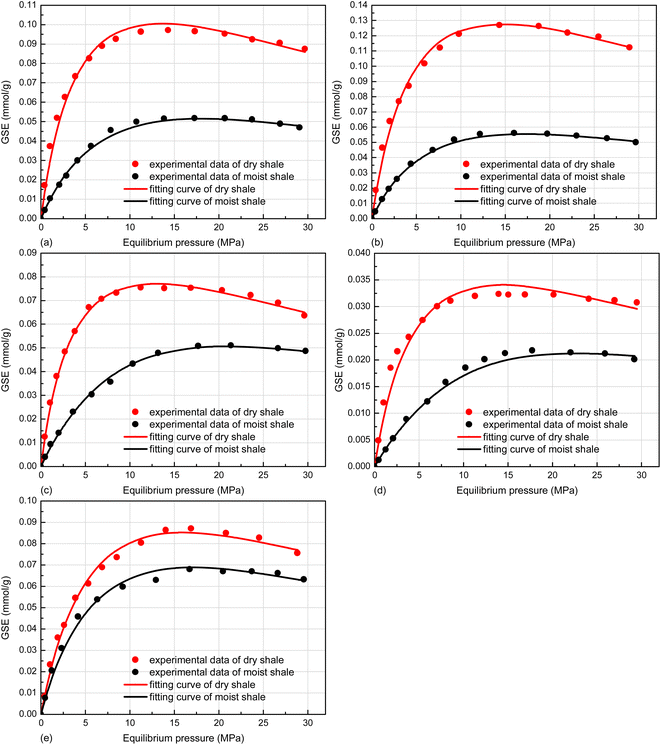 | ||
| Fig. 8 Experimentally-observed and the O–K lattice model fitting CH4 adsorption isotherms on deep shale samples at 353.15 K, (a) K1, (b) K3, (c) K5, (d) K7, and (e) K10. | ||
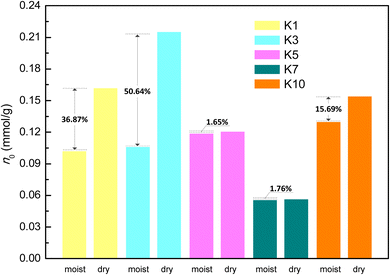
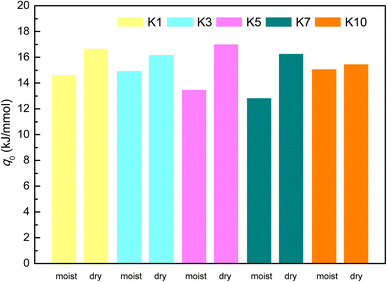
The model fitting isotherms displayed in Fig. 8, the average relative errors (ARE) and the multiple correlation coefficients (R2) summarized in Table 4 prove the applicability of the O–K lattice model to the GSE adsorption isotherms of CH4 on both dry and moist shales under high temperature and pressure conditions. Notably, the adsorption temperature (353.15 K) and the maximal adsorption equilibrium pressure (30 MPa) are far above the critical temperature (190.55 K) and critical pressure (4.59 MPa) of CH4.82 Therefore, the CH4-shale is a supercritical adsorption system, which is provided with the two adsorption-layer pattern.77 The saturated adsorption capacity (n0) obtained from eqn (5) for each shale is listed in Fig. 9.
| n0 = 2am | (5) |
| Sample | State | am (mmol g−1) | εA (kJ mol−1) | ARE (%) | R2 |
|---|---|---|---|---|---|
| K1 | Moist | 0.0512 | −1.08 × 10⁻²⁰ | 2.92 | 0.9986 |
| Dry | 0.0811 | −1.42 × 10⁻²⁰ | 4.94 | 0.9984 | |
| K3 | Moist | 0.0532 | −1.13 × 10⁻²⁰ | 1.82 | 0.9995 |
| Dry | 0.1078 | −1.33 × 10⁻²⁰ | 4.02 | 0.9990 | |
| K5 | Moist | 0.0595 | −8.91 × 10⁻²¹ | 2.48 | 0.9981 |
| Dry | 0.0605 | −1.47 × 10⁻²⁰ | 1.83 | 0.9989 | |
| K7 | Moist | 0.0279 | −7.83 × 10⁻²¹ | 4.63 | 0.9917 |
| Dry | 0.0284 | −1.35 × 10⁻²⁰ | 6.33 | 0.9953 | |
| K10 | Moist | 0.0650 | −1.15 × 10⁻²⁰ | 4.55 | 0.9972 |
| Dry | 0.0771 | −1.21 × 10⁻²⁰ | 4.07 | 0.9979 |
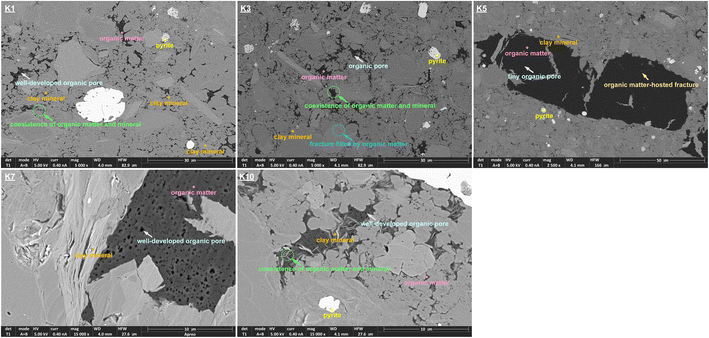
Overall, the pseudo-in situ moisture reduces the saturated CH4 adsorption capacity of the dry shales by 1.65–50.64%. The aforementioned negative impacts of the pseudo-in situ moisture can be divided into the following two mechanisms through combining Table 2 and Fig. 9. In general, the organic matter–hosted pores instead of the clay mineral-hosted pores of shale matrix own stronger adsorption affinity to CH4 molecules.74 Thus, the adsorbed CH4 molecules are prone to occupy the organic matter–hosted pores. As for the samples K1, K3, and K10 with relatively lower pseudo-in situ moisture content, the moisture occurrence significantly reduces the saturated CH4 adsorption capacity by 15.69–50.64%. It is deduced that the organic matter-hosted pore throats of these shale samples could be blocked by water molecules,36,60 therefore remarkably weakening CH4 adsorption capability (Fig. 10a). Oppositely, the pseudo-in situ moisture mainly occurs in the clay minerals of the samples K5 and K7 with relative high clay mineral content (Table 1). The moisture cannot affect the organic matter–hosted pores mainly accommodating adsorbed CH4 molecules. Thus, even high pseudo-in situ moisture content only decreases the saturated CH4 adsorption capacity of the samples K5 and K7 by 1.65–1.76% (Fig. 10b). The aforementioned mechanisms can be verified by the difference in surface morphology between the shales with low clay mineral content and the shales with high clay mineral content. As displayed in Fig. 11, all the shale samples comprise few organic matter and majority of inorganic minerals. Among them, the organic matter of the samples K1, K3, and K10 sparsely and unevenly disperses within the matrix in the form of small aggregates, where develop abundant organic matter hosted-pores and fractures. Moreover, those organic matter usually coexists with inorganic minerals, clay minerals in particular. Considerable organic matter fill fractures formed by inorganic minerals. Overall, fluid accessibility and migration within organic matter–hosted pores of the samples K1, K3, and K10 are significantly affected by the clay mineral hosted-pores. Unlike the aforementioned shale samples, the organic matter containing in the samples K5 and K7 continuously distributes within the matrix as massive aggregates with width up to approximately 60 μm. Thus, the moisture occurrence in the clay mineral-hosted pores of the samples K5 and K7 do not show distinct impacts on CH4 adsorption on the organic matter–hosted pores.
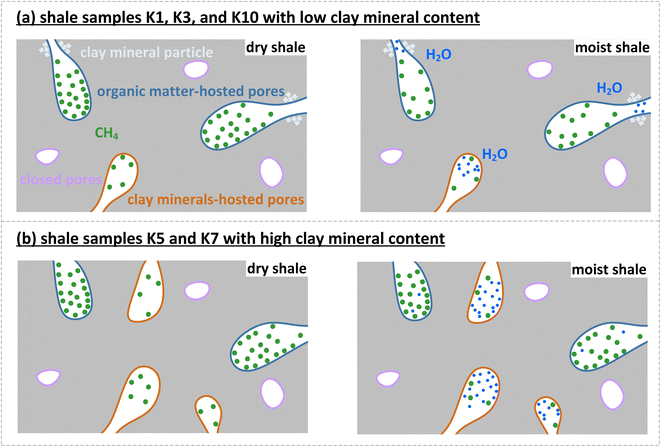 | ||
| Fig. 10 Illustration for negative impacts of pseudo-in situ moisture on CH4 adsorption on shale matrix. | ||
Moreover, the isosteric adsorption heat (q0) characterizing adsorption thermodynamics can be obtained from eqn (6).57 As shown in Fig. 12, the isosteric adsorption heat of CH4 of the dry shale is greater than that on the moist shales. Thus, the decreasing isosteric adsorption heat implies that the pseudo-in situ moisture weakens the adsorption affinity toward CH4-shale system.
| q0 = qv − εANA | (6) |
3.4 Roles of pseudo-in situ moisture in CH4 adsorption/desorption hysteresis
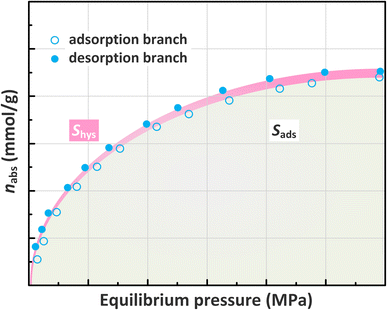
The knowledge on CH4 desorption rather than its adsorption should be given more priority to guide shale gas production. Hence, the impacts of pseudo-in situ moisture on CH4 desorption capability of shale samples are also investigated. The adsorption/desorption hysteresis is found for all the CH4-shale systems (Fig. 13). Furthermore, the pseudo-in situ moisture strengthens hysteresis for all the dry shales. To definitely address the impacts, the hysteresis index (HI) is employed in this study. The absolute adsorption isotherm representing actual adsorption amount derived from eqn (7) is shown in Fig. 14. Afterward, the hysteresis index for all the shales can be calculated from integral areas corresponding to absolute adsorption/desorption isotherms as indicated in eqn (8).6,83
 | (7) |
 | (8) |
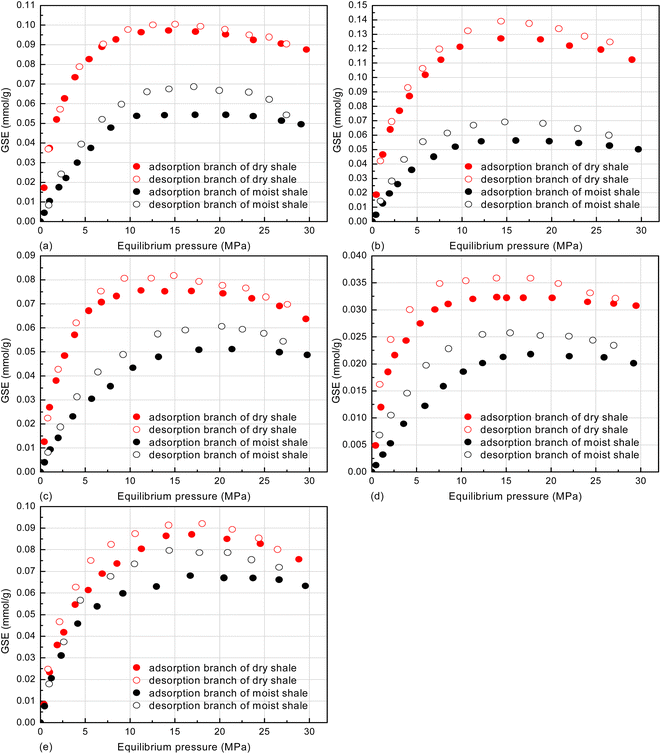 | ||
| Fig. 13 GSE adsorption/desorption isotherms of CH4 on deep shale samples at 353.15 K, (a) K1, (b) K3, (c) K5, (d) K7, and (e) K10. | ||
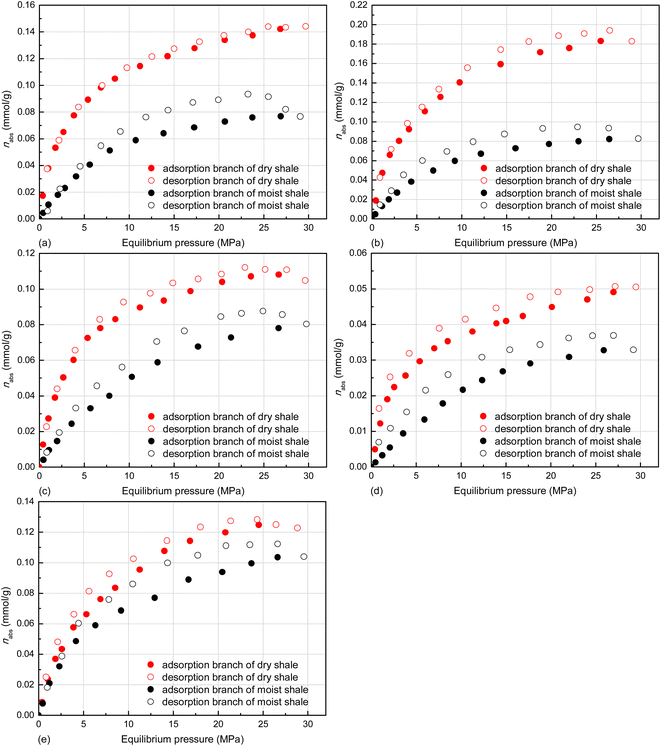 | ||
| Fig. 14 Absolute adsorption/desorption isotherms of CH4 on deep shale samples at 353.15 K, (a) K1, (b) K3, (c) K5, (d) K7, and (e) K10. | ||
The comparison in the hysteresis index listed in Table 5 shows that the pseudo-in situ moisture significant increases the adsorption/desorption hysteresis of CH4 on the dry samples, the sample K1 in particular. Currently, the capillary condensation theory is always used to interpretate hysteresis phenomenon, especially for N2 adsorption/desorption on various porous media.84 However, the operating temperature far above the critical temperature of CH4 as previously indicated cannot make CH4 be liquefied. Therefore, the capillary condensation theory cannot address the hysteresis found in this study. Instead, the hysteresis is probably relevant to fluid uptake-induced swelling of clay minerals. As for the dry shales, the adsorption of CH4 could induce matrix swelling.85 The resultant narrowed pore throat goes against CH4 desorption (Fig. 16b), thus leading to adsorption/desorption hysteresis of CH4 on the dry shales. When it comes to the moist shales, the pores with the diameters of 1.10–4.10 nm of the hydrophilic clay minerals contained in the deep shales mainly accommodate the pseudo-in situ moisture as stated in Sections 3.1 and 3.2. The occurrence of pseudo-in situ moisture is also capable of inducing swelling of clay minerals, which mainly comprises crystalline swelling and osmotic swelling.86 The detailed interpretation regarding the mechanism of the above-mentioned swelling can be found in ref. 87 and 88. It is noteworthy that H2O uptake instead of CH4 adsorption could induce more remarkable swelling of clay minerals. Hence, the pore throat could become highly narrowed (Fig. 16d), which could further raise difficulty to CH4 desorption from moist shale matrix. Therefore, the adsorption/desorption hysteresis of CH4 on the moist samples tends to be more pronounced.
| Sample | State | Sads | Sdes | HI (%) |
|---|---|---|---|---|
| K1 | Moist | 1.68 | 2.01 | 19.64 |
| dry | 3.35 | 3.41 | 1.79 | |
| K3 | Moist | 1.86 | 2.23 | 19.89 |
| Dry | 4.15 | 4.42 | 6.51 | |
| K5 | Moist | 1.64 | 1.91 | 16.46 |
| Dry | 2.59 | 2.72 | 5.02 | |
| K7 | Moist | 0.67 | 0.82 | 22.39 |
| Dry | 1.12 | 1.23 | 9.82 | |
| K10 | Moist | 2.25 | 2.58 | 14.67 |
| Dry | 2.75 | 2.94 | 6.91 |
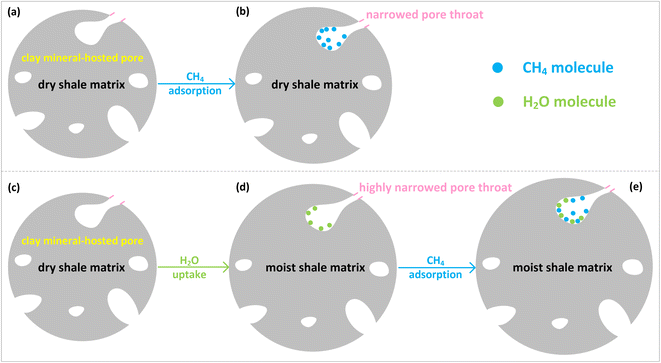 | ||
| Fig. 16 Illustration for roles of pseudo-in situ moisture in CH4 adsorption/desorption hysteresis on shale matrix. | ||
4 Insights into shale gas exploration and production
Considering the critical role of adsorbed gas in shale gas systems, gas adsorption and desorption capacities are of great importance for gas storage evaluation and production. As there is always moisture existing in shale gas reservoirs, it is necessary to understand the effects of moisture on the adsorption and desorption of CH4 in shales. Depending on the moisture effect on gas adsorption, the gas adsorption capacity under in situ conditions can be estimated reliably. Particularly, the current volumetric method or gravimetric method for estimating CH4 adsorption amount on moist shale matrix ignores the potential interference of moisture migration during the measurement on data reliability. Currently, the terahertz wave has been demonstrated as a competitive noncontact spectroscopic technique to monitor trace moisture. Fan et al. indicate that the limit of detection of moisture reaches 62 ppm under the atmosphere of CH4 with pressure of 10 MPa via terahertz wave.89 Hence, the integration of terahertz wave into current volumetric method or gravimetric method could become a novel and effective option to calibrate CH4 adsorption capacity of moist shales.Moreover, the occurrence of moisture in shale not only explains how the moisture impairs the gas adsorption but also gives insights into the moisture effect on gas transport, which is meaningful for shale gas recovery. On the other hand, the moisture effect on gas desorption clarifies the low contribution of adsorbed gas to gas production. Meanwhile, it suggests promising methods to improve the adsorbed gas recovery. For instance, microwave irradiation is expected to serve as an auxiliary technology to existing hydraulic fracturing to high-efficiently produce shale gas. Concretely, microwave with frequency range of 0.3–300 GHz is hopeful to eliminate negative impacts of moisture on shale gas production. Microwave irradiation is highlighted in volumetric and selective heating.90 The liquid moisture molecules own strong electric dipoles with dipole moment of 2.3–3.1 D.91–93 Therefore, the dipoles in moisture molecules could rotate in ultra-high frequency under alternating electric field induced by microwave energy,94 thereby further leading to rapid temperature rising of moisture molecules. Accordingly, microwave irradiation is capable of draining reservoir moisture and eliminating its negative impacts on CH4 desorption found in this study as well as the moisture-induced blocking effect and the Jamin effect.67 Consequently, microwave irradiation as an auxiliary technology to hydraulic fracturing could be employed to secondary shale gas production.
5 Conclusions
The occurrence of moisture in deep gas-bearing shale matrix and relevant influences on CH4 adsorption/desorption capability under favorable reservoir conditions were studied. The conclusions obtained from this study are as follows.(1) The pseudo-in situ moisture content of all the shales falls into the range of 0.57–0.94%. The positive correlation exists between pseudo-in situ moisture content and clay mineral content, while the opposite correlation is found for total organic carbon content and quartz content.
(2) The clay minerals rather than organic matter of shale matrix contribute greatly to moisture occurrence. The pores with the diameters of 1.10–4.10 nm of shale matrix serve as the dominant space for pseudo-in situ moisture accommodation.
(3) The minor pseudo-in situ moisture could remarkably weaken CH4 adsorption capability of the shales with low clay mineral content through blocking pore throats of organic matter–hosted pores. Oppositely, the abundant pseudo-in situ moisture only slightly reduces CH4 adsorption capability of the shales with high clay mineral content due to continuous distribution of organic matter–hosted pores.
(4) The pseudo-in situ moisture strengthens adsorption/desorption hysteresis of CH4 on shale matrix owing to moisture uptake-induced clay mineral swelling. Therefore, pseudo-in situ moisture could raise difficulty for CH4 desorption from shale matrix.
Conflicts of interest
The authors declare no competing financial interest.Acknowledgements
This work is funded by the National Natural Science Foundation of China (Grant No. 52264001 and 42272202), the Open Foundation of the Key Laboratory of Shale Oil and Gas Exploration and Production, SINOPEC (Grant No. 33550000-22-ZC0613-0211), the Yunnan Ten Thousand Talents Plan Young & Elite Talents Project (Grant No. YNWRQNBJ-2019-164), and the Yunnan Major Scientific and Technological Projects (Grant No. 202302AG050002).References
- C. N. Zou, D. Z. Dong, S. J. Wang, J. Z. Li and K. M. Cheng, Pet. Explor. Dev., 2010, 37, 641–653 CrossRef CAS.
- C. N. Zou, Q. Zhao, L. Z. Cong, H. Y. Wang, Z. S. Shi, J. Wu and S. Q. Pan, Nat. Gas Ind., 2021, 41, 1–14 Search PubMed.
- Y. Liu and Y. Zhu, Int. J. Coal Sci. Technol., 2016, 3, 330–338 CrossRef CAS.
- W. M. Ji, Y. Song, Z. X. Jiang, X. Z. Wang, Y. Q. Bai and J. Y. Xing, Int. J. Coal Geol., 2014, 134, 61–73 CrossRef.
- J. Liu, Y. B. Yao, D. M. Liu and D. Elsworth, Int. J. Coal Geol., 2017, 179, 211–218 CrossRef CAS.
- X. W. Cai, D. Y. Li and D. F. Zhang, Energy Fuels, 2022, 36, 11888–11902 CrossRef CAS.
- J. B. Curtis, AAPG Bull., 2002, 86, 1921–1938 CAS.
- P. L. Huo, D. F. Zhang, Z. Yang, W. Li, J. Zhang and S. Q. Jia, Int. J. Greenhouse Gas Control, 2017, 66, 48–59 CrossRef CAS.
- P. L. Huo, D. F. Zhang, Q. Q. Wang, W. Li, J. Tao, H. H. Wang and J. Peng, Chem. Ind. Eng. Prog., 2016, 35, 74–82 CAS.
- Y. G. Hou, S. He, J. Z. Yi, B. G. Zhang, X. H. Chen, Y. Wang, J. K. Zhang and C. Y. Cheng, Pet. Explor. Dev., 2014, 41, 272–281 CrossRef.
- M. Gasparik, P. Bertier, Y. Gensterblum, A. Ghanizadeh, B. M. Krooss and R. Littke, Int. J. Coal Geol., 2014, 123, 34–51 CrossRef CAS.
- F. Yang, Z. F. Ning, R. Zhang, H. W. Zhao and B. M. Krooss, Int. J. Coal Geol., 2015, 146, 104–117 CrossRef CAS.
- D. G. Hill, T. E. Lombardi and J. P. Martin, Fractured Gas Shale Potential in New York, Arvada TICORA Geosciences Inc, Colorado, 2004 Search PubMed.
- D. T. Kong, Z. F. Ning, F. Yang and D. X. Xu, Eng. Sci. Technol., 2014, 14, 108–111 Search PubMed.
- T. W. Zhang, G. S. Ellis, S. C. Ruppel, K. Milliken and R. S. Yang, Org. Geochem., 2012, 47, 120–131 CrossRef CAS.
- S. B. Wang, Z. G. Song, T. T. Cao and J. Xia, Geochim, 2014, 43, 429–436 CAS.
- X. Song, S. B. Wang, T. T. Cao and Z. G. Song, Acta Geol. Sin., 2013, 87, 1041–1048 CAS.
- J. Q. Tan, P. Weniger, B. Krooss, A. Merkel, B. Horsfield, J. C. Zhang, C. J. Boreham, G. Van Graas and B. A. Tocher, Fuel, 2014, 129, 204–218 CrossRef CAS.
- H. Y. Hu, Chin. J. Geochem., 2014, 33, 425–430 CrossRef CAS.
- X. Liang, T. S. Zhang, Y. Yang, Z. Zhang, Q. S. Gong, X. Ye and J. H. Zhang, Nat. Gas Ind., 2014, 34, 18–26 Search PubMed.
- L. Chen, Z. X. Jiang, J. Y. Xing, D. X. Chen, M. X. Xie and W. M. Ji, Geosci, 2014, 28, 824–831 Search PubMed.
- Y. L. Su, Q. H. Sun, W. D. Wang, X. C. Guo, J. L. Xu, G. Q. Li, X. G. Pu, W. Z. Han and Z. N. Shi, Int. J. Coal Sci. Technol., 2022, 9, 69 CrossRef CAS.
- F. Y. Wang, S. C. Zhang, B. M. Zhang and M. J. Zhao, Xinjiang Pet. Geol., 1999, 20, 221–224 Search PubMed.
- R. Aringhieri, Clays Clay Miner., 2004, 52, 700–704 CrossRef CAS.
- C. C. Wang, L. C. Juang, C. K. Lee, T. C. Hsu, J. F. Lee and H. P. Chao, J. Colloid Interface Sci., 2004, 280, 27–35 CrossRef CAS PubMed.
- L. M. Ji, J. L. Qu, Z. G. Song and Y. Q. Xia, Geochimic, 2014, 43, 238–244 CAS.
- J. Zou, R. Rezaee, Q. Xie, L. J. You, K. Q. Liu and A. Saeedi, Fuel, 2018, 232, 323–332 CrossRef CAS.
- C. F. Ukaomah, M. D. Sun, Z. J. Pan, M. Ostadhassan, B. Liu, Q. B. Meng, M. D. Aminu and M. Fischer, J. Hydrol., 2023, 621, 129672 CrossRef CAS.
- J. Zou, R. Rezaee, Q. Xie, L. J. You, K. Q. Liu and A. Saeedi, Fuel, 2018, 232, 323–332 CrossRef CAS.
- C. J. Luo, D. F. Zhang, C. P. Zhao, Z. M. Lun, J. Yang, Y. H. Li and H. T. Wang, Chem. Ind. Eng. Prog., 2019, 38, 2726–2737 Search PubMed.
- L. Huang, Z. F. Ning, Q. Wang, R. R. Qi, Y. Zeng, H. B. Qin, H. T. Ye and W. T. Zhang, Fuel, 2018, 211, 159–172 CrossRef CAS.
- W. X. Ren, J. C. Guo, F. H. Zeng and T. Y. Wang, Energy Fuels, 2019, 33, 7043–7051 CrossRef CAS.
- W. N. Yuan, Z. J. Pan, X. Li, Y. X. Yang, C. X. Zhao, L. D. Connell, S. D. Li and J. M. He, Fuel, 2014, 117, 509–519 CrossRef CAS.
- J. Li, X. F. Li, X. Z. Wang, Y. Y. Li, K. L. Wu, J. T. Shi, L. Yang, D. Feng, T. Zhang and P. L. Yu, Int. J. Coal Geol., 2016, 159, 35–154 Search PubMed.
- F. Yang, C. J. Xie, Z. F. Ning and B. M. Krooss, Energy Fuels, 2016, 31, 482–492 CrossRef.
- A. Merkel, R. Fink and R. Littke, Int. J. Coal Geol., 2015, 147–148, 1–8 CrossRef CAS.
- M. Gasparik, A. Ghanizadeh, Y. Gensterblum and B. M. Krooss, Rev. Sci. Instrum., 2013, 84, 1–9 CrossRef PubMed.
- A. Merkel, R. Fink and R. Littke, Fuel, 2016, 182, 361–372 CrossRef CAS.
- N. Jiang, C. Li, G. H. Chen, T. L. Guo, Y. Y. Wu, X. P. He, Y. Q. Gao and P. X. Zhang, Reserv. Evaluation Dev., 2022, 12, 399–406 Search PubMed.
- W. Wang, D. H. Li, L. J. Cheng, Y. Zhang, J. X. Wang, Z. P. Zhang, H. L. Zhang, D. X. Guo, Y. L. Zhang, Q. Hua, J. Liu and F. Z. Yan, Geofluids, 2022, 2022, 1–14 Search PubMed.
- X. S. Guo, Y. P. Li, R. B. Liu and Q. B. Wang, Nat. Gas Ind., 2014, 34, 9–16 CAS.
- International Organization for Standardization, Plastics — Small Enclosures for Conditioning and Testing Using Aqueous Solutions to Maintain the Humidity at a Constant Value, 2005, ISO 483:2005 Search PubMed.
- X. S. Guo, Jiaoshiba Black Enrichment Mechanism of Shale Gas and Exploration Technology in Fuling Shale Gas Field, Science Press, Beijing, 2014, pp. 111–127 Search PubMed.
- Ministry of Land and Resources of the People's Republic of China, DZ/T 0254-2020, Standards Press of China, Beijing, 2020.
- K. S. W. Sing, Pure Appl. Chem., 1985, 57, 603–619 CrossRef CAS.
- D. Chandra, T. Bakshi, J. Bahadur, B. Hazra, V. Vishal, S. Kumar, D. Sen and T. N. Singh, Fuel, 2023, 331, 125877 CrossRef CAS.
- X. X. Fu, C. P. Zhao, Z. M. Lun, H. T. Wang, M. Wang and D. F. Zhang, Mar. Pet. Geol., 2021, 130, 105134 CrossRef CAS.
- G. Amarasekera, M. J. Scarlett and D. E. Mainwaring, Fuel, 1995, 74, 115–118 CrossRef CAS.
- Y. Xu, Z. M. Lun, H. T. Wang, X. Zhou, C. P. Zhao, G. L. Zhang and D. F. Zhang, J. Pet. Sci. Eng., 2022, 219, 111067 CrossRef CAS.
- X. X. Fu, Z. M. Lun, C. P. Zhao, X. Zhou, H. T. Wang, X. T. Zhou, Y. Xu, H. Zhang and D. F. Zhang, Fuel, 2021, 301, 121022 CrossRef CAS.
- D. F. Zhang, J. Zhang, P. L. Huo, Q. Q. Wang, H. H. Wang, W. P. Jiang, J. Tao and L. Zhu, Energy Fuels, 2016, 30, 5911–5921 CrossRef CAS.
- S. Brunauner, S. Emmett and E. J. Teller, J. Am. Chem. Soc., 1938, 60, 309–319 CrossRef.
- E. P. Barrett, L. G. Joyner and P. P. Halenda, J. Am. Chem. Soc., 1951, 73, 373–380 CrossRef CAS.
- B. Ullah, Y. P. Cheng, L. Wang, W. H. Yang, I. M. Jiskani and B. Hu, Int. J. Coal Sci. Technol., 2022, 9, 58 CrossRef CAS.
- W. Wagner and R. Span, Int. J. Thermophys., 1993, 14, 699–725 CrossRef CAS.
- Q. Q. Wang, D. F. Zhang, H. H. Wang, W. P. Jiang, X. P. Wu, J. Yang and P. L. Huo, Energy Fuels, 2015, 29, 3785–3795 CrossRef CAS.
- D. F. Zhang, Y. J. Cui, B. Liu, S. G. Li, W. L. Song and W. G. Lin, Energy Fuels, 2011, 25, 1891–1899 CrossRef CAS.
- J. Wood, Q. Lan, M. Xu and H. Dehghanpour, Spe Technical Conference Exhibition, 2014 Search PubMed.
- M. R. Yassin, M. Begum and H. Dehghanpour, Int. J. Coal Geol., 2017, 169, 74–91 CrossRef CAS.
- L. Wang and Q. C. Yu, J. Hydrol., 2016, 542, 487–505 CrossRef CAS.
- E. Arthur, M. Tuller, P. Moldrup and L. W. Jonge, Eur. J. Soil Sci., 2019, 71, 204–214 CrossRef.
- C. D. Hatch, J. S. Wiese, C. C. Crane, K. J. Harris, H. G. Kloss and J. Baltrusaitis, Langmuir, 2012, 28, 1790–1803 CrossRef CAS PubMed.
- X. D. Du and N. Wang, AIChE J., 2021, 68, 17550–17551 CrossRef.
- S. Brunauer, L. S. Deming, W. E. Deming and E. Teller, J. Am. Chem. Soc., 1940, 62, 1723–1732 CrossRef CAS.
- R. T. Yang, Adsorbents: Fundamentals and Applications, John Wiley and Sons Inc, New York, 2003, pp. 131–156 Search PubMed.
- M. D. Sun, B. S. Yu, Q. H. Hu, S. Chen, W. Xia and R. C. Ye, Int. J. Coal Geol., 2016, 154–155, 16–29 CrossRef CAS.
- Y. Xu, Z. M. Lun, Z. J. Pan, H. T. Wang, X. Zhou, C. P. Zhao and D. F. Zhang, J. Pet. Sci. Eng., 2022, 211, 110183 CrossRef CAS.
- B. Zhang, J. T. Kang, T. H. Kang, G. X. Kang and G. F. Zhao, Int. J. Coal Sci. Technol., 2019, 6, 556–563 CrossRef CAS.
- J. Chen, Y. L. Xu, H. F. Gai, Q. L. Xiao, J. Z. Wen, Q. Zhou and T. F. Li, Mar. Pet. Geol., 2021, 130, 105120 CrossRef CAS.
- G. P. Wang, Z. J. Jin, Q. Zhang, R. K. Zhu, X. Tang, K. Q. Liu and L. Dong, J. Asian Earth Sci., 2023, 246, 105516 CrossRef.
- K. Q. Liu, M. Ostadhassan, J. Zou, T. Gentzis, R. Rezaee, B. Bubach and H. Carvajal-Ortiz, Fuel, 2018, 226, 441–453 CrossRef CAS.
- S. B. Chen, C. Zhang, X. Y. Li, Y. K. Zhang and X. Q. Wang, Int. J. Coal Sci. Technol., 2021, 8, 844–855 CrossRef CAS.
- J. Ceponkus, A. Engdahl, P. Uvdal and B. Nelander, Chem. Phys. Lett., 2013, 581, 1–9 CrossRef CAS.
- K. M. Thomas, Energy Fuels, 2023, 37, 2569–2585 CrossRef CAS.
- X. Tang, X. W. Cai, Y. Xu and D. F. Zhang, Ind. Eng. Chem. Res., 2023, 62, 7235–7249 CrossRef CAS.
- S. Yang, C. P. Zhao, B. Y. Ji and Y. F. He, Fuel, 2023, 331 Search PubMed.
- G. L. Aranovich and M. D. Donohue, J. Colloid Interface Sci., 1996, 180, 537–541 CrossRef CAS.
- Y. Genterblum, A. Merkel, A. Busch and B. M. Krooss, Int. J. Coal Geol., 2013, 118, 45–57 CrossRef.
- C. R. Clarkson and B. Haghshenas, Paper SPE 164532 present at the SPE Unconventional Resources Conference, The Woodlands, Texas, USA, 2013 Search PubMed.
- S. W. Zhou, H. Q. Xue, Y. Ning, W. Guo and Q. Zhang, Fuel, 2018, 211, 140–148 CrossRef CAS.
- L. Chen, L. Zuo, Z. X. Jiang, S. Jiang, K. Y. Liu, J. Q. Tan and L. C. Zhang, Chem. Eng. J., 2019, 361, 559–570 CrossRef CAS.
- R. Perry and D. Green, Perry's Chemical Engineers' Handbook, McGraw-Hill: New York, 1997 Search PubMed.
- H. X. Zhu and H. Selim, Soil Sci., 2000, 165, 632–645 CrossRef CAS.
- D. D. Do, Adsorption Analysis: Equilibria and Kinetics, Imperial College Press: London, 1998 Search PubMed.
- D. Miedzinska and M. Lutynski, Physicochem. Probl. Miner. Process., 2018, 54, 415–427 CAS.
- L. L. Wang, G. Q. Zhang, S. Hallais, A. Tanguy and D. S. Yang, Energy Fuels, 2017, 31, 10442–10451 CrossRef CAS.
- W. J. Likos and N. Lu, Clays Clay Miner., 2006, 54, 515–528 CrossRef CAS.
- J. Goncalves, P. Rousseau-Gueutin, G. D. Marsily, P. Cosenza and S. Violette, Water Resour. Res., 2010, 46, W045014.1–W045014.16 CrossRef.
- S. T. Fan, K. Jeong, V. P. Wallace and Z. Aman, Energy Fuels, 2019, 33, 8026–8031 CrossRef CAS.
- H. Zhang, Z. M. Lun, X. Zhou, H. T. Wang, C. P. Zhao and D. F Zhang, Energy Fuels, 2021, 35, 19464–19480 CrossRef CAS.
- P. L. Silvestrelli and M. Parrinello, Phys. Rev. Lett., 1999, 82, 3308–3311 CrossRef CAS.
- R. B. Enrique, S. X. Sotiris and J. Hannes, J. Chem. Phys., 1999, 111, 6011–6015 CrossRef.
- C. A. Coulson and D. Eisenberg, Proc. R. Soc. A, 1966, 291, 445–453 CAS.
- Q. H. Zhao, X. B. Zhao, Y. L. Zheng, J. C. Li and C. J. Zou, Int. J. Rock Mech. Min. Sci., 2020, 136, 104495 CrossRef.
| This journal is © The Royal Society of Chemistry 2023 |

