 Open Access Article
From doping to composites: zirconia (ZrO2) modified hematite photoanodes for water splitting†
Saima Qureshiab,
Duncan H. Gregory b,
Asif Ali Tahir
 c and
Safeer Ahmed
 *a
*a
aDepartment of Chemistry, Quaid-i-Azam University, 45320, Islamabad, Pakistan. E-mail: safeerad@qau.edu.pk
bWest CHEM, School of Chemistry, University of Glasgow, Glasgow G12 8QQ, UK
cEnvironment and Sustainability Institute (ESI), University of Exeter, Penryn Campus, TR10 9FE, UK
First published on 29th November 2023
Abstract
Herein, a ZrO2 added α-Fe2O3 photoanode that can split water at low applied potential is reported. First, the pristine hematite α-Fe2O3 photoanode was synthesized using an aerosol-assisted chemical vapour deposition (AACVD) method followed by modification with various amounts of ZrO2 (2 to 40%) in the form of thin films on conducting glass substrate. The XRD, Raman spectroscopy and scanning electron microscopy (SEM) analyses confirmed the presence of the monoclinic phase of ZrO2 in the composites with multifaceted particles of compact morphology. The optical analysis showed an increase in the absorbance and variation in band gap of the composites ascribed to the heterogeneity of the material. The photoelectrochemical studies gave a photocurrent density of 1.23 mA cm−2 at 1.23 V vs. RHE for the pristine hematite and remarkably higher value of 3.06 mA cm−2 for the optimized amount of ZrO2 in the modified α-Fe2O3 photoanode. To the best of our knowledge, this is the highest photocurrent reported for a ZrO2 containing photoanode. The optimized composite electrode produced nine times more oxygen than that produced by pristine hematite.
I. Introduction
Due to the growing demand for energy, the depletion of fossil fuels and increasing concern over global warming, much effort has been expended in searching for clean and renewable energy sources. Solar energy is among the most promising candidates to provide an environmentally benign alternative to fossil fuels. However, the intermittence of solar light hampers its direct use in many applications. To utilize solar energy more effectively, technologies that can store the harvested energy efficiently and inexpensively for use on demand are needed. Photoelectrochemical (PEC) water splitting is a promising approach to address this energy challenge. The development of the semiconductor electrodes that are required for PEC water splitting is therefore, of paramount importance. These electrodes must satisfy several key requirements to perform efficiently.Among various water splitting photoanode materials, hematite (α-Fe2O3) has several promising properties, including an appropriate band gap (1.9–2.2 eV), so as to maximize the absorption of the solar spectrum,1,2 stability in an aqueous environment under typical operating conditions,3 earth-abundance4 and affordability.5 Although these properties showcase α-Fe2O3 as a photoanode for proof-of-concept demonstrations, several key issues such as its relatively poor absorption coefficient (due to an indirect band gap)4,6 a very short excited-state lifetime (∼10–12 s),4 poor oxygen evolution reaction kinetics2,4 and a short hole diffusion length (2–4 nm)2,7 limit its PEC activity and practical use. Even though tremendous efforts have been made to improve the photocatalytic activity of α-Fe2O3, the recorded water oxidation photocurrent is still far lower than the theoretical maximum (Jmax) which equates to 12.5 mA cm−2 under AM 1.5 G solar illumination. There are three basic governing factors which make the practical water oxidation photocurrent (JH2O) so much lower than Jmax; limited photon absorption, poor charge separation efficiency (ηsep), and low charge injection efficiency (ηinj).8,9 Various efforts have been made to overcome these constraints and to improve the PEC performance of hematite. The limited photon absorption, for example, can be enhanced by nanostructuring10 or by the introduction of metallic or non-metallic dopants (which increase photon absorption through band gap narrowing).11
Generally, photocatalytic water splitting demands fundamental requirements from potential photocatalysts including appropriate band gaps and band positions. For the water reduction reaction,12 the conduction band needs to be at a potential less than 0 V vs. the normal hydrogen electrode (NHE; H+/H2) while the valence band needs to be at a potential exceeding 1.23 V, which corresponds to light with a wavelength of 1008 nm as depicted in Fig. 1.
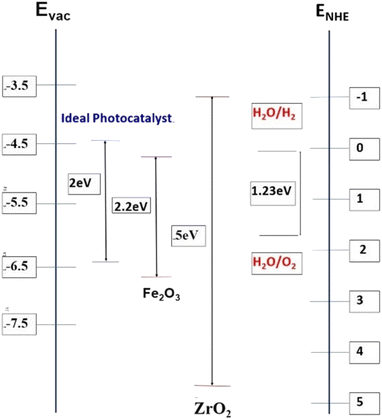 | ||
| Fig. 1 Band edge positions and bandgaps (in eV) for hematite and zirconia (vs. vacuum and vs. NHE) as compared to an “ideal” PEC water splitting catalyst. | ||
As ultraviolet light has much higher photonic energy than visible light, ultraviolet-based photocatalysts perform better per photon for hydrogen production via solar water splitting than visible light-based ones. In fact, most of the reported photocatalysts to date are only active under ultraviolet light irradiation. However, ultraviolet light (<400 nm) only accounts for 4% of the solar spectrum whereas visible light (400–800 nm) and infrared light (>800 nm) account for 53% and 43%, respectively. Since ultraviolet light accounts for only a small portion of the available solar energy, it is critical to produce photocatalysts that are active over a broad spectral range; even a less-efficient photocatalyst that absorbs visible light can be more useful than a higher efficiency photocatalyst that is restricted to ultraviolet light absorption.
Many attempts have also been made to enhance the poor charge separation efficiency of α-Fe2O3. These include: reducing the thickness of hematite films (with the aim of improving the hole diffusion length)13 or anisovalent doping of cations of charge greater than +3 (to introduce additional majority carriers and create steeper voltage gradients – i.e. thinner space-charge layers – so as to enhance charge separation).14
In the present study, we started by growing single-crystalline Fe2O3 nanorod arrays directly on a fluorine doped tin oxide (FTO) coated glass substrate by aerosol-assisted chemical vapour deposition (AACVD) at 525 °C. These arrays were employing judicious additions of ZrO2 during the synthesis to yield films of varying composition in a bid to introduce additional majority carriers and improve the electrical conductivity of the electrode further. Two recent studies have shown that ZrO2-doped hematite photoanodes can exhibit a significantly improved PEC response.15,16 These findings are also supported by ab initio quantum mechanics calculations17 where the authors suggested that doping zirconium into hematite is superior to doping titanium because the former metal does not introduce electron trapping sites (given the lower stability of Zr(III) compared to Ti(III)). Considering the importance of the ZrO2 the purpose of this study was to investigate the varying amounts of ZrO2 (2%, 5%, 10%, 20%, 30% and 40%) in the hematite and see its effects on the structure of the host which in turn will affect its optoelectrical properties. All the films were characterized first for their morphological aspects using XRD, Raman and scanning electron microscopy (SEM) analyses. Next the PEC and electrochemical impedance spectroscopy (EIS) analyses were made to investigate the performance of the material.
II. Experimental
A. Materials and chemicals
Nanostructured α-Fe2O3 and ZrO2/α-Fe2O thin films were deposited on fluorine-doped tin oxide (FTO) glass (TEC 8 Pilkington, 8 Ω per square). Ferric chloride (99%) and zirconium acetylacetonate (99%) were obtained from Sigma-Aldrich and absolute methanol was sourced from Fisher Scientific. These chemicals were used without further purification. Double de-ionized water (DDW; obtained either from a Sigma Aldrich Milli-Q® direct water purification system) with a resistivity of ca. 18.2 M Ω cm was used for the preparation of all the solutions. The FTO glass substrates were cleaned ultrasonically with ethanol, iso-propanol and acetone in sequence for 15 minutes each. The substrates were then washed with de-ionized water to remove any remaining impurities and dried with compressed air prior to their use in thin film preparations.18B. Procedure and methodology
AACVD was used for thin film preparations in this work. Texture-controlled nanostructured zirconia-added hematite thin films were fabricated using iron(III) chloride as the basis hematite precursor and employing methanol as a solvent.Nanostructured zirconia/α-Fe2O3 thin films were deposited on FTO glass substrates by AACVD using FeCl3 and zirconium acetyl acetonate solutions in different percentage compositions. 0.1 M FeCl3 methanolic precursor solutions were prepared containing 0, 2, 5, 10, 20, 30 and 40 wt% zirconium acetylacetonate used separately in the respective aerosols. The aerosol was generated by means of a pneumatic collision generation method using a TSI Model 3076 Constant Output Atomiser, which typically generates 0.3 μm-sized aerosol droplets. The aerosol was carried to the reaction chamber by a stream of compressed air, which was kept at a constant pressure of 2 bar during deposition. The compressed air carrier gas was employed at a flow rate of 150 ml min−1 while the deposition temperature of the hot plate was maintained at 525 °C. Each electrode was deposited for a period of 20, 25 and 30 min, respectively. In addition to the hotplate thermometer, the temperature of the FTO substrate surface was also measured using an external thermocouple prior to and during deposition. The morphology and nanostructure of the thin films were controlled by altering the deposition temperature.
C. Characterization techniques
Powder X-ray diffraction (XRD). An X'Pert PRO MPD diffractometer equipped with a monochromator and using Cu Kα1 radiation, was used to analyze the phase and crystallinity of the deposited film. Diffraction data were collected on flat-plate samples in Bragg–Brentano geometry using a minimum step size of 0.001° 2θ.
Scanning electron microscopy/energy dispersive X-ray spectroscopy (SEM/EDX) and atomic force microscopy (AFM). SEM was used to establish the morphology of the zirconia/α-Fe2O3 nanocrystalline films using a Philips XL30 ESEM microscope with a secondary electron detector for imaging. EDX was performed in the microscope using an Oxford Instruments Inca Energy 250 system with a liquid nitrogen-free detector. All the substrate-supported samples were loaded onto carbon tabs mounted on aluminum sample stubs. The atomic force microscopy (AFM) measurements were carried out to measure surface roughness and topography of the deposited films. The AFM machine from Nanosurf Flex (Version 5) running with a nanosurf C300 software was used. The image size/feature area was kept at 6.25 μm2 and 12.5 μm2 for all the samples. Analysis of the obtained AFM results was conducted by using Gwyddion 2.64 software.
 | (1) |
III. Results and discussions
A. Structural characterization
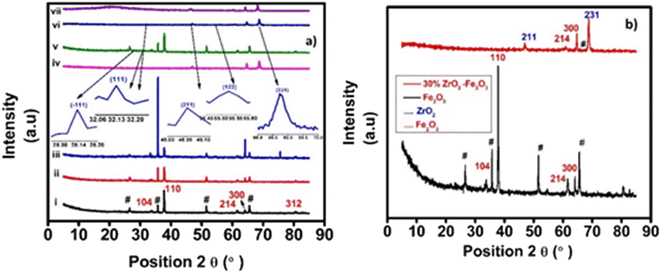
The Scherrer method was applied to the XRD data using (2) in order to obtain a first estimate for the average crystallite size in the zirconia/hematite films:18,22
B(2θ) = Kλ/β![[thin space (1/6-em)]](https://www.rsc.org/images/entities/char_2009.gif) cos cos![[thin space (1/6-em)]](https://www.rsc.org/images/entities/char_2009.gif) θ θ
| (2) |
![[3 with combining macron]](https://www.rsc.org/images/entities/char_0033_0304.gif) c (No. 167) and seven Raman bands are expected in the corresponding spectrum. As shown elsewhere, the Raman spectrum of an α-Fe2O3 film on an FTO substrate commonly contains two bands that can be assigned as A1g modes at 225 cm−1 and 500 cm−1, respectively and three characteristic bands at 299.7 cm−1, 399.8 cm−1 and 607.6 cm−1, respectively, which can be assigned to Eg modes.20,23 Additionally, bands that are typical of the FTO substrate also appear in the spectrum (at 576 cm−1).24 The most distinctive combination of bands, which is typically employed for the identification of hematite consists of those at 225 cm−1, 290–300 cm−1 and 412 cm−1. It is often reported that the band at ca. 245 cm−1 is visible on the flank of the A1g band at 225 cm−1. Reports in the literature have also indicated that a band at approximately 1305.7 cm−1 exists in experimental spectra but is a vibration which has an unclear origin.22 Earlier it was suggested that this band is caused by the scattering of two magnons in the structure, but then later, the sharp peak is a second harmonic vibration.25 Fig. 3 also shows the Raman spectra of 30 wt% zirconia/hematite as compared to the spectra taken from pure hematite besides rest of the % compositions.
c (No. 167) and seven Raman bands are expected in the corresponding spectrum. As shown elsewhere, the Raman spectrum of an α-Fe2O3 film on an FTO substrate commonly contains two bands that can be assigned as A1g modes at 225 cm−1 and 500 cm−1, respectively and three characteristic bands at 299.7 cm−1, 399.8 cm−1 and 607.6 cm−1, respectively, which can be assigned to Eg modes.20,23 Additionally, bands that are typical of the FTO substrate also appear in the spectrum (at 576 cm−1).24 The most distinctive combination of bands, which is typically employed for the identification of hematite consists of those at 225 cm−1, 290–300 cm−1 and 412 cm−1. It is often reported that the band at ca. 245 cm−1 is visible on the flank of the A1g band at 225 cm−1. Reports in the literature have also indicated that a band at approximately 1305.7 cm−1 exists in experimental spectra but is a vibration which has an unclear origin.22 Earlier it was suggested that this band is caused by the scattering of two magnons in the structure, but then later, the sharp peak is a second harmonic vibration.25 Fig. 3 also shows the Raman spectra of 30 wt% zirconia/hematite as compared to the spectra taken from pure hematite besides rest of the % compositions.
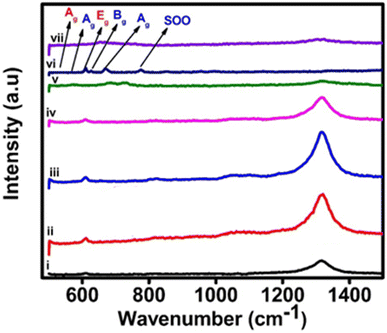 | ||
| Fig. 3 Raman spectra of pristine α-Fe2O3 and composite electrodes of ZrO2/α-Fe2O3, i, ii, iii, iv, v, vi and vii representing 0, 2, 5, 10, 20, 30 and 40% of ZrO2 added hematite. | ||
When comparing the Raman spectra of all the compositions of the zirconia/hematite films in Fig. 3, it is obvious that unlike the spectrum of hematite, each composition exhibits peaks at ca. 179 cm−1, 330 cm−1, 380 cm−1, 474 cm−1, 559 cm−1 and 637 cm−1, respectively. According to the literature, these bands are representative of the monoclinic zirconia structure.21 The Raman spectroscopy results therefore strongly corroborate to those from XRD in indicating the presence of a m-ZrO2-type phase.26 The broad peak at 760 cm−1 can be assigned to a second-order overtone (SOO) scattering band.27
B. Morphological characterization and elemental composition
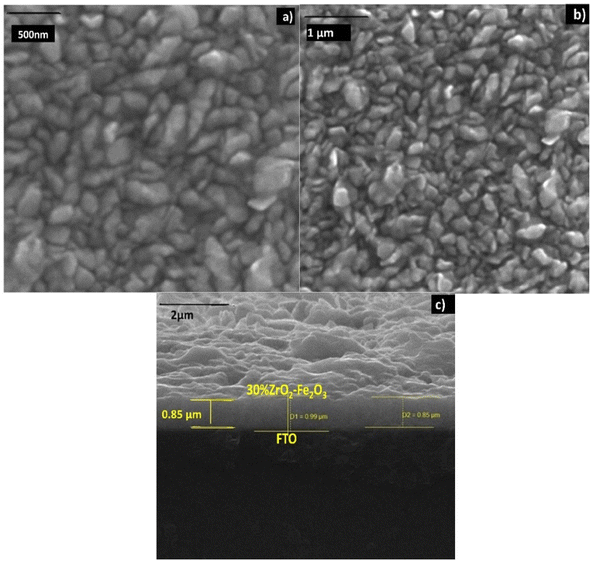 | ||
| Fig. 4 SEM images of 30 wt% zirconia/hematite showing views of the film surface at magnifications of (a) 500 nm and (b) 1 μm, and (c) a cross-sectional view at a magnification of 2 μm respectively. | ||
The sintering of the clusters of microparticles would appear to assist in ensuring a high and homogeneous coverage of the substrate, while allowing the films to retain a degree of macro-porosity, which should be of benefit in terms of their function as electrodes.
Energy dispersive X-ray spectra were taken for each film sample. An example spectrum is presented for the 30 wt% ZrO2/α-Fe2O3 film sample in Fig. S2,† together with a summary of the elemental analysis results. EDX spectra confirmed the presence only of zirconium, oxygen and iron within each film sample. In each case, the relative quantities (at%) of the component elements are in very good agreement with the theoretical values calculated on the basis of the amounts used in the synthesis (Fig. S2†).
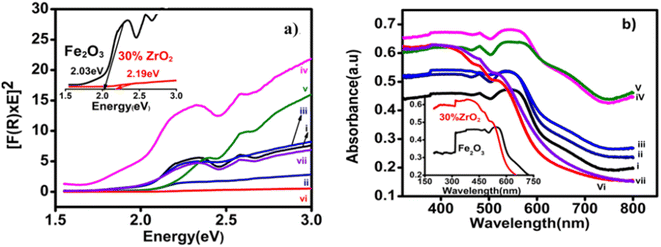
Results of UV-visible spectroscopy. Diffuse reflectance (DR) UV-vis measurements were performed for the various compositions of the AACVD zirconia/hematite thin films. The Kubelka–Munk function, F(R), as a function of wavelength was derived from the measured DR spectra, based on the Kubelka–Munk (K–M) equation.28 A K–M plot of [F(R)hν]2 vs. hν (where hν is the photon energy) was then obtained Fig. 5. The bandgap (Eg) was determined from the extrapolation of the linear fit for the K–M plot onto the energy axis.29
 | (3) |
Fig. 5(a) shows the K–M plots taken from the DR UV-Vis spectra of the zirconia/hematite thin films. The inset in Fig. 5(a) shows further detail how the band gap of the 30 wt% zirconia/hematite sample was obtained from the corresponding K–M plot. The results for the entire range of zirconia/hematite samples are presented in Table S2.† Increasing the concentration of zirconia from 2 wt% to 20 wt% caused a narrowing of the band gap. Since m-ZrO2 itself has a wide gap of approximately 3.6 eV, it is perhaps surprising that the largest values of Eg are not exhibited by the films containing higher levels of zirconia.30,31 In fact, after a steady decrease in Eg from 2 to 20 wt%, the direct gap reaches a maximum among doped samples at 30 wt% ZrO2 (2.14 eV), declining again at 40 wt% ZrO2 (1.96 eV). The authors32 claim that the decrease in the band gap energy could be attributed to a highly disordered structure, as a result of the conditions used in the film preparation method. As a consequence of structural defects, some energy levels are introduced into the semiconductor band gap that allow transitions of lower energy and therefore, lead to a decreased band gap energy.
The corresponding absorbance Fig. 5(b) is found to increase as the amount (wt%) of zirconia is systematically increased in the films and reaches a maximum for the 30 wt% zirconia/hematite sample at approximately 480 nm (i.e., a profound shift towards the UV region compared to pure hematite, which exhibits a λmax at ca. 550 nm) as shown in the inset of Fig. 5(b).
Fig. 6(a) shows the incident photon-to-current conversion efficiencies (IPCEs) of the 30 wt% zirconia/hematite film as compared to a film of hematite itself, as a function of wavelength measured at 0.258 V Ag/AgCl. At fixed potential, the 30 wt% ZrO2/α-Fe2O3 photoanode shows a maximum IPCE of 58% at 285 nm and 48% at 265 nm. The IPCE of the 30 wt% ZrO2/αFe2O3 film is 3.7 times greater than shown by pristine hematite (Table S3†). This result suggests that the 30 wt% ZrO2/α-Fe2O3 film absorbs light efficiently, especially at shorter wavelengths, in the UV-vis region. From Fig. 6(a) it can also be observed that within a wavelength range of 320–420 nm (UV-Vis region) the IPCE is about 14%, much higher than pristine hematite, which can be attributed to the maximum absorption and conversion of incident photons within the film. It is also supported by the largest Eg as well as good photocurrent density.33
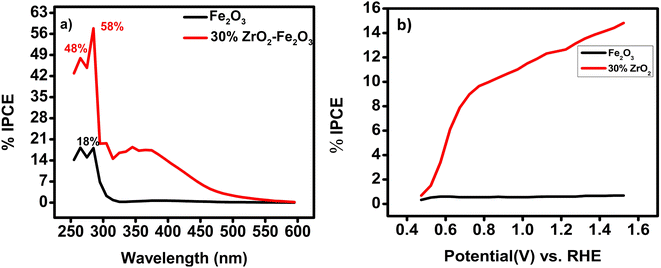 | ||
| Fig. 6 (a) IPCE vs. wavelength for 30 wt% ZrO2-αFe2O3 as compared with a film of pure hematite; (b) IPCE vs. potential at 370 nm for 30 wt% ZrO2-αFe2O3 as compared with a film of pure hematite. | ||
The obtained IPCE values plotted vs. potential for the incident wavelength of 370 nm as shown in Fig. 6(b), are consistent with the data under air mass (AM) 1.5 G simulated solar illumination. From Fig. 6(b), an IPCE of more than 11% at 1.23 V vs. RHE is recorded for a 30 wt% ZrO2/α-Fe2O3 photoanode, which is ca. an order of magnitude higher than the IPCE from a film of pristine hematite. In 2017 a zirconia–hematite NT was reported to display an IPCE of 25.7% at 370 nm.34 An AACVD-fabricated 30 wt% ZrO2/α-Fe2O3 film-based photoanode here, however, provides evidence for an IPCE performance ca. 2.25 times higher than this.
C. Property characterization
The potentials were calculated by Nernst's equation:18
| ERHE = EAg/AgCl + 0.059 pH + EAg/AgCl | (4) |
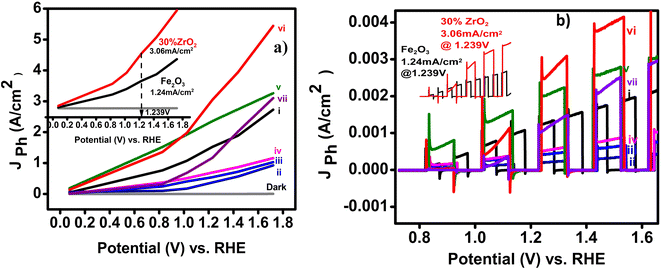
The characteristic J–V curves for all the zirconia/hematite compositions are shown in Fig. 7(a). Table S4† collates the photocurrent densities and onset potentials for all the zirconia/hematite thin films (0–40 wt% ZrO2).
With respect to the onset potentials, generally, a dark current starts at about 1.7 V vs. RHE for all of the electrodes in 0.1 M NaOH electrolyte. Under illumination, the lowest onset potential is exhibited by 30 wt% zirconia/hematite (i.e., 0.73 V) lower than pristine (0.86 V). After onset, the photocurrent increased rapidly with the applied potential for all film compositions.
The photocurrent behavior of the materials was also studied under chopped light conditions Fig. 7(b) again by comparing the photocurrent–voltage (J–V) curves in darkness and under simulated solar illumination (AM 1.5 G; 100 mW cm2; 25 °C).18 The steady-state J–V plot was superimposed on the transient plot in each case for comparison and both sets of J–V plots were found to be in good agreement for all the electrodes.
By way of a benchmark, LSV experiments showed that pristine α-Fe2O3 exhibited a photo-current density of 1.24 mA cm−2 at 1.23 V. While 30% ZrO2/α-Fe2O3 electrode yielded the best photocurrent reported to date for an AACVD-produced material in 0.1 M NaOH, producing 3.06 mA cm−2 at 1.239 V vs. RHE at the summit of the spike in Fig. 7(b), which falls to 2.6 mA cm−2 at 1.24 V before gradually rising to 3.1 mA cm−2 at 1.33 V vs. RHE. The film exhibits a minimum onset potential of 0.731 V vs. Ag/AgCl. The maximum photocurrent observed for the 30 wt% ZrO2/α-Fe2O3 film can be interpreted in terms of its large active surface area and hence the large effective semiconductor/electrolyte interface; a high surface area would be associated with enhanced charge transfer at the electrode–electrolyte interface. Recently in 2021 pristine hematite thin film prepared by hydrothermal method found to produce a photocurrent density of 0.07 mA cm−2.35 Keeping in view the comparison, in 2011 a photocurrent density of 2.1 mA cm−2 had been demonstrated by a 2% Zr-doped hematite photoanode, while more recently in 2017 Zr-doped α-Fe2O3 photoanodes were reported to yield photocurrent densities of 1.87 mA cm−2 (at 1.23 V vs. RHE), and 2 mA cm−2, respectively.15,34
The separation of the photogenerated carriers within the width of the space charge layer is likely to become a key factor for higher photocurrent, which seems to be more pronounced in the case of the 30 wt% ZrO2/α-Fe2O3 electrode. The increase in photocurrent density for different % compositions of ZrO2/α-Fe2O3, as shown in Fig. 7, can also be attributed to the high crystallinity of the films as confirmed by the XRD analysis. It is interesting to note that the electrode containing the lowest concentration of ZrO2 (i.e. 2 wt%) has the weakest PEC performance with recombination features in the photocurrent transient responses close to the photocurrent onset region, presumably due to its morphology.
The compact microstructure of the films that is created by treatment at 525 °C provides distinct advantages in that it contains intimate clusters of zirconia and α-Fe2O3 which together provide a superior electrode/electrolyte interface, allowing rapid charge transfer. Such nanostructures offer considerably reduced diffusion lengths for the photogenerated holes to reach the electrolyte interface, thereby suppressing electron–hole recombination. These features contribute to the increase in the rate of PEC water splitting by holes despite a typical hole diffusion length of the order of 2–4 nm. Further work is needed to control the particle size of the zirconia/hematite micro/nanostructures. If the dimensions of the oxide clusters could be tuned to the same order of magnitude as the hole-diffusion lengths, then one would expect the considerably enhanced PEC performance further. One of the limiting aspects of the fabricated electrodes is absence of the study of long terms stability however, this does not question their reported performance. This aspect along with some other will be dealt in future works.
D. Electrochemical impedance spectroscopy (EIS) study
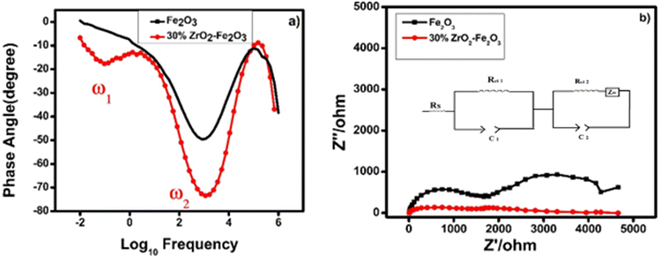 | ||
| Fig. 8 (a) Bode plot and (b) Nyquist plot taken from EIS data for thin films of pure hematite (black) and 30 wt% zirconia/hematite (red). Inset shows the equivalent circuit. | ||
In Fig. 8(a), the peak at lower frequency represents the charge transfer at the electrode–electrolyte interface, i.e., the trapping of the photogenerated charges in the bulk of photoanode while the higher frequency peak is associated with the photoanode surface states. In a simplified model, a photoanode surface has two competing processes that determine the rate of water oxidation, namely charge transfer and surface recombination. The role of the zirconia in the photoanodes is to maintain a high electrical conductivity and to reduce the recombination of charges, resulting in an enhancement of the photocurrent.
The electron lifetimes in the pristine hematite and 30 wt% zirconia/hematite materials were calculated using (5) from the respective frequencies in the Bode plots, where ω1 is the low frequency minimum (Table S5†).
The lower frequency feature, which appears in the 30 wt% zirconia/hematite sample, corresponds to a remarkable electron lifetime, which originates from the zirconia photoanodes. A lower ω indicates a lower resistance associated with charge transfer processes that occur at the photoanode.
 | (5) |
The above results show that the electron lifetime for the 30 wt% ZrO2/α-Fe2O3 is many times longer than pristine hematite and this phenomenon is reflected in the high photocurrent density measured for the photoanode. Recently in 2020 the electron lifetime calculated for 1/32 zirconia-hematite photoanode was 19 ns (ref. 36) and in other work in 2019 titania it was measured as 1.32 ms.37 The exceptional photoelectrochemical performance of the 30 wt% ZrO2/α-Fe2O3 electrode encouraged us to determine its ability to generate hydrogen (and oxygen) quantitatively. Fig. 8(b) shows the corresponding Nyquist plots for the pristine hematite and ZrO2 added Fe2O3 films clearly indicating the substantial decrease in the charge transfer resistance of both the processes and complementing the conclusions drawn from the Bode plot data. In the figure the inset shows equivalent circuit diagram where Rs corresponds to series resistance, Rct1 and Rct2 are the charge transfer resistances for electrode surface and the electrode–electrolyte interface, respectively. C1 and C2 are the corresponding capacitance elements indicating constant phase element behavior with depressed semicircles. The ZW is the Warburg element depicting the mass transfer through diffusion process typically associated with the charge transfer process in solutions.
E. Evolution measurements
Gas evolution experiments Fig. 9, showed that hydrogen was produced spontaneously by both a pristine hematite photoanode and a 30 wt% ZrO2/α-Fe2O3 photoanode over a 6 h duration. In Fig. 9(a), the 30 wt% zirconia/hematite photoelectrode generated 0.734 μmol cm−2 of hydrogen over this 6 h period. Despite a lower initial yield of hydrogen within the first 2 h, the 30 wt% ZrO2/α-Fe2O3 proceeded to outperform the pristine hematite film for the remainder of the test cycle Fig. 9(a).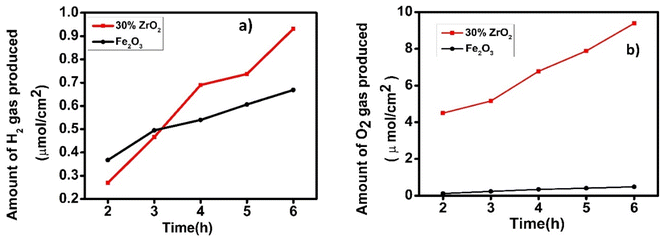 | ||
| Fig. 9 Plot of evolved (a) hydrogen and (b) oxygen as a function of time over 6 h, using an optimized hematite electrode in aqueous 0.1 M NaOH. | ||
As emphasized in Fig. 9(a), the 30 wt% ZrO2/α-Fe2O3 electrode generated a significant amount of oxygen over the test cycle with a remarkable increase in the amount of O2 produced as compared to that generated by a pristine hematite photoanode as shown in Fig. 9(b). As quantified in Table S6,† the data reveal that the oxygen produced by the 30 wt% ZrO2/α-Fe2O3 anode is 9-fold higher than the hematite equivalent while the corresponding hydrogen generation is 2.55 times greater. The much-improved gas evolution capability of the 30 wt% ZrO2/α-Fe2O3 photoanode compared to hematite itself and notably the impressive volume of hydrogen it can produce, correlates with the large increases in photocurrent density witnessed in the J–V curves. However, not only the additional electrons are generated by the 30 wt% ZrO2/α-Fe2O3 sample but also, the use of these electrons to generate hydrogen clearly shows a relatively efficient process for the composite anode. Though very little work has been reported on the Zr or ZrO2 added/modified Fe2O3 photoanodes nevertheless, it is interesting to compare the hydrogen generation capability of the 30 wt% ZrO2/α-Fe2O3 with other known such photoanodes. One of the earliest Zr-based electrodes could generate 2 ml of hydrogen gas in 1 h.15 More recently in 2021, a 7 nm Zr–Fe2O3 photoanode exhibited 1.23 mA cm−2 photocurrent density at 1.23 V vs. RHE while 115 and 165 μmol of O2 and H2 evolution achieved over optimized photoanode after 10 h of illumination.38 In another work where the acid treated nanocoral Zr–Fe2O3 photoanode exhibited 1.83 mA cm−2 current density at 1.23 V vs. RHE.39 Most recently, Koh et al.40 further improved their work on Zr–Fe2O3 photoanode by surface defect passivation using Al and Si doping and achieved remarkable surface charge transfer, however, the photocurrent density remained about ∼1.90 mA cm−2 at 1.23 V vs. RHE. The current material gave estimated solar to hydrogen (STH) efficiency, 3.76% which is far better than the earlier referred works reporting Zr–Fe2O3 photoanodes. A recent comprehensive report41 discusses several other materials used as photoanodes having varied STH efficiencies. In view of the findings in this work it can be suggested with confidence that the material possesses the potential to be pursed further while tailoring it to tune higher STH productions.
IV. Conclusions
Highly efficient and stable composite photoanodes were fabricated following the direct combination of α-Fe2O3 and ZrO2 precursors and synthesis of films by AACVD. The addition of ZrO2 in the hematite strongly affected the microstructure of the films and thus in a way the surface states of the electrodes. The photocurrent produced is about 3.06 mA cm−2 at 1.23 V vs. RHE much higher as compared to pristine hematite photocurrent density (1.23 mA cm−2). The addition of ZrO2 to hematite increased the photocurrent remarkably and this increase was ascribed to the improved electrical properties of the charge carriers. The increase in band gap with the addition of zirconia is maximum for 30% zirconia and the IPCE is also significantly higher than the pristine hematite at same wavelength. This impressive, enhanced performance could be attributed to the blocking layer formation by the zirconia–hematite composite.Author contributions
Saima Qureshi: data curation, formal analysis, investigation; methodology, writing – original draft, funding acquisition. Duncan H. Gregory: resources, supervision, writing – review & editing. Asif Ali Tahir: resources, supervision, writing – review & editing. Safeer Ahmed: conceptualization, resources, visualization, funding acquisition, writing – review & editing and supervision.Conflicts of interest
The authors declare that they have no conflict of interest.Acknowledgements
We are very grateful to the Higher Education Commission (HEC) of Pakistan for financial support through a 6 month scholarship to S. Qureshi to visit the University of Glasgow under the International Research Support Initiative Program (IRSIP; No. 1-8/HEC/HD/2017/8222). Thanks to Prof. Dr Naseem Iqbal, USPCASE, NUST University Islamabad for the AFM analysis.References
- A. G. Tamirat, W. N. Su, A. A. Dubale, H. M. Chen and B. J. Hwang, J. Mater. Chem. A, 2015, 3, 5949–5961 RSC.
- K. M. Young and T. W. Hamann, Chem. Commun., 2014, 50, 8727–8730 RSC.
- K. Sivula, F. Le Formal and M. Grätzel, ChemSusChem, 2011, 4, 432–449 CrossRef CAS PubMed.
- D. K. Bora, A. Braun and E. C. Constable, Energy Environ. Sci., 2013, 6, 407–425 RSC.
- L. Wang, C. Y. Lee, R. Kirchgeorg, H. Hildebrand, J. Müller, E. Spiecker and P. Schmuki, Mater. Horiz., 2014, 1, 344–347 RSC.
- Y. Qiu, S. F. Leung, Q. Zhang, B. Hua, Q. Lin, Z. Wei and Z. Fan, Nano Lett., 2014, 14, 2123–2129 CrossRef CAS PubMed.
- H. Dotan, K. Sivula, M. Gratzel, A. Rothschild and S. C. Warren, Energy Environ. Sci., 2011, 4, 958–964 RSC.
- F. F. Abdi, L. Han, A. H. M. Smets, M. Zeman, B. Dam and R. van de Krol, Nat. Commun., 2013, 4, 1–7 Search PubMed.
- T. W. Kim and K. S. Choi, Science, 2014, 343, 990–994 CrossRef CAS PubMed.
- F. E. Osterloh, Chem. Soc. Rev., 2013, 42, 2294–2320 RSC.
- M. J. Katz, S. C. Riha, N. C. Jeong, A. B. Martinson, O. K. Farha and J. T. Hupp, Coord. Chem. Rev., 2012, 256, 2521–2529 CrossRef CAS.
- K. Maeda, J. Photochem. Photobiol., C, 2011, 12, 237–268 CrossRef CAS.
- S. Y. Tee, K. Y. Win, W. S. Teo, L. D. Koh, S. Liu, C. P. Teng and M. Y. Han, Adv. Sci., 2017, 4, 1600337 CrossRef PubMed.
- G. Wang, Y. Ling, D. A. Wheeler, K. E. George, K. Horsley, C. Heske and Y. Li, Nano Lett., 2011, 11, 3503–3509 CrossRef CAS PubMed.
- P. Kumar, P. Sharma, R. Shrivastav, S. Dass and V. R. Satsangi, Int. J. Hydrogen Energy, 2011, 36, 2777–2784 CrossRef CAS.
- S. Shen, P. Guo, D. A. Wheeler, J. Jiang, S. A. Lindley, C. X. Kronawitter and S. S. Mao, Nanoscale, 2013, 5, 9867–9874 RSC.
- P. Liao, M. C. Toroker and E. A. Carter, Nano Lett., 2011, 11, 1775–1781 CrossRef CAS PubMed.
- A. A. Tahir, M. A. Teridi and K. U. Wijyantha, Phys. Status Solidi RRL, 2014, 8, 976–981 CrossRef CAS.
- A. Mao, J. K. Kim, K. Shin, D. H. Wang, P. J. Yoo, G. Y. Han and J. H. Park, J. Power Sources, 2012, 210, 32–37 CrossRef CAS.
- X. Su, C. Yu and C. Qiang, Appl. Surf. Sci., 2011, 257, 9014–9018 CrossRef CAS.
- T. M. Arantes, G. P. Mambrini, D. G. Stroppa, E. R. Leite, E. Longo, A. J. Ramirez and E. R. Camargo, J. Nanopart. Res., 2010, 12, 3105–3110 CrossRef CAS.
- J. A. Morales-Morales, Cienc. Desarrollo, 2017, 8, 99–107 CrossRef.
- S. H. Shim and T. S. Duffy, Am. Mineral., 2002, 87, 318–326 CrossRef CAS.
- A. Adjimi, M. L. Zeggar, N. Attaf and M. S. Aida, J. Cryst. Process Technol., 2018, 8, 89 CAS.
- D. L. A. de Faria, S. V. Silva and M. T. de Oliveira, J. Raman Spectrosc., 1997, 28, 873–878 CrossRef CAS.
- O. Mangla and S. Roy, Proceedings, 2019, 3, 10 Search PubMed.
- L. Shi, K. C. Tin and N. B. Wong, J. Mater. Sci., 1999, 34, 3367–3374 CrossRef CAS.
- R. Singaravelan and S. B. S. Alwar, Appl. Nanosci., 2015, 5, 983–991 CrossRef CAS.
- C. Zhu, C. Li, M. Zheng and J. J. Delaunay, ACS Appl. Mater. Interfaces, 2015, 7, 22355–22363 CrossRef CAS PubMed.
- D. Ciuparu, A. Ensuque, G. Shafeev and F. Bozon-Verduraz, ACS Appl. Mater. Interfaces, 2000, 7, 22355–22363 Search PubMed.
- A. W. Amer, M. A. El-Sayed and N. K. Allam, ACS Appl. Mater. Interfaces, 2016, 7, 22355–22363 Search PubMed.
- S. N. Basahel, T. T. Ali, M. Mokhtar and K. Narasimharao, Nanoscale Res. Lett., 2015, 10, 1–13 CrossRef CAS PubMed.
- J. Gong and S. Krishnan, Nanoscale Res. Lett., 2019, 10, 1–13 CAS.
- C. Li, A. Li, Z. Luo, J. Zhang and J. Gong, Angew. Chem., 2017, 129, 4214–4219 CrossRef.
- H. R. Devi, B. C. Ong, X. Zhao, Z. Dong, K. K. Nanda and Z. Chen, Energy Technol., 2022, 10, 2100457 CrossRef CAS.
- K. Jeong, M. A. Mahadik, S. Kim, H. M. Pathan, W. S. Chae, H. S. Chung and J. S. Jang, J. Chem. Eng., 2020, 390, 124504 CrossRef.
- K. S. Pawar, P. K. Baviskar, A. B. Nadaf, S. Salunke-Gawali and H. M. Pathan, Mater. Renew. Sustain. Energy, 2019, 8, 1–9 CrossRef.
- H. Ma, J. B. Hwang, W. S. Chae, H. S. Chung, S. H. Choi, M. A. Mahadik and J. S. Jang, Appl. Surf. Sci., 2021, 549, 149233 CrossRef CAS.
- J. B. Hwang, S. Kim, W. S. Chae, H. M. Pathan, M. A. Mahadik and J. S. Jang, Korean J. Chem. Eng., 2021, 38, 1149–1160 CrossRef CAS.
- T. S. Koh, P. Anushkkaran, M. A. Mahadik, W. S. Chae, H. H. Lee, S. H. Choi and J. S. Jang, Appl. Surf. Sci., 2024, 642, 158615 CrossRef.
- H. Song, S. Luo, H. Huang, B. Deng and J. Ye, ACS Energy Lett., 2022, 7, 1043–1065 CrossRef CAS.
Footnote |
| † Electronic supplementary information (ESI) available. See DOI: https://doi.org/10.1039/d3ra05348b |
| This journal is © The Royal Society of Chemistry 2023 |

