 Open Access Article
Interpretation of dielectric behavior and polaron hopping in lead-free antimony-based double perovskite
Mohamed Ben Bechir *a and
Faisal Alresheedib
aLaboratory of Spectroscopic and Optical Characterization of Materials (LaSCOM), Faculty of Science, University of Sfax, BP1171, 3000 Sfax, Tunisia. E-mail: mohamedbenbechir@hotmail.com
bDepartment of Physics, College of Science, Qassim University, Buraidah 51452, Saudi Arabia
First published on 28th November 2023
Abstract
Lately, double perovskite materials have become well-known in the commercialization area owing to their potential use in optoelectronic applications. Here, double perovskite Cs2AgSbCl6 single crystals (SCs) with cubic crystal structure and Fm![[3 with combining macron]](https://www.rsc.org/images/entities/char_0033_0304.gif) m space group were successfully synthesized via the slow cooling technique. This paper investigates the dielectric relaxation and charge transfer mechanism within Cs2AgSbCl6 using electrochemical impedance spectroscopy (EIS) in the 273–393 K temperature range under light. The dielectric response in Cs2AgSbCl6 has been explained by the space charge polarization and the ionic motion. The ε′(ω) study at different temperatures shows a remarkable frequency transition at which dε′/dT changes from a positive to a negative coefficient. Based on Stevels approach, the density of traps diminishes with the temperature increase, which improved conduction. However, this approach proves the polaronic conduction in Cs2AgSbCl6. 0.42 and 0.21 eV are the binding (Ep) and polaron hopping (WH) energy values, respectively. Contrary to free-charge carrier motion, polaron hopping was proposed as the principal conduction process since the ambient-temperature thermal energy was lower than Ep. Moreover, the analysis of M′′(ω) and −Z′′(ω) as a function of temperature shows the thermally-activated relaxation from the non-Debye to Debye type model in Cs2AgSbCl6. This scientific research offers an essential understanding of the dielectric relaxation behavior, which is required for improving dielectric switches. Also, this paper provides a deep insight into the conduction mechanism within double perovskite materials.
m space group were successfully synthesized via the slow cooling technique. This paper investigates the dielectric relaxation and charge transfer mechanism within Cs2AgSbCl6 using electrochemical impedance spectroscopy (EIS) in the 273–393 K temperature range under light. The dielectric response in Cs2AgSbCl6 has been explained by the space charge polarization and the ionic motion. The ε′(ω) study at different temperatures shows a remarkable frequency transition at which dε′/dT changes from a positive to a negative coefficient. Based on Stevels approach, the density of traps diminishes with the temperature increase, which improved conduction. However, this approach proves the polaronic conduction in Cs2AgSbCl6. 0.42 and 0.21 eV are the binding (Ep) and polaron hopping (WH) energy values, respectively. Contrary to free-charge carrier motion, polaron hopping was proposed as the principal conduction process since the ambient-temperature thermal energy was lower than Ep. Moreover, the analysis of M′′(ω) and −Z′′(ω) as a function of temperature shows the thermally-activated relaxation from the non-Debye to Debye type model in Cs2AgSbCl6. This scientific research offers an essential understanding of the dielectric relaxation behavior, which is required for improving dielectric switches. Also, this paper provides a deep insight into the conduction mechanism within double perovskite materials.
1. Introduction
Recently, lead (Pb)-based halide perovskites, which have shown power conversion efficiencies above 25.5%, have drawn researchers' attention as potential materials in place of silicon solar cells.1–3 These semiconducting materials, which can be prepared through inexpensive precursors, show interesting optoelectronic proprieties as high absorption coefficients, tunable band gap, and excellent charge carrier mobility marked by a good lifetime.4–6 However, despite all these performances, researchers are looking for alternatives to lead (Pb)-based halide perovskites due to their chemical instabilities and lead toxicity.7In this context, a promising approach is the heterovalent replacement of the lead (Pb) position in the crystal structure by a pair of monovalent and trivalent metal ions, forming the well-known metal-halide lead-free halide double perovskites with A2MM′X6 (A = Rb+, Cs+, etc.; M = Ag+, K+, Li+; M′ = Sb3+, In3+ or Bi3+ and X= I−, Br− or Cl−).8 In the context of ferroelectrics, the double perovskite materials have analyzed for the first time in the 1970s.9 Until now, a large number of double perovskite compounds, which have good octahedral and Goldschmidt tolerance factors, have been predicted to be chemically stable.10,11 Thus, the thermodynamic stability with the structural and functional variety noted in this family, shows that the metal-halide lead-free halide double perovskites are promised candidates for optoelectronic applications.11–13 The Cs2AgMX6 compound, with M representing Bi, Sb, or In, exhibits a highly encouraging structure for lead-free halide perovskites due to the interconnection of metal halide octahedra throughout a three-dimensional framework.14 This extensive three-dimensional interconnection possibly underlies the notable performance in photovoltaic devices crafted from these substances. Notably, these devices have demonstrated remarkably high power conversion efficiencies, surpassing those reported for other lead-free halide materials, despite having band gaps of an indirect nature.15,16 In recent studies, numerous scientific teams have presented methods for creating nanocrystals of Cs2AgBiX6 (X referring to Br or Cl).17–20 Discrepancies have emerged in the observed optical spectra when comparing nanocrystal data to measurements obtained from bulk materials. Notably, observations of a distinct peak at 430 nm in Cs2AgBiBr6 have raised questions, hinting at the possibility of substantial quantum confinement within these specific systems. Earlier investigations suggested that the discrepancies observed could be attributed to differences in measurement techniques (specifically, transmission versus reflection) and variations in sample concentration rather than stemming from the inherent optical response.18,21 Further reinforcement for this hypothesis was obtained through the examination of thin film transmission in single-crystalline Cs2AgBiBr6,22 demonstrating remarkably similar optical characteristics to the nanocrystal solutions.
Despite the A2MSbX6 compounds presenting the advantage of lower bandgap since they have a reduced conduction band minimum, these compounds are the less studied double perovskites.12,13 However, the synthesis of Cs2AgSbCl6 perovskite was carried out using a limited number of different techniques. Recently a scientific team effectively produced polycrystalline Cs2AgSb1−xInxCl6 samples by utilizing solid-state methods. This involved combining specific amounts of CsCl, AgCl, and SbCl3 (or InCl3) in evacuated quartz ampules, followed by heating the mixture to 400 °C.23 Subsequently, a separate group of researchers prepared Cs2AgSbCl6 microcrystals using the hydrothermal technique within a stainless-steel Parr autoclave. The resultant crystals displayed a tetradecahedral crystallization pattern, forming a truncated octahedral structure.24 Lately, the hot injection method was employed to create colloidal nanocrystals (NCs) of Cs2AgSb1−xBixCl6 alloys, as detailed in the recent study.25 This process yielded NCs exhibiting a cubic morphology. Nevertheless, detailed studies on dielectric relaxation and conduction mechanism within the A2MSbX6 double perovskites are not yet noticed. Thus, for better enhancement of these double perovskites in dielectric and optoelectronic applications, a comprehensive understanding of the fundamental physical processes in A2MSbX6 is needed.
In this work, the elaboration, as well as structural and optical studies of Cs2AgSbCl6, are represented. This paper offers a comprehensive knowledge of dielectric relaxation and conduction mechanisms in Cs2AgSbCl6. EIS is a powerful technique for investigating dielectric characteristics. This work contains a detailed frequency and temperature-dependent study of dielectric relaxation within Cs2AgSbCl6. It was found that the dielectric constant falls at a transition frequency, which increases with the temperature. Stevels model proves that polaron hopping is the principal conduction mechanism in Cs2AgSbCl6, and indicates the decreasing of confined charge density when the temperature increases and then conduction improves. The combined modulus and impedance analyses show the thermally-activated relaxation from the non-Debye to Debye type model in Cs2AgSbCl6.
Our paper, which gives thorough comprehension and new ideas about polaron hopping and dielectric relaxation within Cs2AgSbCl6 can be valuable to different lead-free halide double perovskite materials.
2. Methods
2.1 Materials
Cesium chloride (Sigma-Aldrich, ≥98.0%), silver chloride (Sigma-Aldrich, 99.99%), and antimony(III) chloride (Sigma-Aldrich, ≥99.95%) were used as obtained without further purification. HCl was prepared from Synth, 37% wt in water.2.2 Synthesis
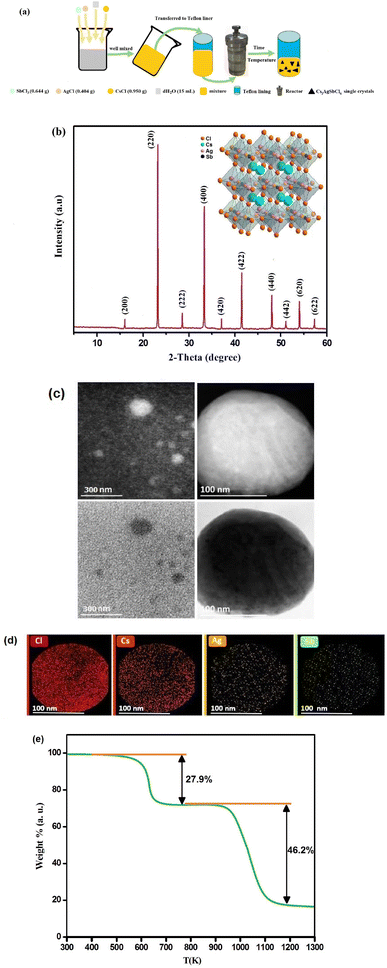
Black pyramid-like Cs2AgSbCl6 SCs were synthesized by the solvothermal procedure (Fig. 1a), which is ensured by the slow cooling method. The precursor CsCl (0.95097 g, 0.0056485 mol), AgCl (0.40477 g, 0.0028242 mol), and SbCl3 (0.64426 g, 0.0028242 mol) salts were dissolved in distilled water according to the following equation:| 2CsCl + AgCl + SbCl3 → Cs2AgSbCl6 |
The solution obtained was meticulously transferred into a 15 mL Teflon-lined SS autoclave and then placed in an oven set at 150 °C. Next, the precursor solution was cooled from 150 °C to room temperature at a rate of 0.25 °C h−1 instead of the natural cooling method. Later achieving ambient temperature, the precursor solution was left for some days (at room temperature). In the end, the Cs2AgSbCl6 SCs were later grown by slow solvent evaporation. Based on previous work on Cs2CuSbCl6 SCs,26 this method of synthesis can lead to Cs2AgSbCl6 nanoparticles.
2.3 Characterizations
The powder X-ray diffraction (PXRD) analysis was performed at room temperature by the Rigaku MiniFlex 600 benchtop diffractometer using Cu(Kα) line radiation (λ = 1.54 Å).HAADF-STEM pictures and Energy Dispersive X-ray Spectroscopy (EDS) data were collected with a Cs-corrected JEOL JEM-2100 F microscope set to 200 kV. A JEOL Silicon Drift Detector (DrySD60GV) with a sensor size of 60 mm2 was used for EDS mapping, spanning an estimated solid angle of 0.5 steradians.
The thermogravimetric (TG) study was performed on a PerkinElmer Pyris 6 in the temperature range of 300–1300 K with a heating rate of 5 °C min−1.
The diffuse reflectance spectrum was registered at room temperature via a PerkinElmer Lambda 950 UV-Vis spectrophotometer.
At room temperature, the photoluminescence (PL) spectra were obtained using a HORIBA LabRAM (HR800) apparatus equipped with a 325 nm laser. The TRPL (Time-Resolved Photoluminescence) analysis was conducted using a Time-Correlated Single Photon Counting (TCSPC) system (Horiba Jobin Yvon Inc). The TCSPC measurements were performed utilizing a pulsed-laser source operating at a wavelength of 325 nm, with a repetition rate of 100 kHz, fluence approximately at 4 nJ cm−2, and a pulse width of 70 ps. In this study, Cs2AgSbCl6 SCs were excited using a 325 nm wavelength via a xenon lamp source under room temperature. The Ludox suspension was employed as the instrument's response function to deconvolute the spectral values.
Raman measurements were taken with the Horiba LabRAM HR Evolution Raman Spectrometer to investigate the Cs2AgSbCl6 SCs.
To evaluate the complex impedance, a small portion of Cs2AgSbCl6 SCs underwent mechanical grinding in an agate mortar with a pestle to produce fine powders. A pellet of Cs2AgSbCl6, measuring 0.92 mm in thickness and with a relative density of 95.17%, was prepared at room temperature by subjecting it to a 50 Torr pressure using an 8 mm diameter hydraulic press. The pellet obtained was positioned between a pair of copper electrodes, with a layer of silver paint applied to ensure effective electrical contact between the sample and the electrodes. The impedance measurements under light and at different temperatures (273–393 K) were done using the Zahner electrochemical workstation in the frequency range of 10–106 Hz.
Ultrafast transient absorption (TA) observations were performed using the Helios pump-probe ultrafast spectroscopy equipment. This cutting-edge setup comprised a laser oscillator (Coherent Micra) functioning on Ti: sapphire principles, an amplifier (Coherent Legend), and an optical parametric amplifier (OPA) (TOPAS) furnished with a crystal of Barium Borate (BBO). Transient absorption (TA) measurements on an ultrafast timescale were executed using this arrangement. An amplified laser pulse is produced by the amplifier, displaying a Gaussian profile and lasting around 35 fs. This pulse is centered at 700 nm and holds an average power of 3.5 W, operating at a frequency of 1 kHz. The divided amplified laser beam undergoes bifurcation, with 70% being steered towards the optical parametric amplifier (OPA), and the residual 30% being routed towards the spectrometer. To facilitate a time delay, a delay stage encompassing a span from 0 to 8 ns is incorporated. This temporal offset allows the allocated 30% portion of the beam to function as the probe beam for purposes of spectroscopic examination. The process of generating a white-light continuum (WLC) for the probe beam, spanning from 375 nm to 750 nm, involves guiding the bifurcated beam through a sapphire plate. Extracting a pump beam at around 350 nm wavelength was achieved by tapping into the exceptionally consistent output of the optical parametric amplifier (OPA). This particular pump beam carried a fluence measuring 0.5 mW. With meticulous attention, both the pump and probe beams were precisely concentrated onto the sample to guarantee impeccable spatial congruity. The manipulation of data and its subsequent fitting were accomplished through the utilization of the surface Xplorer software. To establish the spectral resolution, an in-house calibrated ocean optics spectrometer was employed alongside the ZnTPP dye for calibration purposes.
3. Results and discussion
The room temperature PXRD pattern of Cs2AgSbCl6 is presented in Fig. 1b. With the Celeref 3 software's help,27 it was found that Cs2AgSbCl6 crystallizes at room temperature in the cubic symmetry with Fm![[3 with combining macron]](https://www.rsc.org/images/entities/char_0033_0304.gif) m space group and lattice parameters a = b = c = 10.3954 Å. This result is in good accord with the literature.28 The crystal structure of Cs2AgSbCl6, which is shown in the inset of Fig. 1b, contains corner-shared [AgCl6]5− and [SbCl6]3− octahedra arranged alternately periodically. All the cesium atoms (Cs) are positioned in the cubic octahedral cavity, thus constituting a double perovskite structure.28
m space group and lattice parameters a = b = c = 10.3954 Å. This result is in good accord with the literature.28 The crystal structure of Cs2AgSbCl6, which is shown in the inset of Fig. 1b, contains corner-shared [AgCl6]5− and [SbCl6]3− octahedra arranged alternately periodically. All the cesium atoms (Cs) are positioned in the cubic octahedral cavity, thus constituting a double perovskite structure.28
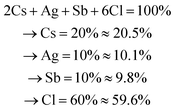
Morphological attributes and particle shape of Cs2AgSbCl6 SCs were scrutinized through the utilization of transmission electron microscopy (TEM) imaging. An illustrative depiction of the sample is presented in Fig. 1c. The assessment divulged that a significant proportion of particles displayed a diminutive spherical configuration. In particular, the exploration of an individual spherical particle measuring around 200 nm in size is depicted in Fig. 1c. To verify the existence of chemical constituents within the synthesized Cs2AgSbCl6, a STEM-EDS analysis was carried out, as depicted in Fig. 1d. The analysis through EDS mapping unveiled the presence of cesium (Cs), silver (Ag), antimony (Sb), and chloride (Cl). This outcome serves as evidence that no elements underwent depletion throughout the entirety of the synthesis process. From these findings, it is implied that the prepared Cs2AgSbCl6 is of complete purity, as detailed in Table 1. The chemical elements existing within Cs2AgSbCl6 can be theoretically computed as follows:
 | (1) |
| Chemical element | % atomic |
|---|---|
| Caesium (Cs) | 20.5 |
| Silver (Ag) | 10.1 |
| Antimony (Sb) | 9.8 |
| Chloride (Cl) | 59.6 |
The TG study of the Cs2AgSbCl6 compound is presented in Fig. 1e. The decomposition of the prepared perovskite appears in two steps around 600 and 987 K.
The absorption spectrum of Cs2AgSbCl6 from 250 to 450 nm at room temperature is shown in Fig. 2a. A Tauc study on the absorption spectrum of Cs2AgSbCl6 powder (inset of Fig. 2) suggests an indirect bandgap (Eg) of 2.52 eV, which is in accord with the literature.11
The PL spectrum displays a peak situated at 396 nm, as illustrated in Fig. 2b. This aligns harmoniously with earlier investigations.29,30 Furthermore, an assessment of time-resolved photoluminescence (TRPL) was carried out on Cs2AgSbCl6 SC at room temperature, as shown in Fig. 2c. The outcomes unveiled an appreciably protracted carrier lifetime of 8.21 ns, surpassing the value of 6.57 ns found previously.31 This elongated carrier lifetime stands as a testament to the enhanced excellence and diminished imperfections in the Cs2AgSbCl6 SC.
The Raman spectra of the Cs2AgSbCl6 SC at room temperature is shown in Fig. 2d. The literature has been used to provide a full attribution.32–34 The vibrational patterns within Cs2AgSbCl6 SC predominantly manifest in the lower-wavenumber domain, extending up to 310 cm−1. This phenomenon arises from the inclusion of substantial elements such as Ag and Sb within their composition. While the octahedral structures of [SbCl6]5− and [AgCl6]5− exhibit impeccable Oh symmetry, variations in the bond lengths of Ag–Cl and Sb–Cl contribute to distinct sizes of their respective octahedra. Due to the slightly greater Ag–Cl bond lengths in comparison to the Sb–Cl bond lengths, the [SbCl6]5− octahedron exhibits a more robust bond.7 Consequently, it is foreseeable that the vibrational reaction within these SCs will be predominantly influenced by the [SbCl6]5− octahedron in contrast to the [AgCl6]5− octahedron. The lower-frequency resonance at 73 cm−1 corresponds to the translational mode, with the 122 cm−1 registering as an overtone of this mode. Meanwhile, the higher-frequency resonances at 209 cm−1 and 294 cm−1 can be attributed to the Eg (stretching asymmetric) and A1g (stretching symmetric) modes of the octahedron, respectively. The allocations to these diverse modes are additionally validated by adhering to the subsequent overarching relationship:
 | (2) |
Examination of Table 2 showcases a satisfactory alignment between the acquired experimental frequencies and the documented outcomes from DFT analysis.
| Vibrational modes | Raman (cm−1) | |
|---|---|---|
| Our experimental study | Other DFT analysis19–21 | |
| F(1)2g | 73 | 43.5, 54.4, 28.6 |
| F(2)2g | 122 | 110.3, 116.8, 123.4 |
| E(1)g | 209 | 220.2, 194.8, 195.8 |
| A(1)1g | 294 | 290.4, 300.6, 310.6 |
The impedance analysis has been carried out under illumination in the 273–393 K temperature range to understand the conduction mechanism and dielectric relaxation behavior within Cs2AgSbCl6. Fig. 3a shows the Z′(ω) plots in different temperatures. It is noted that, at low frequencies, the resistance (Z′) reduces when both temperature and frequency increase, which suggests the NTCR (negative temperature coefficient of the resistance) comportment in Cs2AgSbCl6.35 This increasing conductance with the temperature can explained by the augmentation of charge carrier mobility besides the decrease in confined charge density within Cs2AgSbCl6.36 As shown in the inset of Fig. 3a, below a particular frequency we note a negative coefficient (NC) for dZ′/dT, which becomes a positive coefficient (PC) above this particular frequency. Fig. 3b presents the −Z′′(ω) curves in various temperatures, it is noted that −Z′′ decreases when the frequency increases until to a particular frequency, and afterward −Z′′ rises with the frequency. Above this particular frequency, we note the presence of an asymmetric crest, which shows the relaxation behavior within Cs2AgSbCl6. The improvement of the capacitance is shown by the decrease of −Z′′ magnitude when the temperature increases.37 Fig. 4a shows the thermal variation of the peak frequency, which increases with the temperature. This behavior confirms that the relaxation process is thermally activated within Cs2AgSbCl6.38 The thermal variation of the relaxation time τ (τ = 1/ωmax) is shown in Fig. 4a, the order of τ (microseconds) indicates the creation of space charges within Cs2AgSbCl6. Based on the literature, the presence of space charges is related to the redistribution of charge carriers within the crystal structure possesses a relaxation time of around microseconds.38 Fig. 4a shows that τ decreases as temperature increases. This comportment indicates that the charge carriers' delocalization is thermally activated within Cs2AgSbCl6. For high temperatures, this increase in delocalization proposes the passage from non-Debye to Debye-type relaxation.39
 | (3) |
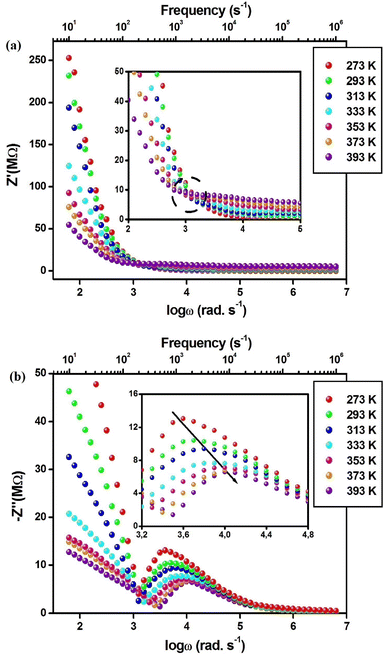 | ||
| Fig. 3 (a) Real part of impedance (Z′) vs. frequency at different temperatures. (b) Imaginary of impedance (−Z′′) vs. frequency at different temperatures. | ||
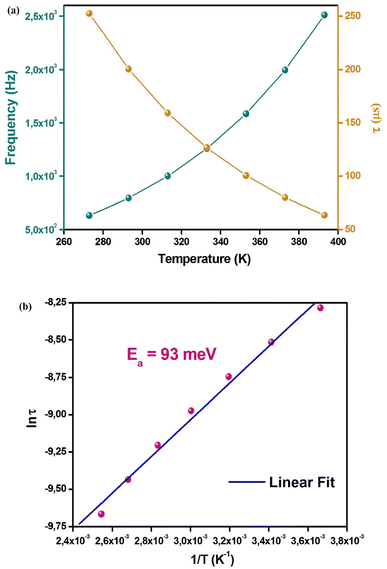 | ||
| Fig. 4 (a) Temperature dependence of the maximum frequency of −Z′′(ω) and the relaxation time (τ). (b) Arrhenius plot. | ||
The fit of the curve (Fig. 4b) was used to calculate the activation energy, which was equal to 93 meV. This typical value of Ea shows the charge carriers' motion within Cs2AgSbCl6. Moreover, this can be assigned to the activation of the polarons motion process with a progressive decrease in electron-lattice coupling.
In order to study the dielectric properties within Cs2AgSbCl6, eqn (4)–(6) have been used to calculate the frequency-dependent complex dielectric permittivity.
| ε(ω) = ε′(ω) + jε′′(ω) | (4) |
 | (5) |
 | (6) |
| tan(δ) = ε′(ω)/ε′′(ω) | (7) |
Fig. 5a shows the ε′(ω) plots at different temperatures, it is noted that in low frequencies, the dielectric constant takes on high values, which can be related to their intrinsic polar character. The entities [AgCl6]5− and [SbCl6]3− present a polar character since the electronegativity variation between Ag/Sb and Cl (Cl–Ag = 1.23, Cl–Sb = 1.11), the dynamic disorder, which is created by the electronegativity variation among both entities and the bending Cl–Sb–Cl and Cl–Ag–Cl liaisons, fractures the inversion symmetry causing thus the polarization of the Cs2AgSbCl6 lattice. Fig. 5a shows that the dielectric constant decreases as the frequency increases until a particular frequency, then ε′ rises with frequency before reaching a constant value at 104 Hz. Fig. 5b shows that the transition frequency increases with the temperature. The off-centering character of the Ag and Sb cations can influence the ionic movements within the [AgCl6]5− and [SbCl6]3− entities, this operation can explain the transition frequency origin. The thermal behavior of the transition frequency can be interpreted by the lattice expansion within Cs2AgSbCl6, since the Ag–Cl, and Sb–Cl distance vary. According to the literature, this off-centering behavior can lead to a ferroelectric nature, but there is no proof of the ferroelectric character within Cs2AgSbCl6.39 The arrows presented in Fig. 5a show a large PC for dε′/dT under the transition frequency and then becomes a small NC above this frequency. This transition from PC to NC was noted in some perovskite materials such as Cs0.06FA 0.79MA0.15Pb(I0.85Br0.15)3 and CH3NH3PbI3 at 150 and 103 Hz, respectively.40,41 According to the literature, the variation in dε′/dT behavior can be related to the photo-induced lattice distortion, which causes entropy increment and temperature-dependent variation in the dipole dispersion.39 Fig. 5c shows the thermal variation of ε′ at particular frequencies, it is noted the disappearance of relaxation after the frequency 104 Hz. This suggests that in the high-frequency region the polar variation becomes lower, and the unrelaxed dielectric constant value shows the electronic and atomic polarization. The dielectric constant behavior can be related to the ionic polarization under the transition frequency. The ionic polarization in Cs2AgSbCl6, which their primitive unit cell contains different ions 6 Cl−, 2 Cs+, Sb3+, and Ag+, occurs due to the separation of cations (Cs+) and anions ([AgCl6]5− and [SbCl6]3−) centers. This type of polarization relates to the deformational element of polarizability. The thermal variation in Sb–Cl, and Ag–Cl chemical bonds will provoke increased ionic polarization when the temperature increases and a large PC for dε′/dT appears. The dipolar polarization can explain the dielectric constant behavior after the transition frequency. In illumination, the polarization can be explained by the electrostatic potential gradients, which are created by the inhomogeneous charged distribution. The improved haphazard thermal movement, which drives an important variation from the perfect dielectric alignment, is the reason for increasing dipolar polarization with the temperature. Nevertheless, dε′/dT presents low NC since the deviation is slight with the temperature increase. Fig. 5d shows the ε′′(ω) plots at different temperatures, it is noted that, at low frequencies, the dielectric loss increases with the temperature. This behavior can be interpreted by the Stevels approach, which proposed that the relaxation procedure appears owing to the vibrational, dipole, and conduction losses.42,43
As reported by the Stevels model, ε′′ is shown as:
| ε′′ = Aωm, (m < 0) | (8) |
 | (9) |
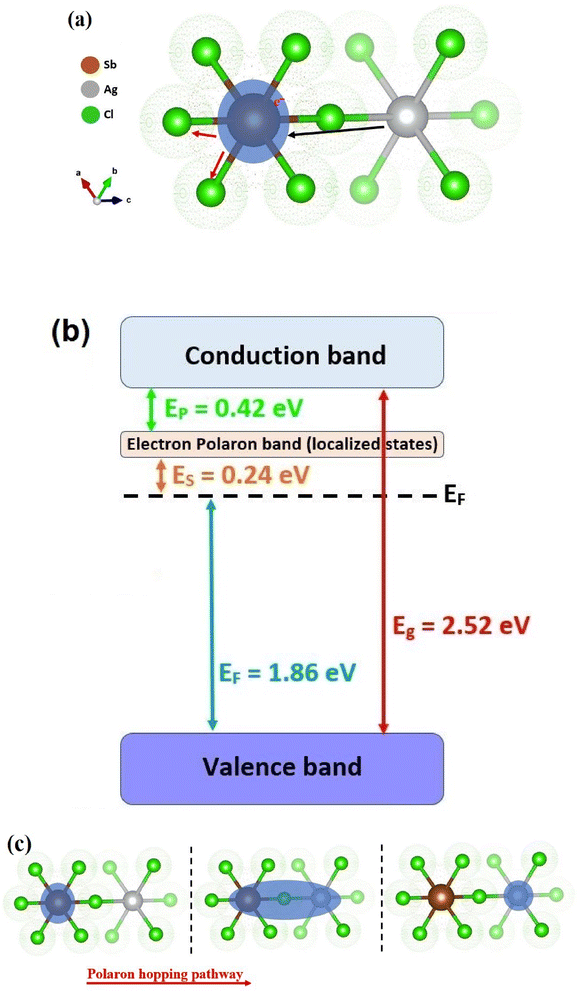
The parameter m values, which are calculated from the adjusted ε′′(ω) plots (Table 3), increase with the temperature. Consequently, Wmax decreases with increasing temperature, which facilitates the motion of charge carriers. The conductivity improvement with the temperature is related to the reduction of the trap's contribution. Moreover, this approach might be applied to the polaron creation since the thermal variation of the parameter m proves the polaron motion in the prepared compound. Herein, the maximum barrier height between the two trap states (Wmax) would be indicated as the polaron hopping energy (WH).39 Under the light, the deformation of the Cs2AgSbCl6 lattice occurs owing to its polar character as we explained lately. A polaron can be a “small polaron” or a “large polaron”, this depends on the polaron radius compared to the lattice constant. Within the perovskite Cs2AgSbCl6, a short-term occurs via distortion potential and small polarons type, since the structural isolation among the entities [AgCl6]5− and [SbCl6]3− causes zero-dimensionality (electronic). Within the unit cell, small polarons' motion happens through thermally excited hopping. Fig. 6a shows the polaron creation within the Cs2AgSbCl6 lattice unit under the light. Usually, the conduction activation energy (Eσ) in semiconductors materials is shown as follows:39
| Eσ = WH + ES | (10) |
| Temperature | Value of ‘m’ |
|---|---|
| 273 | −0.65 |
| 293 | −0.69 |
| 313 | −0.73 |
| 333 | −0.78 |
| 353 | −0.82 |
| 373 | −0.87 |
| 393 | −0.91 |
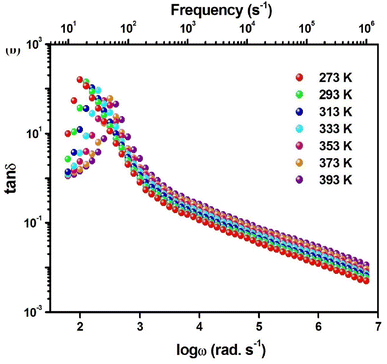
In this work, it was proposed polaronic conduction within Cs2AgSbCl6 so the ES, which generally presented the semiconductors band gap, describes the transition between Ef (Fermi energy) and Ep (polaronic localized state). According to the literature, the Cs2AgMCl6 (M = In, Bi, and Sb) compounds are assumed to be n-type semiconductors,12,44 and the Fermi level of Cs2AgSbCl6 situated above 1.86 eV from the valence band.12 The value of WH, which was determined from eqn (7), is equal to 0.21 eV. Therefore, the value of Ep is 0.42 eV, since Ep = 2WH.39,45 Fig. 6b shows the graphic representation of the energy bands within Cs2AgMCl6. Contrary to free charge carrier motion, polaron hopping is proposed as the suitable conduction mechanism within Cs2AgMCl6, since the room temperature thermal energy is lower than Ep energy. The calculated values of ES and the appropriate activation energy for conduction can equal 0.24 and 0.43 eV, respectively. The polaron hopping motion from one entity to another one is shown in Fig. 6c. The motion of polarons improves under the temperature effect, and polarons shift different unit cells with the temperature rise.39 Fig. 7 shows the tan![[thin space (1/6-em)]](https://www.rsc.org/images/entities/char_2009.gif) δ(ω) plots at different temperatures, it is noted that the loss factor increase with frequency until the transition frequency, and after it the loss factor decrease with the frequency rise. As temperature increases, the shift of the loss tangent's transition frequency towards higher frequencies parallels the observed trend in ε′ (Fig. 5b). The d(tan
δ(ω) plots at different temperatures, it is noted that the loss factor increase with frequency until the transition frequency, and after it the loss factor decrease with the frequency rise. As temperature increases, the shift of the loss tangent's transition frequency towards higher frequencies parallels the observed trend in ε′ (Fig. 5b). The d(tan![[thin space (1/6-em)]](https://www.rsc.org/images/entities/char_2009.gif) δ)/dT variation from NC to PC at the transition frequency can be interpreted the same as given for the dielectric loss. Nevertheless, besides the dielectric relaxation, a prospective study will be necessary to clarify this transition and to get an understanding of electric field relaxation.
δ)/dT variation from NC to PC at the transition frequency can be interpreted the same as given for the dielectric loss. Nevertheless, besides the dielectric relaxation, a prospective study will be necessary to clarify this transition and to get an understanding of electric field relaxation.
The electric modulus is shown as follows:46
 | (11) |
Fig. 8a shows the M′(ω) plots at different temperatures. Under the transition frequency, M′ gets a petite value (about zero), and after it M′ increases with frequency until reaches an almost constant value after 104 Hz. Below the transition frequency (low frequencies), the comportment of M′(ω) can be explained mainly by the negligence of the electrode polarization.47–50 Above the transition frequency, the increase of M′ can be interpreted by the polarons hopping.47–50 It is noted that M′(ω) plots move to a high frequency with the temperature increasing. This behavior shows the temperature impact on the polaron delocalization.46–49 Fig. 8b shows the M′′(ω) plots at different temperatures, it is noted the presence of a peak at every temperature. This confirms the existence of electric field relaxation within Cs2AgSbCl6. The asymmetrical nature of M′′(ω) plots show the non-Debye behavior within Cs2AgSbCl6.35,37 Nevertheless, this asymmetrical nature shifts to symmetric with the temperature increasing. This behavior proposes a transition in the relaxation process from the non-Debye to the Debye type.39 Fig. 8b shows that the relaxation peak, which presents the transition from long-range to short-range mobility of polarons, shifts to a high frequency with the temperature increasing. This comportment confirms the thermally-activated relaxation process and the long-range mobility amelioration of polarons, which verifies the relaxation passage from the non-Debye to Debye type.51–53 Confined polarons can cross the potential barrier with the help of the energy resulting from the increase in temperature. Fig. 9a, which shows the modulus Nyquist curves at different temperatures, confirms this interpretation by the change of plots from a depressed semicircle to a less depressed semicircle with the rising temperature. Fig. 9b shows the determined relaxation time from M′′(ω) plots at different temperatures. It is noted that s decreases with increasing temperature, this confirms the thermally activated polaron delocalization within Cs2AgSbCl6.54,55 The fit of ln(τ) vs. 1/T (the inset of Fig. 9a) was used to calculate the activation energy, which was equal to 142 meV.
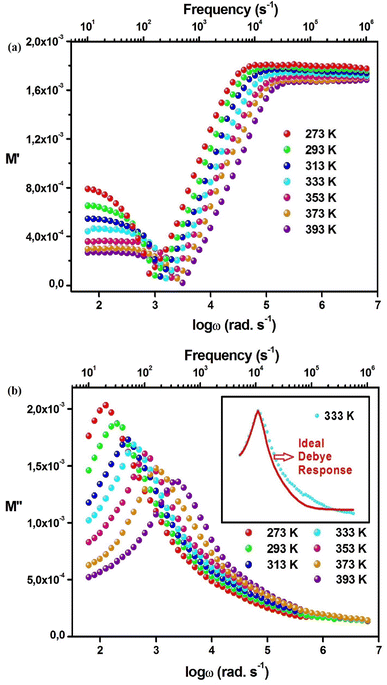 | ||
| Fig. 8 (a) Variation of M′(ω) at different temperatures. (b) Variation of M′′(ω) at different temperatures. | ||
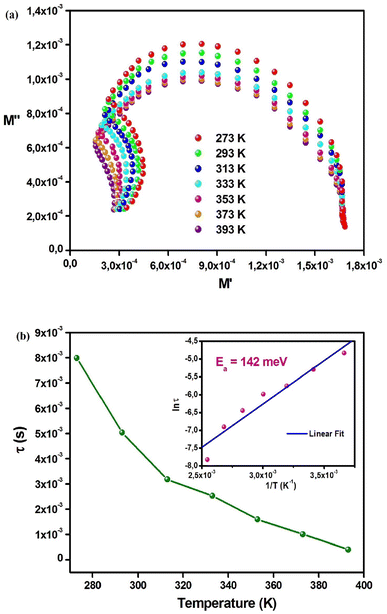 | ||
| Fig. 9 (a) Modulus Nyquist diagram at different temperatures. (b) Temperature dependence of the relaxation time (τ). The inset presents the Arrhenius plot. | ||
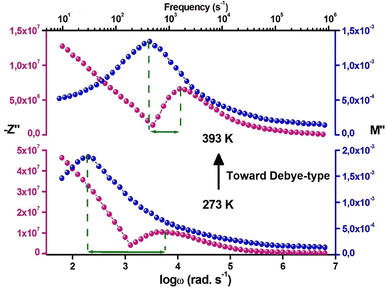
The charge carriers' motion as well as the relaxation type (non-Debye/localized or Debye/delocalized) can be determined by the association of M′′(ω) and −Z′′(ω) plots. The coincidence of impedance and modulus peaks ( and
and  ) at the same frequency proposes a long-range motion, otherwise, the conduction process explains by a short-range motion. Fig. 10 shows an important mismatching between
  and
and  peaks at 273 and 393 K. This shift proposed a short-range motion of polarons within Cs2AgSbCl6 and shows the deviation from the ideal Debye response. Fig. 10 shows that when the temperature increases the shift between the peaks decreases. Consequently, we deduce that the temperature increase results in the delocalized polarons relaxation (to Debye-type) within Cs2AgSbCl6.56,57
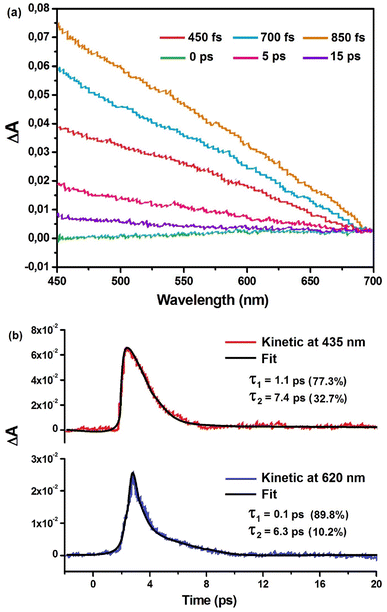
Furthermore, to substantiate the conduction mechanism and delineate the attributes of polarons, transient absorption spectroscopy was conducted through excitation at a 350 nm wavelength. The resultant spectral profile is displayed in Fig. 11a. Within the wavelength range of 450 to 700 nm, we detected a photoinduced absorption (PIA) band, signifying the establishment of self-trapped states (STS) situated below the band edge. This expansive PIA band is a customary observation during the creation of STS, as reported in previous studies.26 The magnitude of the PIA signal registers enhancement up to 850 fs, succeeded by a rapid decline and reduction spanning around 15 ps. The complete progression of photoinduced absorption (PIA) kinetics within the scope of probe wavelengths unfolds within approximately 400–650 fs. The absence of a discernible potential barrier separating free excitons and carriers within self-trapped states (STSs) is evidenced by the swift emergence of PIA kinetics.
A biexponential decay model was used to investigate the kinetics found at 435 nm, which corresponds to the absorbance band edge of the Cs2AgSbCl6 crystal. As shown in Fig. 11b, the results show that the decay may be explained by two separate time constants: τ1 (1.1 ps, accounting for 77.3% of the decay) and τ2 (7.4 ps, accounting for 32.7% of the decay). A similar research was also conducted in the 450–650 nm region, with an emphasis on kinetics at 620 nm. As shown in Fig. 10b, this set of kinetics may be described by time constants τ1 = 0.1 ps and τ2 = 6.3 ps. The rapid component τ1 (1.1 ps) discovered in the kinetics at 435 nm can be attributed to carrier relaxation by interaction with longitudinal optical (LO) phonons, known as Fröhlich polarons.58,59 Fröhlich polarons develop within lead-halide perovskites, and their creation period is generally approximately 0.1 ps. Notably, this timescale is quite near to the fast time constant reported at 620 nm (τ1 = 0.1 ps). The resulting deformation of the pliable lattice containing the dimensions of the Fröhlich polaron causes various acoustic phonon modes to be activated. The interaction of electrons with acoustic phonons, together with the fast self-confinement of carriers caused by these acoustic phonons, supports the development of the secondary component seen at 435 and 620 nm. These events are anticipated to occur at τ2 = 7.4 ps and τ2 = 6.3 ps, respectively.
4. Conclusions
In sum, the dielectric and conduction process within Cs2AgSbCl6 have been studied through the EIS as a function of temperature. This work shows that the dielectric constant within Cs2AgSbCl6 falls at a transition frequency, which increases with the temperature. dε′/dT demonstrates a large PC under the transition frequency and then becomes a small NC above this frequency. Stevels approach, which proves the polaron hopping as a conduction mechanism within Cs2AgSbCl6, indicates the decreasing of confined charge density when the temperature increases and then conduction improves. The energy Ep, which is equal to 0.42 eV, is bigger than the ambient-temperature thermal energy, this proposes that the polaron hopping is the principal conduction process within Cs2AgSbCl6. Moreover, the increase in temperature causes the delocalized polarons relaxation (to Debye-type) in Cs2AgSbCl6. The transient absorption kinetics findings point to the implication of small polarons in the capture of carriers within their domains. Once elevated to an excited state, carriers proceed through a relaxation sequence, binding with LO phonons to shape Fröhlich polarons. Subsequently, diverse modes of acoustic phonons come into substantial interaction with charge carriers, culminating in the emergence of small polarons. These small polarons engender self-trapped conditions, effectively constraining charge carriers within a limited number of lattice units. This paper offers the fundamental process behind the dielectric and conduction behaviors within Cs2AgSbCl6.Conflicts of interest
There are no conflicts to declare.References
- C. Sun, J. A. Alonso and J. Bian, Adv. Energy Mater., 2020, 11(2), 2000459 CrossRef.
- C. Yu, JPhys Energy, 2019, 1, 022001 CrossRef CAS.
- M. Usman and Q. Yan, Crystals, 2020, 10(2), 62 CrossRef CAS.
- L. Chouhan, S. Ghimire, Ch. Subrahmanyam, T. Miyasaka and V. Biju, Chem. Soc. Rev., 2020, 49(10), 2869–2885 RSC.
- L. Zhang, Y. Fang, L. Sui, J. Yan, K. Wang, K. Yuan, W. L. Mao and B. Zou, ACS Energy Lett., 2019, 4(12), 2975–2982 CrossRef CAS.
- C. Sun, J. A. Alonso and J. Bian, Adv. Energy Mater., 2020, 11(2), 2000459 CrossRef.
- E. F. S. Rodrigues, C. A. Escanhoela, B. Fragoso, G. Sombrio, M. M. Ferrer, M. C. Álvarez-Galván, M. T. Fernández-Díaz, J. A. Souza, F. F. Ferreira, C. Pecharromán and J. A. Alonso, Ind. Eng. Chem. Res., 2021, 60(51), 18918–18928 CrossRef.
- A. S. Kshirsagar and A. Nag, J. Chem. Phys., 2019, 151(16), 161101 CrossRef PubMed.
- L. R. Morss, M. P. Siegal, L. Stenger and N. M. Edelstein, Inorg. Chem., 1970, 9(7), 1771–1775 CrossRef CAS.
- W. Huang, H. Peng, Q. Wei, J. Xia, X. He, K. Bao, Y. Tian and B. S. Zou, Adv. Opt. Mater., 2023, 11(10), 2203103 CrossRef CAS.
- J. Dahl, W. T. Osowiecki, Y. Cai, J. K. Swabeck, Y. Bekenstein, M. Asta, E. M. Chan and A. P. Alivisatos, Chem. Mater., 2019, 31(9), 3134–3143 CrossRef CAS.
- J. Dahl, W. T. Osowiecki, Y. Cai, J. K. Swabeck, Y. Bekenstein, M. Asta, E. M. Chan and A. P. Alivisatos, Chem. Mater., 2019, 31, 3134–3143 CrossRef CAS.
- A. S. Kshirsagar and A. Nag, J. Chem. Phys., 2019, 151(16), 161101 CrossRef PubMed.
- A. H. Slavney, T. Hu, A. M. Lindenberg and H. I. Karunadasa, J. Am. Chem. Soc., 2016, 138, 2138–2141 CrossRef CAS PubMed.
- K. M. McCall, C. C. Stoumpos, S. S. Kostina, M. G. Kanatzidis and B. W. Wessels, Chem. Mater., 2017, 29(9), 4129–4145 CrossRef CAS.
- J. Pal, S. Manna, A. Mondal, S. Das, K. V. Adarsh and A. Nag, Angew. Chem., Int. Ed., 2017, 56, 14187–14191 CrossRef CAS PubMed.
- S. E. Creutz, E. N. Crites, M. C. De Siena and D. R. Gamelin, Nano Lett., 2018, 18, 1118–1123 CrossRef CAS PubMed.
- Y. Bekenstein, J. Dahl, J. Huang, W. T. Osowiecki, J. K. Swabeck, E. M. Chan, P. Yang and A. P. Alivisatos, Nano Lett., 2018, 18, 3502–3508 CrossRef CAS PubMed.
- H. Lei, D. Hardy and F. Gao, Adv. Funct. Mater., 2021, 31, 2105898 CrossRef CAS.
- L. Zhou, Y. Xu, B. Chen, D. Kuang and C. Su, Small, 2018, 14(11), 1703762 CrossRef PubMed.
- J. Dahl, W. T. Osowiecki, Y. Cai, J. K. Swabeck, Y. Bekenstein, M. Asta, E. M. Chan and A. P. Alivisatos, Chem. Mater., 2019, 31, 3134–3143 CrossRef CAS.
- B. A. Connor, L. Leppert, M. D. Smith, J. B. Neaton and H. I. Karunadasa, J. Am. Chem. Soc., 2018, 140, 5235–5240 CrossRef CAS PubMed.
- T. T. Tran, J. R. Panella, J. Chamorro, J. R. Morey and T. M. McQueen, Mater. Horiz., 2017, 4, 688–693 RSC.
- J. Zhou, X. Rong, M. S. Molokeev, X. Zhang and Z. Xia, J. Mater. Chem. A, 2018, 6, 2346–2352 RSC.
- A. S. Kshirsagar and A. Nag, J. Chem. Phys., 2019, 151(16), 161101 CrossRef PubMed.
- M. B. Bechir and S. Znaidia, Understanding the polaron behavior in CS2CUSBCL6 halide double perovskite, Phys. Chem. Chem. Phys., 2023, 25, 19684–19692 RSC.
- See http://mill2.chem.ucl.ac.uk/tutorial/lmgp/celref.htm.
- A. Singh, R. Chaurasiya, A. Bheemaraju, J. Chen and S. Satapathi, ACS Appl. Energy Mater., 2022, 5, 3926–3932 CrossRef CAS.
- C. Liu, H. Chen, P. Lin, H. Hu, Q. Meng, L. Xu, P. Wang, X. Wu and C. Cui, J. Mater. Sci.: Mater. Electron., 2022, 33, 24895–24905 CrossRef CAS.
- J. Peng, C. Q. Xia, Y. Xu, R. Li, L. Cui, J. K. Clegg, L. M. Herz, M. B. Johnston and Q. Lin, Nat. Commun., 2021, 12(1), 1531 CrossRef CAS PubMed.
- Y. Guo, Y. Lou, J. Chen and Y. Zhao, Chemsuschem, 2021, 15(3), e202102334 CrossRef PubMed.
- G. Volonakis, M. R. Filip, A. A. Haghighirad, N. Sakai, B. Wenger, H. J. Snaith and F. Giustino, J. Phys. Chem. Lett., 2016, 7, 1254–1259 CrossRef CAS PubMed.
- X. Yang, W. Wang, R. Ran, W. Zhou and Z. Shao, Energy Fuels, 2020, 34, 10513–10528 CrossRef CAS.
- A. Singh, R. Chaurasiya, A. Bheemaraju, J. Chen and S. Satapathi, ACS Appl. Energy Mater., 2022, 5, 3926–3932 CrossRef CAS.
- M. B. Bechir and M. H. Dhaou, RSC Adv., 2021, 11, 21767–21780 RSC.
- M. B. Bechir, A. Almeshal and M. H. Dhaou, Mater. Res. Bull., 2023, 157, 112012 CrossRef CAS.
- M. B. Bechir and M. H. Dhaou, Mater. Res. Bull., 2021, 144, 111473 CrossRef CAS.
- M. B. Bechir, A. Almeshal and M. H. Dhaou, Ionics, 2022, 28, 5361–5376 CrossRef CAS.
- N. K. Tailor, N. Parikh, P. Yadav and S. Satapathi, J. Phys. Chem. C, 2022, 126, 10199–10208 CrossRef CAS.
- N. F. Hoque, M. Yang, Z. Li, N. Islam, X. Pan, K. Zhu and Z. Fan, ACS Energy Lett., 2016, 1, 142–149 CrossRef.
- M. Jahandar, N. Khan, M. Jahankhan, C. E. Song, H. K. Lee, S. K. Lee, W. S. Shin, M. K. Lee, S. H. Im and S. J. Moon, J. Ind. Eng. Chem., 2019, 80, 265–272 CrossRef CAS.
- N. K. Tailor and S. Satapathi, J. Phys. Chem. C, 2021, 125, 5243–5250 CrossRef CAS.
- P. Maji, A. Ray, P. Sadhukhan, S. Chatterjee and S. Das, J. Appl. Phys., 2018, 124(12), 124102 CrossRef.
- W. Deng, Z.-Y. Deng, J. He, M. Wang, Z. Chen, S. Wei and H. Feng, Appl. Phys. Lett., 2017, 111(15), 151602 CrossRef.
- J. Lago, P. D. Battle, M. J. Rosseinsky, A. I. Coldea and J. Singleton, J. Condens. Matter Phys., 2003, 15, 6817–6833 CrossRef CAS.
- M. B. Bechir, K. Karoui, M. Tabellout, K. Guidara and A. B. Rhaiem, Phase Transit., 2015, 91, 901–917 CrossRef.
- P. Sengupta and R. Ray, Mater. Lett., 2021, 302, 130456 CrossRef CAS.
- M. S. Sheikh, A. P. Sakhya, P. Sadhukhan, A. Dutta, S. Das and T. P. Sinha, Ferroelectrics, 2017, 514, 146–157 CrossRef CAS.
- M. Kumari and P. M. Sarun, J. Mater. Sci.: Mater. Electron., 2021, 33, 8607–8615 CrossRef.
- S. A. Fatima, R. Shaheen and K. Shahzad, Appl. Phys. A, 2021, 127(6), 466 CrossRef CAS.
- P. Pal and A. Ghosh, J. Appl. Phys., 2021, 129(23), 234102 CrossRef CAS.
- A. S. Priya, D. Geetha and I. B. S. Banu, Braz. J. Phys., 2021, 51, 1438–1447 CrossRef CAS.
- F. Ambrosio, D. Meggiolaro, E. Mosconi and F. De Angelis, ACS Energy Lett., 2019, 4, 2013–2020 CrossRef CAS.
- Z. Raddaoui, S. E. Kossi, R. Brahem, A. Bajahzar, A. V. Trukhanov, A. L. Kozlovskiy, M. V. Zdorovets, J. Dhahri and H. Belmabrouk, J. Mater. Sci.: Mater. Electron., 2021, 32, 16113–16125 CrossRef CAS.
- M. Selmi, B. Smida and S. E. Kossi, J. Mater. Sci.: Mater. Electron., 2021, 32, 6014–6027 CrossRef CAS.
- A. O. Çağırtekin, A. Ajjaq, Ö. Barin and S. Acar, Phys. Scr., 2021, 96, 115807 CrossRef.
- K. Yadagiri and R. Nithya, J. Phys. Chem. Solids, 2021, 158, 110232 CrossRef CAS.
- A. D. Wright, L. R. V. Buizza, K. J. Savill, G. Longo, H. J. Snaith, M. B. Johnston and L. M. Herz, J. Phys. Chem. Lett., 2021, 12, 3352–3360 CrossRef CAS PubMed.
- B. Wu, W. Ning, Q. Xu, M. Manjappa, M. Feng, S. Ye, J. Fu, S. Lie, T. Yin, F. Wang, T. W. Goh, P. C. Harikesh, Y. K. E. Tay, Z. Shen, F. Huang, R. Singh, G. Zhou, F. Gao and T. C. Sum, Sci. Adv., 2021, 7(8), eabd3160 CrossRef CAS PubMed.
| This journal is © The Royal Society of Chemistry 2023 |

