 Open Access Article
Creative Commons Attribution 3.0 Unported Licence
OER catalytic performance of a composite catalyst comprising multi-layer thin flake Co3O4 and PPy nanofibers†
Honglin Ai,
Liquan Fan *,
Yuwei Wang*,
Ziteng Wang,
Haiming Zhang,
Juan Zhao,
Meiye Jiao,
Boyu Lv and
Xianxin Han
College of Materials Science and Engineering, Heilongjiang Provincial Key Laboratory of Polymeric Composite Materials, Qiqihar University, No. 42, Wenhua Street, Qiqihar 161006, PR China. E-mail: Liquan_Fan@163.com; wyw032378@163.com
First published on 31st October 2023
Abstract
The oxygen evolution reaction (OER) plays a crucial role in energy conversion and storage processes, highlighting the significance of searching for efficient and stable OER catalysts. In this study, we have developed a composite catalyst, PPy@Co3O4, with outstanding catalytic performance for the OER. The catalyst was constructed by integrating multi-layer thin flake Co3O4 with attached PPy nanofibers, utilizing the rich active sites of Co3O4 and the flexibility and tunability of PPy nanofibers to optimize the catalyst structure. Through comprehensive characterization and performance evaluation, our results demonstrate that the PPy@Co3O4 (0.1![[thin space (1/6-em)]](https://www.rsc.org/images/entities/char_2009.gif) :
:![[thin space (1/6-em)]](https://www.rsc.org/images/entities/char_2009.gif) 1) catalyst exhibits remarkable OER catalytic activity and stability. This research provides new strategies and insights for the development of efficient and stable OER catalysts, holding promising prospects for energy conversion and storage applications in relevant fields.
1) catalyst exhibits remarkable OER catalytic activity and stability. This research provides new strategies and insights for the development of efficient and stable OER catalysts, holding promising prospects for energy conversion and storage applications in relevant fields.
Introduction
With the rapid development of the fossil fuel industry, such as natural gas, petroleum, and methane, the world is facing severe energy shortages and environmental pollution crises. To propel human society towards further advancement and address challenges of resource scarcity and environmental pollution, the exploration of renewable and recyclable clean energy has become a key research area in this century.1,2 Among them, electrocatalytic water splitting is widely regarded as a suitable alternative, primarily involving the oxygen evolution reaction (OER) and hydrogen evolution reaction (HER).3,4 Achieving outstanding OER activity requires metals to provide good electron conductivity, thereby enlarging the surface area of active centers for OER catalysis and protecting metals from oxidation through layered structures, resulting in superior OER performance.5,6 Currently, noble metal catalysts such as RuO2/IrO2 are widely employed in OER testing or used as reference materials for comparison due to their exceptional OER catalytic activity. However, their high cost and limited availability restrict further research and application. Therefore, there is an urgent need to develop cost-effective, highly stable, and electrochemically active electrocatalysts.7,8As a transition metal, metal cobalt and its oxide Co3O4 have attracted significant attention due to their excellent oxygen evolution reaction (OER) performance.9 Various catalysts with diverse structures and exposed crystal facets, such as particulate, spherical, bulk, bouquet-like, and network structures, can be obtained by employing different preparation methods, which profoundly influence the catalytic activity in different fields.10–12 However, despite certain progress being made, challenges still exist in current research, necessitating further exploration and optimization of the performance of Co3O4 catalysts to achieve more efficient and stable OER reactions.
To further enhance the OER catalytic performance of Co3O4, this study introduces a conductive polymer material, polypyrrole (PPy). As a commonly studied and utilized conducting polymer with alternating single-double bond conjugation, PPy possesses a C–N five-membered heterocyclic conjugated structure and finds extensive applications in electrochemical fields such as supercapacitors, oxygen reduction reactions (ORR), and oxygen evolution reactions (OER).13–15 The incorporation of PPy enhances the conductivity of the nanocomposite, effectively facilitating electron transfer in the OER process and thus improving the electrocatalytic performance of OER.16 In composite materials, the morphology of Co3O4 and its combination with PPy play a crucial role in their performance in the electrocatalysis field. For instance, a hierarchical Co3O4@PPy core–shell nanowire can be prepared by uniformly coating an amorphous PPy layer on the surface of Co3O4 nanowires via a simple hydrothermal method, and this composite material has been employed as an electrode material for supercapacitors.17,18 In this study, a hydrothermal method combined with the in situ polymerization technique using polyvinylpyrrolidone (PVP) as a soft template was employed to synthesize multi-layered flake-like Co3O4, followed by the preparation of PPy@Co3O4 composite material. The catalytic performance of PPy@Co3O4 composite material in the OER reaction was investigated, aiming to provide new insights and theoretical guidance for the development of efficient and stable electrocatalysts.
Experimental section
Materials
Cobalt(II) nitrate hexahydrate (Co(NO3)3·6H2O) was purchased from Xilong Chemical Co., Ltd. Pyrrole was obtained from Macklin Reagent Company. Ammonium persulfate was purchased from Tianjin Kaitong Chemical Reagent Co., Ltd. Urea ((NH2)2CO) and sodium dodecylbenzenesulfonate (SDBS) were obtained from Tianjin Kemiou Chemical Reagent Co., Ltd. Polyvinylpyrrolidone (PVP) was purchased from Tianjin Bodi Chemical Co., Ltd. All chemicals used were of analytical grade and did not require further purification. The ultrapure water used in this experiment had a resistivity of 18.2 MΩ cm.Preparation methods
Co(NO3)3·6H2O and (NH2)2CO were mixed in a molar ratio of 1![[thin space (1/6-em)]](https://www.rsc.org/images/entities/char_2009.gif) :
:![[thin space (1/6-em)]](https://www.rsc.org/images/entities/char_2009.gif) 5 in 70 mL of ultrapure water. While stirring, an appropriate amount of PVP was gradually added to the mixture solution and stirred overnight until complete dissolution and mixing. The solution was transferred to a 100 mL polytetrafluoroethylene hydrothermal reaction vessel and reacted at 120 °C for 6 h. After the reaction, the reaction vessel was cooled to room temperature, and the precipitate was centrifuged. The centrifuged sample was washed three times with alternating ultrapure water and anhydrous ethanol solution. The sample was then placed in a hot air oven and dried at 80 °C for 6 h. After drying, the sample was removed and placed in a high-temperature furnace. The temperature was raised to 400 °C at a heating rate of 5 °C min−1 in air and calcined for 4 hours, resulting in black Co3O4 powder.
5 in 70 mL of ultrapure water. While stirring, an appropriate amount of PVP was gradually added to the mixture solution and stirred overnight until complete dissolution and mixing. The solution was transferred to a 100 mL polytetrafluoroethylene hydrothermal reaction vessel and reacted at 120 °C for 6 h. After the reaction, the reaction vessel was cooled to room temperature, and the precipitate was centrifuged. The centrifuged sample was washed three times with alternating ultrapure water and anhydrous ethanol solution. The sample was then placed in a hot air oven and dried at 80 °C for 6 h. After drying, the sample was removed and placed in a high-temperature furnace. The temperature was raised to 400 °C at a heating rate of 5 °C min−1 in air and calcined for 4 hours, resulting in black Co3O4 powder.
Approximately 0.3 g of the prepared black Co3O4 powder was taken and added to 50 mL of ultrapure water. Then, 10 mg of SDBS was added, and the mixture was stirred overnight for 24 h. The solution was transferred to a water bath at 0–5 °C and stirred in an ice bath. Then, 30 mg of pyrrole monomer and 0.5 mL of 1 mol L−1 hydrochloric acid were added. After stirring for 1 hour, 2 mL of 0.1 mol L−1 ammonium persulfate ((NH4)2S2O8) was added dropwise. After stirring for 2 h, the mixture was centrifuged at low speed, and the resulting sample was washed three times with alternating ultrapure water and anhydrous ethanol. The sample was then placed in a hot air oven set at 70 °C and dried for 8 hours to obtain the PPy@Co3O4 composite with a mass ratio of 0.1![[thin space (1/6-em)]](https://www.rsc.org/images/entities/char_2009.gif) :
:![[thin space (1/6-em)]](https://www.rsc.org/images/entities/char_2009.gif) 1, denoted as PPy@Co3O4 (0.1
1, denoted as PPy@Co3O4 (0.1![[thin space (1/6-em)]](https://www.rsc.org/images/entities/char_2009.gif) :
:![[thin space (1/6-em)]](https://www.rsc.org/images/entities/char_2009.gif) 1). For comparison experiments, other PPy@Co3O4 composite materials with mass ratios of 0.02
1). For comparison experiments, other PPy@Co3O4 composite materials with mass ratios of 0.02![[thin space (1/6-em)]](https://www.rsc.org/images/entities/char_2009.gif) :
:![[thin space (1/6-em)]](https://www.rsc.org/images/entities/char_2009.gif) 1, 0.05
1, 0.05![[thin space (1/6-em)]](https://www.rsc.org/images/entities/char_2009.gif) :
:![[thin space (1/6-em)]](https://www.rsc.org/images/entities/char_2009.gif) 1, and 0.2
1, and 0.2![[thin space (1/6-em)]](https://www.rsc.org/images/entities/char_2009.gif) :
:![[thin space (1/6-em)]](https://www.rsc.org/images/entities/char_2009.gif) 1 were prepared by adjusting the amount of pyrrole monomer under the same conditions. These samples were denoted as PPy@Co3O4 (0.02
1 were prepared by adjusting the amount of pyrrole monomer under the same conditions. These samples were denoted as PPy@Co3O4 (0.02![[thin space (1/6-em)]](https://www.rsc.org/images/entities/char_2009.gif) :
:![[thin space (1/6-em)]](https://www.rsc.org/images/entities/char_2009.gif) 1), PPy@Co3O4 (0.05
1), PPy@Co3O4 (0.05![[thin space (1/6-em)]](https://www.rsc.org/images/entities/char_2009.gif) :
:![[thin space (1/6-em)]](https://www.rsc.org/images/entities/char_2009.gif) 1), and PPy@Co3O4 (0.2
1), and PPy@Co3O4 (0.2![[thin space (1/6-em)]](https://www.rsc.org/images/entities/char_2009.gif) :
:![[thin space (1/6-em)]](https://www.rsc.org/images/entities/char_2009.gif) 1), respectively. The preparation of pure PPy was conducted under the same conditions without the addition of Co3O4.
1), respectively. The preparation of pure PPy was conducted under the same conditions without the addition of Co3O4.
Characterization
To analyze the crystal structure and phase composition of the prepared samples, we employed the Smart Lab X-ray diffractometer (XRD) from Rigaku Corporation, Japan. The microscopic morphology of the materials was observed using the S-3400 scanning electron microscope (SEM) from Hitachi Ltd., Japan. Elemental scanning analysis was carried out with an energy dispersive X-ray spectroscope (EDS). Additionally, we utilized the H-7650 transmission electron microscope (TEM) from Hitachi Ltd. to observe the samples. For the observation of PPy in the PPy@Co3O4 composite, Fourier-transform infrared spectroscopy (FT-IR) analysis was performed using the Spec drum infrared spectrometer from PerkinElmer, USA. The chemical environment of elements in the PPy@Co3O4 composite was analyzed using the ESCALAB 250Xi X-ray photoelectron spectrometer (XPS) from Thermo Fisher Scientific, USA. The Brunauer–Emmett–Teller (BET) method was employed to determine the specific surface area using a Hitachi Regulus 8100 instrument. The Barrett–Joyner–Halenda (BJH) method was utilized to assess the pore size distribution.Electrochemical testing
Electrochemical performance testing was conducted using a Shanghai CHI 760E electrochemical workstation in a 0.1 M KOH electrolyte solution. A three-electrode system was employed, with a catalyst-modified glassy carbon electrode as the working electrode, an Ag/AgCl electrode as the reference electrode, and a platinum wire electrode as the counter electrode. Prior to each test, the glassy carbon electrode was carefully polished using aluminum oxide powder with particle sizes of 0.1, 0.3, and 0.05 mm, followed by rinsing with deionized water. Electrochemical impedance spectroscopy (EIS) measurements were performed over a frequency range of 0.1 to 106 Hz with an amplitude of 5 mV. The double-layer capacitance (Cdl) is estimated from the cyclic voltammetry (CV) curve. The electrochemical active surface area (ECSA) is calculated as Cdl/Cds, where Cs is 40 μF cm−2.A 5 wt% Nafion solution was diluted 10 times to obtain a 0.5 wt% solution, which was then subjected to 30 min of ultrasonication in a water bath. Subsequently, 15 mg of the catalyst sample was weighed and added to 5 mL of 0.5 wt% Nafion solution, followed by 1 h of ultrasonication in a water bath, resulting in a catalyst ink. Using a microsyringe, 10 μL of the ink was drop-cast onto a glassy carbon electrode with a diameter of 4 mm. The electrode was left undisturbed at room temperature for 1 hour to allow the formation of a film covering the electrode surface. The geometric surface area of the rotating disk electrode (RRDE) was calculated to be 0.1256 cm2. Linear sweep voltammetry (LSV) polarization curve measurements were performed using a rotating disk electrode (RRDE) at a rotation speed of 1600 rpm and a scan rate of 5 mV s−1. The potential of the reference electrode Ag/AgCl was converted to the reversible hydrogen electrode (RHE), and all obtained potential values were adjusted according to the established formula ERHE = EAg/AgCl + 0.059 pH + 0.198.19
Results and discussion
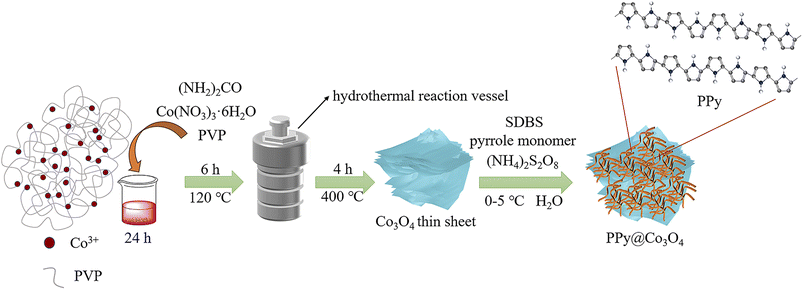
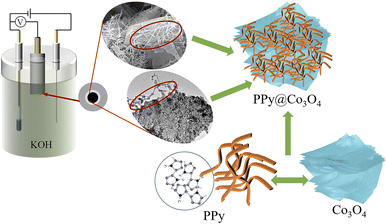
As shown in Fig. 1, the multilayered Co3O4 nanosheets were synthesized using a simple hydrothermal method. Polyvinylpyrrolidone (PVP) was used as a soft template, and Co(NO3)3·6H2O was employed as the cobalt source to synthesize Co(OH)2 intermediate via urea. Subsequently, the Co3O4 nanosheets were obtained through a short calcination process. The synthesis of Co3O4 nanosheets is chiefly accomplished through the hydrothermal approach. Crucially, the use of PVP as a soft template plays a pivotal role, guiding growth along specific crystallographic planes while simultaneously suppressing other orientations, ultimately resulting in the formation of sheet-like architectures. To load PPy onto the surface of Co3O4 nanosheets, an in situ polymerization method was employed. The specific steps were as follows: SDBS surfactant, pyrrole monomer, and oxidant (NH4)2S2O8 were added into the Co3O4 nanosheets, and the in situ polymerization reaction was carried out at a controlled temperature range of 0–5 ○C. This resulted in the formation of a fibrous network structure of PPy attached to the surface of Co3O4 nanosheets, forming the PPy@Co3O4 composite material. The addition of SDBS surfactant facilitated the formation of stable micelle structures on the surface of Co3O4, ensuring the uniform dispersion of PPy nanoparticles on the Co3O4 surface and promoting the interaction between PPy and Co3O4.Fig. 2 presents the XRD analysis of the prepared Co3O4, PPy, and PPy@Co3O4 catalyst samples with different mass ratios. The Co3O4 black powder exhibits distinct peaks at 18.9°, 31.3°, 36.8°, 44.8°, 55.6°, 59.3°, and 65.2°, which are in good agreement with the standard spectrum of Co3O4 (PDF#74-2120) and correspond to the (111), (220), (311), (400), (442), (511), and (440) crystal planes of Co3O4 product.14 This confirms the successful synthesis of the target product, Co3O4, through the hydrothermal decomposition of the precursor.4 Furthermore, the XRD patterns of the PPy@Co3O4 composite materials with different mass ratios also exhibit characteristic diffraction peaks of Co3O4, further confirming the presence of Co3O4 in the prepared catalyst samples.
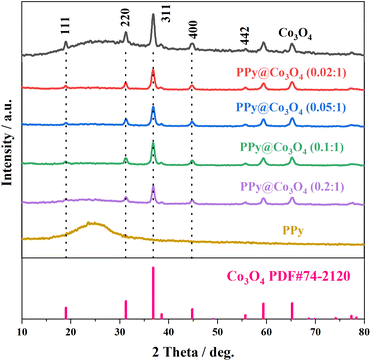 | ||
| Fig. 2 XRD patterns of the prepared Co3O4, PPy, and PPy@Co3O4 catalyst samples with different mass ratios. | ||
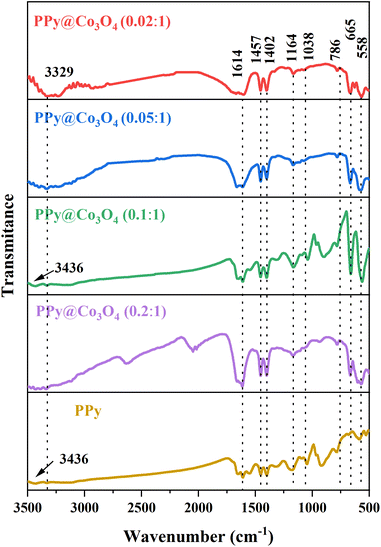
To demonstrate the structure and composition of the prepared PPy@Co3O4 catalyst material, Fourier-transform infrared spectroscopy (FT-IR) analysis was conducted. As shown in Fig. 3, the spectrum analysis revealed two characteristic peaks at 3436 cm−1 and 3329 cm−1, which are attributed to the N–H stretching vibrations of aromatic amines.20 The peak at 1164 cm−1 corresponds to the stretching vibration of C–N bonds, while the absorption peak at 1038 cm−1 is attributed to the C–H vibration mode in the pyrrole ring.21 The peak observed at 1614 cm−1 corresponds to the stretching vibration of C![[double bond, length as m-dash]](https://www.rsc.org/images/entities/char_e001.gif) C bonds, and the peak at 558 cm−1 is attributed to the C–H vibration.22 These spectral peaks further confirm the presence of PPy in the prepared composite catalyst material. Additionally, a peak at 665 cm−1 corresponding to the Co–O bond23 was observed, indicating the presence of Co3O4 in the prepared composite catalyst material. Based on the analysis of the FT-IR characteristic peaks and the previous XRD test results, we can conclude that the prepared catalyst material is a PPy@Co3O4 composite material.
C bonds, and the peak at 558 cm−1 is attributed to the C–H vibration.22 These spectral peaks further confirm the presence of PPy in the prepared composite catalyst material. Additionally, a peak at 665 cm−1 corresponding to the Co–O bond23 was observed, indicating the presence of Co3O4 in the prepared composite catalyst material. Based on the analysis of the FT-IR characteristic peaks and the previous XRD test results, we can conclude that the prepared catalyst material is a PPy@Co3O4 composite material.
Based on the results of the N2 adsorption–desorption isotherm and pore size distribution curve, we observed that within the relative pressure range of 0 to 1.0, the catalyst samples displayed typical characteristics of a Type IV isotherm. As clearly depicted in Fig. 4(a), the BET surface area of the Co3O4 sample was measured to be 21.58 m2 g−1, whereas that of the PPy@Co3O4 (0.1![[thin space (1/6-em)]](https://www.rsc.org/images/entities/char_2009.gif) :
:![[thin space (1/6-em)]](https://www.rsc.org/images/entities/char_2009.gif) 1) was notably higher at 41.83 m2 g−1. Fig. 4(b) provides a detailed representation of the pore size distribution of these samples: the average pore diameter of Co3O4 was approximately 13.26 nm, while that of PPy@Co3O4 (0.1
1) was notably higher at 41.83 m2 g−1. Fig. 4(b) provides a detailed representation of the pore size distribution of these samples: the average pore diameter of Co3O4 was approximately 13.26 nm, while that of PPy@Co3O4 (0.1![[thin space (1/6-em)]](https://www.rsc.org/images/entities/char_2009.gif) :
:![[thin space (1/6-em)]](https://www.rsc.org/images/entities/char_2009.gif) 1) was slightly larger, around 13.88 nm. Notably, both materials predominantly exhibit a mesoporous structure. In a comprehensive comparison, PPy@Co3O4 (0.1
1) was slightly larger, around 13.88 nm. Notably, both materials predominantly exhibit a mesoporous structure. In a comprehensive comparison, PPy@Co3O4 (0.1![[thin space (1/6-em)]](https://www.rsc.org/images/entities/char_2009.gif) :
:![[thin space (1/6-em)]](https://www.rsc.org/images/entities/char_2009.gif) 1) not only possesses a larger surface area but also a richer mesoporous structure, offering it numerous active sites, which are anticipated to significantly enhance its catalytic performance.24–26
1) not only possesses a larger surface area but also a richer mesoporous structure, offering it numerous active sites, which are anticipated to significantly enhance its catalytic performance.24–26
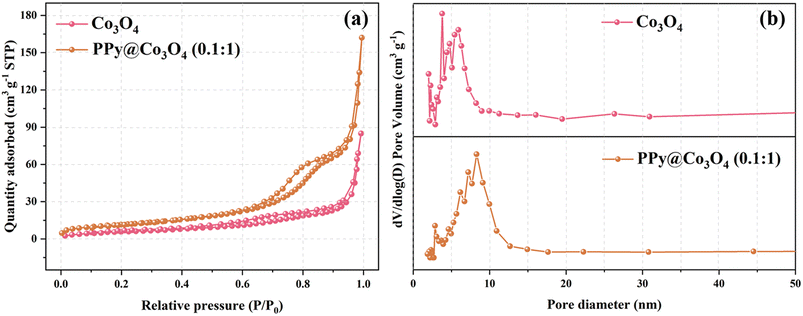 | ||
| Fig. 4 (a) N2 adsorption–desorption isotherms and (b) corresponding BJH pore size distribution curves for Co3O4 and PPy@Co3O4. | ||
Based on XPS analysis, we have confirmed the chemical states of the PPy@Co3O4 catalyst surface. In the spectrum shown in Fig. 5(a), the presence of Co, N, O, and C elements is observed. As shown in Fig. 5(b), the Co 2p spectrum can be fitted with two spin–orbit doublets and two satellites. Specifically, the binding energies at 779.5 and 794.6 eV can be attributed to Co3+, while the binding energies at 796.3 and 780.9 eV can be attributed to Co2+. The energy gap of approximately 15.5 eV between 796.3 eV and 779.5 eV is consistent with the characteristic of Co 2p 1/2 and Co 2p 3/2 orbitals in Co3O4,27,28 further indicating the coexistence of Co2+ and Co3+. Furthermore, the shift of peaks in the Co 2p region towards higher binding energy suggests strong interactions between Co3O4 and PPy, leading to electron transfer from PPy to Co3O4.29 In Fig. 5(c), further analysis of the main peak in the O 1s region reveals three peaks at 529.5, 530.0, and 531.2 eV. These peaks are associated with oxygen in Co3O4. Specifically, the peak at 529.5 eV is attributed to the presence of metal–oxygen bonds, the binding energy at 530.0 eV corresponds to the presence of OH−, and the binding energy at 531.2 eV corresponds to low-coordinated oxygen ions.30
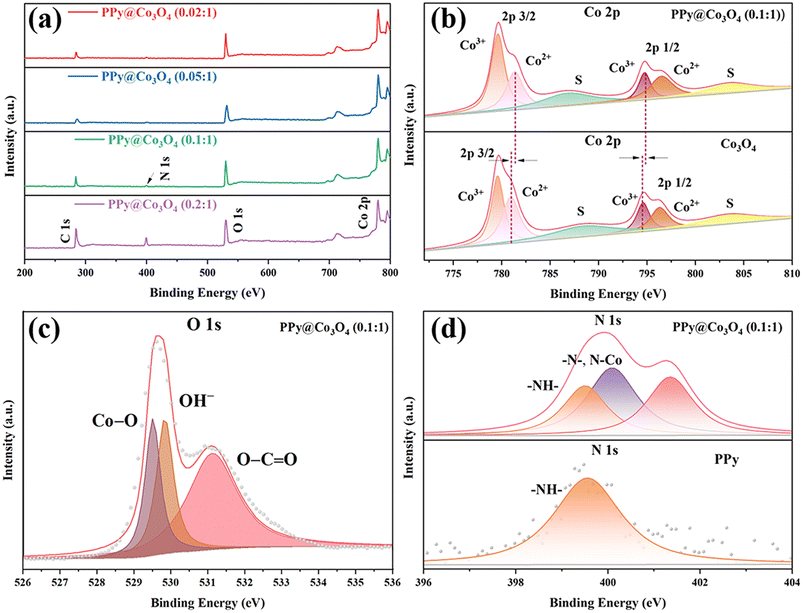 | ||
Fig. 5 (a) XPS survey spectrum of PPy@Co3O4 composites. High-resolution XPS spectra of (b) Co 2p, (c) O 1s, and (d) N 1s for PPy@Co3O4 (0.1![[thin space (1/6-em)]](https://www.rsc.org/images/entities/char_2009.gif) : :![[thin space (1/6-em)]](https://www.rsc.org/images/entities/char_2009.gif) 1). 1). | ||
In the N 1s spectrum of PPy@Co3O4 (0.1![[thin space (1/6-em)]](https://www.rsc.org/images/entities/char_2009.gif) :
:![[thin space (1/6-em)]](https://www.rsc.org/images/entities/char_2009.gif) 1) shown in Fig. 5(d) and S1(a),† the peak located at 399.2 eV matches with the N element in PPy, indicating a substantial presence of –NH– groups. The conjugated structure of PPy supports delocalized electrons, which exhibit electrostatic interactions with metal ions during the polymerization process.31 The peak at 400.6 eV corresponds to the C
1) shown in Fig. 5(d) and S1(a),† the peak located at 399.2 eV matches with the N element in PPy, indicating a substantial presence of –NH– groups. The conjugated structure of PPy supports delocalized electrons, which exhibit electrostatic interactions with metal ions during the polymerization process.31 The peak at 400.6 eV corresponds to the C![[double bond, length as m-dash]](https://www.rsc.org/images/entities/char_e001.gif) N bond in PPy4,32 and the peak at 399.8 eV provides evidence for the formation of a Co–N bond, further substantiating the potential for electron transfer between PPy and Co3O4. Additionally, as observed in Fig. S1(b),† the C 1s region of PPy@Co3O4 catalysts in high-resolution XPS can be divided into four peaks. The peaks at 284.4, 285.2, 286.5, and 289.1 eV correspond to C–C, C–N, C–O, and C
N bond in PPy4,32 and the peak at 399.8 eV provides evidence for the formation of a Co–N bond, further substantiating the potential for electron transfer between PPy and Co3O4. Additionally, as observed in Fig. S1(b),† the C 1s region of PPy@Co3O4 catalysts in high-resolution XPS can be divided into four peaks. The peaks at 284.4, 285.2, 286.5, and 289.1 eV correspond to C–C, C–N, C–O, and C![[double bond, length as m-dash]](https://www.rsc.org/images/entities/char_e001.gif) O/C
O/C![[double bond, length as m-dash]](https://www.rsc.org/images/entities/char_e001.gif) N bonds, respectively.20,33 These results contribute to further characterizing the chemical composition and bonding states of the PPy@Co3O4 composite materials.
N bonds, respectively.20,33 These results contribute to further characterizing the chemical composition and bonding states of the PPy@Co3O4 composite materials.
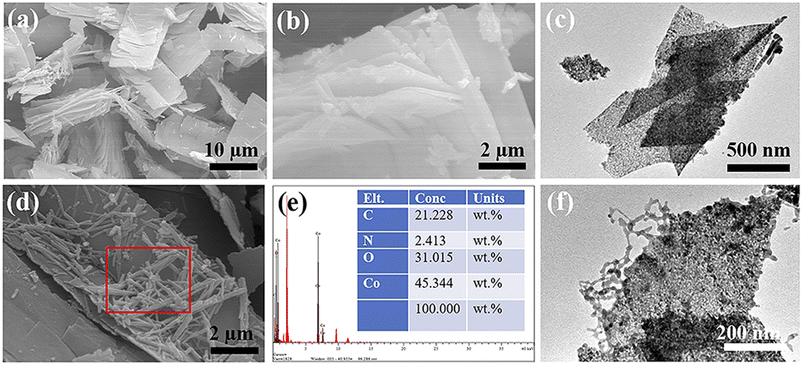
According to Fig. 6(a) and (b), the Co3O4 prepared using PVP as a template exhibits a multi-layered sheet-like structure. This is likely the result of the gradual growth of cobalt nitrate and urea precursor on the surface of the PVP template.34 With prolonged reaction time, the particle mass of the cobalt nitrate and urea precursor product gradually increases, leading to the gradual aggregation of initially independent nanocrystals through weak intermolecular interactions. After high-temperature calcination, they transform into a multi-layered Co3O4 nanosheet structure. This conclusion is further supported by the TEM results shown in Fig. 6(c), which confirms the prepared Co3O4 nanosheet structure. Fig. 6(d) displays the SEM image of the prepared PPy@Co3O4, clearly showing the distribution of PPy nanofibers on the surface of Co3O4 nanosheets. The corresponding EDS analysis results (Fig. 6(e)) demonstrate the elemental composition and content of PPy@Co3O4. The TEM results of PPy@Co3O4 in Fig. 6(f) reveal tightly and uniformly anchored PPy nanofibers on the surface of Co3O4 nanosheets. The elemental mapping images of PPy@Co3O4 (Fig. S2†) further corroborate this observation.
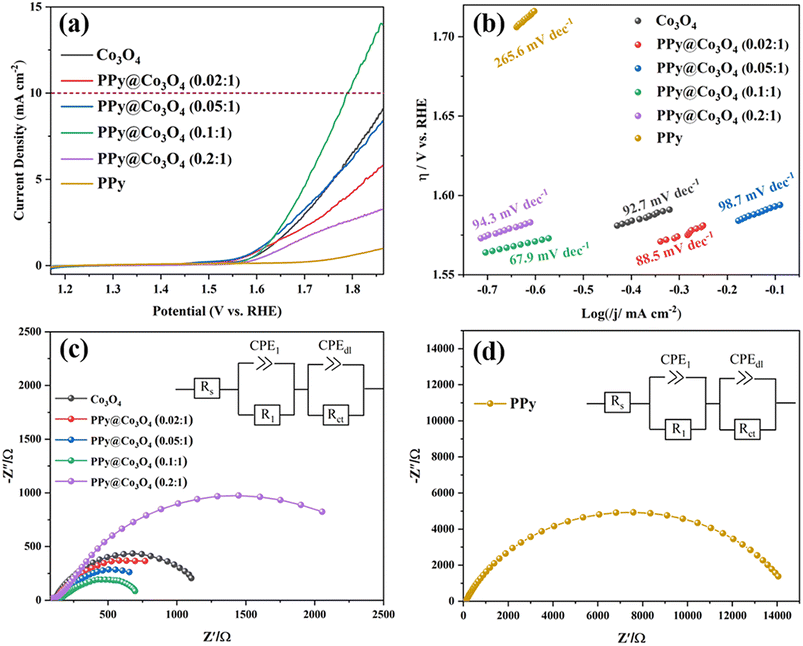
By conducting LSV tests, as shown in Fig. 7(a), we compared the OER catalytic activity of Co3O4, PPy@Co3O4, and PPy. The results demonstrate that PPy exhibits inferior catalytic activity. In contrast, the optimized PPy@Co3O4 (0.1![[thin space (1/6-em)]](https://www.rsc.org/images/entities/char_2009.gif) :
:![[thin space (1/6-em)]](https://www.rsc.org/images/entities/char_2009.gif) 1) catalyst exhibits the best catalytic performance, achieving a potential of 1.794 V vs. RHE at a current density of 10 mA cm−2, while the other PPy@Co3O4 and Co3O4 catalyst samples did not reach the potential for a current density of 10 mA cm−2. Compared to other catalysts, the optimized PPy@Co3O4 (0.1
1) catalyst exhibits the best catalytic performance, achieving a potential of 1.794 V vs. RHE at a current density of 10 mA cm−2, while the other PPy@Co3O4 and Co3O4 catalyst samples did not reach the potential for a current density of 10 mA cm−2. Compared to other catalysts, the optimized PPy@Co3O4 (0.1![[thin space (1/6-em)]](https://www.rsc.org/images/entities/char_2009.gif) :
:![[thin space (1/6-em)]](https://www.rsc.org/images/entities/char_2009.gif) 1) catalyst demonstrates exceptional catalytic performance, achieving a potential of 1.794 V vs. RHE at a current density of 10 mA cm−2. Meanwhile, other PPy@Co3O4 and Co3O4 catalyst samples failed to attain this potential at the same current density. This indicates that as the content of PPy increases, its evolving network structure extensively covers the nanoplate surfaces, enhancing electron transport rates.
1) catalyst demonstrates exceptional catalytic performance, achieving a potential of 1.794 V vs. RHE at a current density of 10 mA cm−2. Meanwhile, other PPy@Co3O4 and Co3O4 catalyst samples failed to attain this potential at the same current density. This indicates that as the content of PPy increases, its evolving network structure extensively covers the nanoplate surfaces, enhancing electron transport rates.
However, surpassing an optimal PPy content starts to negate these benefits, as active sites on the nanoplates could be permanently occluded by thick layers of PPy, hindering electron transfer. In short, polypyrrole plays a pivotal role in enhancing conductivity and acting as a conductive binder, but an excess of PPy can suppress the OER performance of the catalyst.35–37 Furthermore, by comparing the corresponding Tafel slopes shown in Fig. 7(b), it can be observed that PPy@Co3O4 (0.1![[thin space (1/6-em)]](https://www.rsc.org/images/entities/char_2009.gif) :
:![[thin space (1/6-em)]](https://www.rsc.org/images/entities/char_2009.gif) 1) possesses the lowest slope value of 67.9 mV dec−1 among the catalyst samples, indicating higher catalytic activity and a faster OER reaction rate. Additionally, the catalytic activity of PPy@Co3O4 (0.1
1) possesses the lowest slope value of 67.9 mV dec−1 among the catalyst samples, indicating higher catalytic activity and a faster OER reaction rate. Additionally, the catalytic activity of PPy@Co3O4 (0.1![[thin space (1/6-em)]](https://www.rsc.org/images/entities/char_2009.gif) :
:![[thin space (1/6-em)]](https://www.rsc.org/images/entities/char_2009.gif) 1) is comparable to similar catalyst materials reported in the literature,3,4,38,39 as evident from the comparison in Table 1.
1) is comparable to similar catalyst materials reported in the literature,3,4,38,39 as evident from the comparison in Table 1.
| Catalysts | Electrolyte (M) | OER onset potential (E/V vs. RHE) | Tafel slope (mV dec−1) | EOER at 10 mA cm−2 | Ref. |
|---|---|---|---|---|---|
PPy@Co3O4 (0.02![[thin space (1/6-em)]](https://www.rsc.org/images/entities/char_2009.gif) : :![[thin space (1/6-em)]](https://www.rsc.org/images/entities/char_2009.gif) 1) 1) |
0.1 | 1.436 | 88.5 | This work | |
PPy@Co3O4 (0.05![[thin space (1/6-em)]](https://www.rsc.org/images/entities/char_2009.gif) : :![[thin space (1/6-em)]](https://www.rsc.org/images/entities/char_2009.gif) 1) 1) |
0.1 | 1.433 | 98.7 | This work | |
PPy@Co3O4 (0.1![[thin space (1/6-em)]](https://www.rsc.org/images/entities/char_2009.gif) : :![[thin space (1/6-em)]](https://www.rsc.org/images/entities/char_2009.gif) 1) 1) |
0.1 | 1.540 | 67.9 | 1.794 | This work |
PPy@Co3O4 (0.2![[thin space (1/6-em)]](https://www.rsc.org/images/entities/char_2009.gif) : :![[thin space (1/6-em)]](https://www.rsc.org/images/entities/char_2009.gif) 1) 1) |
0.1 | 1.544 | 94.3 | This work | |
| Co3O4/N-CNTs | 1 | 1.37 | 40 | 1.55 | 3 |
| Co3O4/PPy-120 | 1 | 57.7 | 1.45 | 4 | |
| Co3O4/PPy/RGO | 0.1 | 1.298 | 105 | 38 | |
| IrO2 | 0.1 | 1.56 | 115 | 1.68 | 39 |
Fig. 7(c) and (d) present the electrochemical impedance spectroscopy (EIS) of PPy@Co3O4 at different mass ratios and pure PPy catalyst, respectively. The Nyquist plot is fitted based on an equivalent circuit model, as depicted in the inset. In this model, Rs represents the solution resistance; R1 corresponds to the electron transfer resistance from the catalyst to the electrode; and Rct denotes the charge transfer resistance at the interface. Typically, a smaller Rct value suggests a faster kinetic response of the catalyst. From the fitting data, it's observed that PPy@Co3O4 (0.1![[thin space (1/6-em)]](https://www.rsc.org/images/entities/char_2009.gif) :
:![[thin space (1/6-em)]](https://www.rsc.org/images/entities/char_2009.gif) 1) has the lowest Rct value of 630 Ω. In comparison, PPy@Co3O4 (0.02
1) has the lowest Rct value of 630 Ω. In comparison, PPy@Co3O4 (0.02![[thin space (1/6-em)]](https://www.rsc.org/images/entities/char_2009.gif) :
:![[thin space (1/6-em)]](https://www.rsc.org/images/entities/char_2009.gif) 1) and PPy@Co3O4 (0.05
1) and PPy@Co3O4 (0.05![[thin space (1/6-em)]](https://www.rsc.org/images/entities/char_2009.gif) :
:![[thin space (1/6-em)]](https://www.rsc.org/images/entities/char_2009.gif) 1) exhibit Rct values of 950 Ω and 1029 Ω, respectively. On the other hand, PPy@Co3O4 (0.2
1) exhibit Rct values of 950 Ω and 1029 Ω, respectively. On the other hand, PPy@Co3O4 (0.2![[thin space (1/6-em)]](https://www.rsc.org/images/entities/char_2009.gif) :
:![[thin space (1/6-em)]](https://www.rsc.org/images/entities/char_2009.gif) 1) displays a relatively higher impedance. This indicates that PPy@Co3O4 at a 0.1
1) displays a relatively higher impedance. This indicates that PPy@Co3O4 at a 0.1![[thin space (1/6-em)]](https://www.rsc.org/images/entities/char_2009.gif) :
:![[thin space (1/6-em)]](https://www.rsc.org/images/entities/char_2009.gif) 1 mass ratio demonstrates the best charge transfer efficiency and enhanced catalytic activity.
1 mass ratio demonstrates the best charge transfer efficiency and enhanced catalytic activity.
Additionally, as shown in Fig. 7(d), the impedance of the pure PPy nanofibers is notably higher than that of PPy@Co3O4 composite catalysts at any given ratio. This further confirms that an appropriate amount of PPy can facilitate electron transport between PPy and Co3O4. This synergistic effect leads to a reduced charge transfer resistance at the interface between the electrolyte and the electrode, enhancing the overall charge transport performance and decreasing interfacial resistance.
To better elucidate the electrocatalytic activity of PPy@Co3O4, cyclic voltammetry (CV) tests were conducted on all the prepared PPy@CoCo3O4 composite materials at varying scan rates (as illustrated in Fig. S3 and S4†). From the CV curves depicted in Fig. S3,† the double-layer capacitance (Cdl) values for the catalysts were calculated as follows: PPy@Co3O4 (0.02![[thin space (1/6-em)]](https://www.rsc.org/images/entities/char_2009.gif) :
:![[thin space (1/6-em)]](https://www.rsc.org/images/entities/char_2009.gif) 1) 1.80 mF cm−2, PPy@Co3O4 (0.05
1) 1.80 mF cm−2, PPy@Co3O4 (0.05![[thin space (1/6-em)]](https://www.rsc.org/images/entities/char_2009.gif) :
:![[thin space (1/6-em)]](https://www.rsc.org/images/entities/char_2009.gif) 1) 4.35 mF cm−2, PPy@Co3O4 (0.1
1) 4.35 mF cm−2, PPy@Co3O4 (0.1![[thin space (1/6-em)]](https://www.rsc.org/images/entities/char_2009.gif) :
:![[thin space (1/6-em)]](https://www.rsc.org/images/entities/char_2009.gif) 1) 6.07 mF cm−2, and PPy@Co3O4 (0.2
1) 6.07 mF cm−2, and PPy@Co3O4 (0.2![[thin space (1/6-em)]](https://www.rsc.org/images/entities/char_2009.gif) :
:![[thin space (1/6-em)]](https://www.rsc.org/images/entities/char_2009.gif) 1) 1.77 mF cm−2. Correspondingly, their electrochemical surface areas (ECSA) were 45.00 cm2 cm−2, 108.75 cm2 cm−2, 151.75 cm2 cm−2, and 44.25 cm2 cm−2, respectively. Notably, PPy@Co3O4 (0.1
1) 1.77 mF cm−2. Correspondingly, their electrochemical surface areas (ECSA) were 45.00 cm2 cm−2, 108.75 cm2 cm−2, 151.75 cm2 cm−2, and 44.25 cm2 cm−2, respectively. Notably, PPy@Co3O4 (0.1![[thin space (1/6-em)]](https://www.rsc.org/images/entities/char_2009.gif) :
:![[thin space (1/6-em)]](https://www.rsc.org/images/entities/char_2009.gif) 1) exhibited the largest ECSA. ECSA is a pivotal metric in evaluating the performance of electrocatalysts. A larger ECSA often implies that more active sites are exposed to the reaction medium, frequently leading to enhanced OER catalytic activity. Additionally, an increased ECSA provides more pathways and channels for the efficient transport of electrolytes, intermediates, and products, thereby further optimizing catalytic performance.
1) exhibited the largest ECSA. ECSA is a pivotal metric in evaluating the performance of electrocatalysts. A larger ECSA often implies that more active sites are exposed to the reaction medium, frequently leading to enhanced OER catalytic activity. Additionally, an increased ECSA provides more pathways and channels for the efficient transport of electrolytes, intermediates, and products, thereby further optimizing catalytic performance.
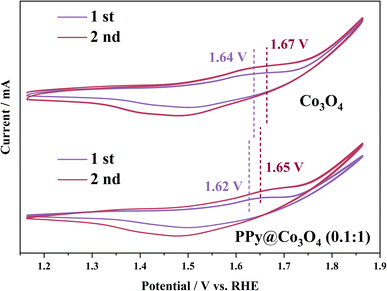
The pre-oxidation of the electrocatalyst plays a pivotal role in evaluating the active species through CV activation. CV activation promotes the transition from Co2+ to Co3+, highlighting the crucial step for efficient OER activity.1,40 As observed from Fig. S4(a)–(d),† oxidation peaks are evident at potentials of 1.6–1.7 V. With an increasing scan rate, the capacitive charge also rises, indicating an irreversible reaction on the electrocatalyst surface due to polarization. However, Fig. S4(e)† shows that an excessive content of polypyrrole impedes electron transfer, resulting in a less distinct polarization effect. As depicted in Fig. 8, the second cycle displays a more significant capacitive charge than the first cycle, suggesting that polarization occurred on the electrocatalyst surface, leading to enhanced structural stability. Moreover, for the PPy@Co3O4 (0.1![[thin space (1/6-em)]](https://www.rsc.org/images/entities/char_2009.gif) :
:![[thin space (1/6-em)]](https://www.rsc.org/images/entities/char_2009.gif) 1) sample, the oxidation peak in the first cycle appears at 1.62 V and shifts to 1.65 V in the second cycle.
1) sample, the oxidation peak in the first cycle appears at 1.62 V and shifts to 1.65 V in the second cycle.
For Co3O4, oxidation peaks are observed at 1.64 V (first cycle) and 1.67 V (second cycle). This demonstrates that PPy can facilitate the pre-oxidation of Co2+, accelerating electron transfer.
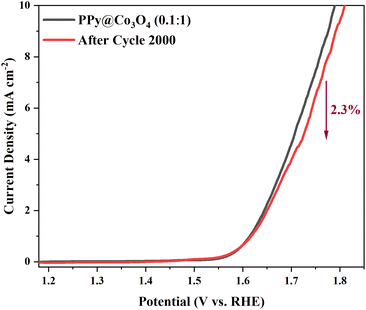
Based on the above analysis, it is evident that the composite catalyst structure, consisting of multi-layered Co3O4 nanosheets and attached PPy nanofibers, offers advantages such as increased effective reaction interface, abundant active sites, excellent charge transfer performance, and facilitated reactant diffusion. These characteristics collectively contribute to the enhanced OER catalytic activity of the catalyst.16,41,42 To evaluate the practical application potential of the PPy@Co3O4 (0.1![[thin space (1/6-em)]](https://www.rsc.org/images/entities/char_2009.gif) :
:![[thin space (1/6-em)]](https://www.rsc.org/images/entities/char_2009.gif) 1) catalyst, we conducted cyclic stability testing with 2000 cycles of CV measurements, as shown in Fig. 9. The results demonstrated excellent stability performance, with a minimal decay rate of only 2.3% observed at the end of the test.
1) catalyst, we conducted cyclic stability testing with 2000 cycles of CV measurements, as shown in Fig. 9. The results demonstrated excellent stability performance, with a minimal decay rate of only 2.3% observed at the end of the test.
Fig. 10 illustrates the mechanism diagram of the PPy@Co3O4 (0.1![[thin space (1/6-em)]](https://www.rsc.org/images/entities/char_2009.gif) :
:![[thin space (1/6-em)]](https://www.rsc.org/images/entities/char_2009.gif) 1) catalyst. The multilayered thin flake-like Co3O4 provides a substantial surface area, while the attached PPy nanofibers further expand the reaction interface, creating abundant active sites for catalytic reactions. This unique composite structure significantly enhances the catalyst-electrolyte contact area, synergistically promoting catalytic efficiency. Moreover, the PPy nanofibers serve as a protective layer for the multilayered Co3O4 structure. They effectively shield Co3O4 from direct contact with the KOH electrolyte, reducing corrosion and dissolution of Co3O4, thus enhancing catalyst stability and maintaining long-term catalytic activity. Additionally, the flexible and tunable nature of PPy nanofibers mitigates volume changes and stress accumulation. The distinctive microstructural features of the PPy@Co3O4 (0.1
1) catalyst. The multilayered thin flake-like Co3O4 provides a substantial surface area, while the attached PPy nanofibers further expand the reaction interface, creating abundant active sites for catalytic reactions. This unique composite structure significantly enhances the catalyst-electrolyte contact area, synergistically promoting catalytic efficiency. Moreover, the PPy nanofibers serve as a protective layer for the multilayered Co3O4 structure. They effectively shield Co3O4 from direct contact with the KOH electrolyte, reducing corrosion and dissolution of Co3O4, thus enhancing catalyst stability and maintaining long-term catalytic activity. Additionally, the flexible and tunable nature of PPy nanofibers mitigates volume changes and stress accumulation. The distinctive microstructural features of the PPy@Co3O4 (0.1![[thin space (1/6-em)]](https://www.rsc.org/images/entities/char_2009.gif) :
:![[thin space (1/6-em)]](https://www.rsc.org/images/entities/char_2009.gif) 1) catalyst enable sustained high catalytic activity during prolonged use.
1) catalyst enable sustained high catalytic activity during prolonged use.
Conclusions
In summary, we successfully synthesized a composite catalyst, PPy@Co3O4, consisting of multilayered thin-film Co3O4 with PPy nanofibers attached on the surface. The catalytic performance and stability of PPy@Co3O4 in OER were evaluated. Comparative analysis of Co3O4, PPy, and different mass ratios of PPy@Co3O4 catalyst samples revealed that PPy@Co3O4 (0.1![[thin space (1/6-em)]](https://www.rsc.org/images/entities/char_2009.gif) :
:![[thin space (1/6-em)]](https://www.rsc.org/images/entities/char_2009.gif) 1) exhibited the highest OER catalytic activity. It demonstrated a lower overpotential at a current density of 10 mA cm−2, indicating a faster reaction rate in the OER. Tafel slope analysis further confirmed the rapid kinetic response of the PPy@Co3O4 (0.1
1) exhibited the highest OER catalytic activity. It demonstrated a lower overpotential at a current density of 10 mA cm−2, indicating a faster reaction rate in the OER. Tafel slope analysis further confirmed the rapid kinetic response of the PPy@Co3O4 (0.1![[thin space (1/6-em)]](https://www.rsc.org/images/entities/char_2009.gif) :
:![[thin space (1/6-em)]](https://www.rsc.org/images/entities/char_2009.gif) 1) catalyst. Moreover, the CV stability test demonstrated excellent stability performance of the PPy@Co3O4 (0.1
1) catalyst. Moreover, the CV stability test demonstrated excellent stability performance of the PPy@Co3O4 (0.1![[thin space (1/6-em)]](https://www.rsc.org/images/entities/char_2009.gif) :
:![[thin space (1/6-em)]](https://www.rsc.org/images/entities/char_2009.gif) 1) catalyst with only a 2.3% decay after 2000 cycles. The unique structure of multilayered thin-film Co3O4 and attached PPy nanofibers provided numerous active sites, enhanced charge transfer properties, and a protective layer, effectively promoting the OER while minimizing catalyst corrosion and dissolution. These findings offer new insights and strategies for the development of efficient and stable OER catalysts with potential applications in energy conversion and storage.
1) catalyst with only a 2.3% decay after 2000 cycles. The unique structure of multilayered thin-film Co3O4 and attached PPy nanofibers provided numerous active sites, enhanced charge transfer properties, and a protective layer, effectively promoting the OER while minimizing catalyst corrosion and dissolution. These findings offer new insights and strategies for the development of efficient and stable OER catalysts with potential applications in energy conversion and storage.
Conflicts of interest
There are no conflicts to declare.Acknowledgements
This work was financially supported by the Natural Science Foundation of Heilongjiang Province, China (LH2019E092), the Key research and development guidance projects in Heilongjiang Province (GZ20210034), and the Opening Foundation of Heilongjiang Provincial Key Laboratory of Polymeric Composition materials (CLKFKT2021B1).References
- D. P. Zhao, M. Z. Dai, Y. Zhao, H. Q. Liu, Y. Liu and X. Wu, Nano Energy, 2020, 72 Search PubMed.
- J. He, Z. F. Hu, K. Deng, R. J. Zhao, X. B. Lv, W. Tian, Y. X. Zhang and J. Y. Ji, CrystEngComm, 2021, 23, 2262–2268 RSC.
- S. Farid, W. W. Qiu, J. L. Zhao, X. D. Song, Q. Mao, S. Z. Ren and C. Hao, J. Electroanal. Chem., 2020, 858 Search PubMed.
- Y. L. Tong, H. Q. Liu, M. Z. Dai, L. Xiao and X. Wu, Chin. Chem. Lett., 2020, 31, 2295–2299 CrossRef CAS.
- K. Y. Zhu, M. R. Li, X. N. Li, X. F. Zhu, J. H. Wang and W. S. Yang, Chem. Commun., 2016, 52, 11803–11806 RSC.
- T. T. Liu, M. Li, X. J. Bo and M. Zhou, ACS Sustainable Chem. Eng., 2018, 6, 11457–11465 CrossRef CAS.
- Y. J. Zhang, C. Wang, N. F. Wan and Z. Q. Mao, Int. J. Hydrogen Energy, 2007, 32, 400–404 CrossRef CAS.
- Z. Ma, Y. Zhang, S. Z. Liu, W. Q. Xu, L. J. Wu, Y. C. Hsieh, P. Liu, Y. M. Zhu, K. Sasaki, J. N. Renner, K. E. Ayers, R. R. Adzic and J. X. Wang, J. Electroanal. Chem., 2018, 819, 296–305 CrossRef CAS.
- A. M. Asiri, K. Akhtar and S. B. Khan, Ceram. Int., 2019, 45, 13340–13346 CrossRef CAS.
- Y. K. Duan, Q. L. Zhang, Z. X. Song, J. Wang, X. S. Tang, Q. X. Liu and T. F. Zhang, Res. Chem. Intermed., 2017, 43, 7241–7255 CrossRef CAS.
- X. X. Zhang, Q. S. Xie, G. H. Yue, Y. Zhang, X. Q. Zhang, A. L. Lu and D. L. Peng, Electrochim. Acta, 2013, 111, 746–754 CrossRef CAS.
- H. Wang, J. Y. Zhou, J. Sun, Y. Wang, Y. J. Ma, Z. L. Bai, Y. J. Zhao and W. M. Zhang, Int. J. Electrochem. Sci., 2020, 15, 9849–9863 CrossRef.
- J. H. Jiang, W. D. Shi, S. Y. Song, Q. L. Hao, W. Q. Fan, X. F. Xia, X. Zhang, Q. Wang, C. B. Liu and D. Yan, J. Power Sources, 2014, 248, 1281–1289 CrossRef CAS.
- L. L. Liu, Y. Y. Hou, J. Wang, J. Chen, H. K. Liu, Y. P. Wu and J. Z. Wang, Adv. Mater. Interfaces, 2016, 3, 1600030 CrossRef.
- A. Bahloul, B. Nessark, E. Briot, H. Groult, A. Mauger, K. Zaghib and C. M. Julien, J. Power Sources, 2013, 240, 267–272 CrossRef CAS.
- H. Mao, X. Guo, Y. L. Fu, Z. Q. Cao, D. Y. Sun, B. X. Wang, Y. Zhang, Q. Z. Fan and X. M. Song, Appl. Surf. Sci., 2019, 485, 554–563 CrossRef CAS.
- L. Zhan, H. B. Chen, J. Q. Fang, S. Q. Wang, L. X. Ding, Z. Li, P. J. Ashman and H. H. Wang, Electrochim. Acta, 2016, 209, 192–200 CrossRef CAS.
- D. Guo, M. Y. Zhang, Z. Chen and X. X. Liu, Mater. Res. Bull., 2017, 96, 463–470 CrossRef CAS.
- C. J. Liu, Z. Wang, X. Zong, Y. M. Jin, D. Li, Y. P. Xiong and G. Wu, Nanoscale, 2020, 12, 9581–9589 RSC.
- G. Y. Ren, Y. N. Li, Z. Y. Guo, G. Z. Xiao, Y. Zhu, L. M. Dai and L. Jiang, Nano Res., 2015, 8, 3461–3471 CrossRef CAS.
- L. H. Ai and J. Jiang, J. Mater. Sci.: Mater. Electron., 2010, 21, 410–415 CrossRef CAS.
- S. Z. Ren, Y. N. Guo, S. B. Ma, Q. Mao, D. D. Wu, Y. Yang, H. Y. Jing, X. D. Song and C. Hao, Chin. J. Catal., 2017, 38, 1281–1290 CrossRef CAS.
- W. J. Wang, C. Wang, P. Dou, L. F. Zhang, J. Zheng, Z. Z. Cao and X. H. Xu, Anal. Methods, 2017, 9, 1905–1911 RSC.
- L. C. Daza-Gomez, V. F. Ruiz-Ruiz, J. A. Mendoza-Nieto, H. Pfeiffer and D. Diaz, Appl. Clay Sci., 2020, 190 Search PubMed.
- Z. Wang, P. J. Zuo, L. Q. Fan, J. N. Han, Y. P. Xiong and G. P. Yin, J. Power Sources, 2016, 311, 68–80 CrossRef CAS.
- X. H. Wang, Y. Fang, B. Shi, F. F. Huang, F. Rong, R. H. Que and M. W. Shao, ChemistrySelect, 2017, 2, 9267–9276 CrossRef CAS.
- Y. Li, L. S. Hu, W. R. Zheng, X. Peng, M. J. Liu, P. K. Chu and L. Y. S. Lee, Nano Energy, 2018, 52, 360–368 CrossRef CAS.
- H. Q. Liu, D. P. Zhao, Y. Liu, P. F. Hu, X. Wu and H. Xia, Chem. Eng. J., 2019, 373, 485–492 CrossRef CAS.
- X. C. Cao, W. N. Yan, C. Jin, J. H. Tian, K. Ke and R. Z. Yang, Electrochim. Acta, 2015, 180, 788–794 CrossRef CAS.
- W. Jiang, F. Hu, Q. Y. Yan and X. Wu, Inorg. Chem. Front., 2017, 4, 1642–1648 RSC.
- S. Ramani, S. Cogal, J. Lowe, V. R. Bhethanabotla and J. N. Kuhn, J. Catal., 2020, 391, 357–365 CrossRef CAS.
- X. J. Yang, K. B. Xu, R. J. Zou and J. Q. Hu, Nano-Micro Lett., 2016, 8, 143–150 CrossRef PubMed.
- H. X. Dai, M. Lin, N. Wang, F. Xu, D. L. Wang and H. Y. Ma, Chemelectrochem, 2017, 4, 1135–1140 CrossRef CAS.
- G. D. Wei, Y. Deng and C. W. Nan, Chem. Phys. Lett., 2003, 367, 512–515 CrossRef CAS.
- D. P. Zhao, H. Q. Liu and X. Wu, Nano Energy, 2019, 57, 363–370 CrossRef CAS.
- H. Mao, X. Guo, Y. L. Fu, H. R. Yang, Y. Zhang, R. Zhang and X. M. Song, J. Mater. Chem. A, 2020, 8, 1821–1828 RSC.
- Y. X. Chen, L. Shen, C. C. Wang, S. Y. Feng, N. Zhang, S. Y. Xiang, T. L. Feng, M. X. Yang, K. Zhang and B. Yang, Appl. Catal., B, 2020, 274 CAS.
- S. S. Jayaseelan, N. Bhuvanendran, Q. Xu and H. N. Su, Int. J. Hydrogen Energy, 2020, 45, 4587–4595 CrossRef CAS.
- Y. F. Bu, O. Gwon, G. Nam, H. Jang, S. Kim, Q. Zhong, J. Cho and G. Kim, ACS Nano, 2017, 11, 11594–11601 CrossRef CAS PubMed.
- B. S. Yeo and A. T. Bell, J. Am. Chem. Soc., 2011, 133, 5587–5593 CrossRef CAS PubMed.
- Q. Z. Hu, Y. Liu, L. T. Ma, X. M. Zhang and H. T. Huang, J. Appl. Electrochem., 2018, 48, 1189–1195 CrossRef CAS.
- Z. Yu, Y. Bai, Y. X. Liu, S. M. Zhang, D. D. Chen, N. Q. Zhang and K. N. Sun, ACS Appl. Mater. Interfaces, 2017, 9, 31777–31785 CrossRef CAS PubMed.
Footnote |
| † Electronic supplementary information (ESI) available. See DOI: https://doi.org/10.1039/d3ra05936g |
| This journal is © The Royal Society of Chemistry 2023 |

