 Open Access Article
Synthesis, characterization and anti-breast cancer potential of an incensole acetate nanoemulsion from Catharanthus roseus essential oil; in silico, in vitro, and in vivo study†
Iffat Nayila *a,
Sumaira Sharif*a,
Madeeha Shahzad Lodhia,
Muhammad Fayyaz Ur Rehmanb and
Farhana Amanc
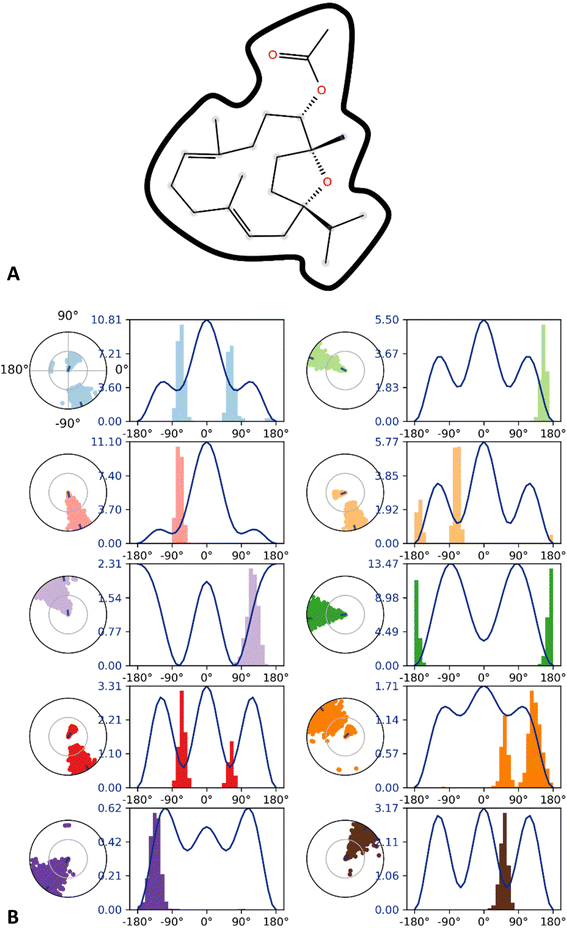
aInstitute of Molecular Biology and Biotechnology, The University of Lahore, Lahore, Pakistan. E-mail: iffat.nayila5@gmail.com; Sumaira.Sharif@imbb.uil.edu.pk
bInstitute of Chemistry, University of Sargodha, Sargodha, Pakistan
cDepartment of Chemistry, The University of Lahore, Sargodha Campus, Sargodha, Pakistan
First published on 2nd November 2023
Abstract
The characteristics of phytocompounds and essential oils have undergone extensive research in the medical and pharmaceutical sectors due to their extensive usage. In spite of the fact that these molecules are widely used, terpenes, terpenoids, and their derivatives have not yet been well characterized. This study intends to evaluate the prospective activity of incensole acetate (IA), a compound identified and isolated from Catharanthus roseus essential oil by GC/MS analysis and column chromatography, and to analyze the anticancer effect of an IA biosynthesized nanoemulsion against breast cancer. The in silico activity of IA against breast cancer targets was observed by molecular docking, ADMET assessment and molecular dynamics simulations. The IA-mediated nanoformulation exhibited cytotoxicity against breast cancer cell lines at an effective concentration when analyzed by MTT and crystal violet assay. The increased interleukin serum indicators were significantly improved as a result of nanoemulsion treatment in a DMBA-induced rat model. In addition, the anticancer properties of IA biosynthesized nanoemulsion are supported due to their potential effects on biochemical parameters, oxidative stress markers, proinflammatory cytokines, and upon tumor growth profiling in cancer-induced rats.
1. Introduction
In this century, cancer is expected to be the major cause of death among the population and is now the greatest cause of mortality after cardiovascular diseases. However, due to the financial costs of cancer, there are still significant disparities in access to new cancer medications across various nations.1 Therefore, it is necessary to identify alternatives that have an equivalent or superior therapeutic efficacy, are more cost-effective and adhere to natural compound utilization.2 Malignancies, inflammatory conditions and cardiovascular diseases can all be treated with a wide number of plant-based formulations.3 Terpenes, terpenoids, alkaloids, and saponins are used as potential anticancer inhibitors. Pharmacological tests on animal models using aqueous plant extracts have revealed their cytotoxic, anti-cancer, and antioxidant properties.4 The major active natural metabolites isolated from plants are known for inhibiting human colon, ovarian, liver, breast, and prostate cancers.5Carcinogenesis, which causes genetic changes and the attainment of crucial functional capacities for survival, unchecked cell proliferation, and cell dispersion, is the result of genomic instability and subsequent mutations, which can be promoted by inflammatory pathways.6 Terpenes and terpenoids have been used as medicines due to their antibacterial, antiviral, anti-inflammatory, and immunomodulation properties.7 The chemopreventive action of terpenes can take place either during the initiation phase of carcinogenesis, preventing the interaction of oncogenic agents with DNA, inhibiting the growth of cancer cells by inducing apoptosis and programmed cell differentiation.8
According to recent data, terpenes can be therapeutically used against different diseases, such as myrcene and β-caryophyllene (terpene phytocompounds) that are present in different herbal plants, which are used to treat inflammatory disorders and help to minimize tumor growth.9 Terpenes target key signaling pathways involved in all the hallmarks of cancer, and are also used as complementary chemotherapeutic regimens by reducing some adverse actions of chemotherapeutic agents, such as bleeding, irritation and illness, as well as exhibiting cytotoxicity toward cancer cells.10 The primary terpene active metabolites that have been identified and are known to constrain human ovarian and prostate cancer cells are promising targets for cancer chemoprevention because they can obstruct the growth of malignant cells by reducing angiogenesis and inducing apoptosis.11
Terpene treatment decreases pro-inflammatory cytokine production, edema, and cell migration to the region of inflammation in different inflammation mechanisms.12 Some of the terpenoids that have been discovered have anticancer properties that include suppressing angiogenesis and metastasis in the late stages of tumor development by controlling different intracellular signaling pathways.13 Some terpenoid compounds aid in the initiation and progression of tumorigenesis by inducing tumor cell differentiation and apoptosis.14 Terpenoids control tumor cell growth and proliferation through inducing cellular changes in the genes that activate apoptosis and inhibit hormonal activity. D-Limonene, a common terpene molecule, has the benefit of being a powerful malignant and stem cell inhibitor.15
Polymeric nanosized lipid carriers and nano emulsions have been shown to be a great approach for drug delivery, treatment and drug absorption for cancer ailments.16 Nanoparticles used in in vitro and in vivo experimental models are characterized by oil-in-water or water-in-oil nano-emulsions that have excellent biological properties. The DNA-binding and DNA-destructive properties of nano formulations may be linked to cellular apoptotic activity, laying the groundwork for new cancer treatment strategies.17
Therefore, in this study, incensole acetate (IA), a terpenoid molecule isolated from C. roseus essential oil, was assessed via an in silico docking study against breast cancer targets, wherein a biosynthesized nanoemulsion of IA was characterized and its anticancer effects were evaluated in a 7,12-dimethylbenz[a]anthracene (DMBA)-induced cancer rat model.
2. Materials and methods
2.1 Collection of plant material
Catharanthus roseus fresh plants were collected from local nursery farms in spring. Plant specimens were identified by Dr Iftikhar Ahmad and a voucher specimen (181-1-23) was deposited at Agriculture University Faisalabad. Fresh plants were air-dried at 25 to 28 °C and ground into powder form.2.2 Extraction of essential oil and GC/MS analysis
C. roseus oil was extracted using Clevenger-type hydro distillation apparatus. 100–150 mg of dried powdered plant was put into distillation flask in distilled water as a solvent. The mixture was left to stand for an hour, followed by heating at 100 °C for 4–6 h. This mixture then brought to boil constantly and vapors were condensed on a cold surface by means of a condenser attached to distillation apparatus. The essential oil (EO) was extracted based on the difference in density and then collected for further analysis and compound isolation. EO was collected in Eppendorf tubes, then stored at 4–6 °C for GC-MS analysis and isolation of phytocompounds.18 The GC-MS analysis of the C. roseus oil was performed using a multi-dimensional gas chromatography technique coupled with a mass spectrophotometer, employing a capillary column and helium as the carrier gas.19 First, 0.2 μL of essential oil was injected into the column at 1 μL min−1 at 250 °C and the oven temperature was adjusted to 60 °C for 15 min and then progressively raised to 280 °C for 3 min. Comparison of the mass spectra and retention indices served as the basis for identifying compounds. Peak area normalization was used to express the relative percentage of each extract constituent as a percentage. The mass spectra of the plant extracts were interpreted using the National Institute of Standard and Technology (NIST) library's database.2.3 Isolation of terpenes
The isolation of terpenes from C. roseus essential oil was carried out by successive purification through column chromatography. In the column chromatography, silica gel 60 (E. Merck, 70–230 mesh size) was used and the mobile phase comprised acetone, ethyl acetate, dichloromethane and methanol. In order to perform column chromatography, the essential oil from C. roseus was dissolved in solvents and triturated with silica. A slurry of silica gel and solvent was poured into the glass column. The packed column was left for a few hours before the sample was added using the wet-packing method to the packed column's top. The valve on the column was opened and around 10 to 30 mL of the solvent exiting the column were collected in test tubes. To determine the retention factor (Rf) of components that showed up as spots, samples from the column fractions were analyzed using TLC (thin layer chromatography) plates in distilled water![[thin space (1/6-em)]](https://www.rsc.org/images/entities/char_2009.gif) :
:![[thin space (1/6-em)]](https://www.rsc.org/images/entities/char_2009.gif) ethyl acetate (4
ethyl acetate (4![[thin space (1/6-em)]](https://www.rsc.org/images/entities/char_2009.gif) :
:![[thin space (1/6-em)]](https://www.rsc.org/images/entities/char_2009.gif) 2, v/v) solvent systems. The percentage of separated components was calculated after solvent separation.20
2, v/v) solvent systems. The percentage of separated components was calculated after solvent separation.20
2.4 Characterization of terpenes
NMR is a biophysical tool that has found widespread usage in drug discovery research. Analyses can be performed on a sizable number of samples in both the solution and solid states.21 NMR spectroscopy was carried out using a JEOL JNM-ECA 500 spectrometer to measure the 1H and 13C spectra at 500 and 125 MHz, respectively. In order to get the sample deep enough for an NMR spectrometer to study, the sample was diluted in 0.8 mL of deuterated chloroform (CDCl3) and poured into the tube. Tetramethyl silane (TMS) was used as the internal standard and chemical shifts were recorded as δ (ppm) units along with coupling constants (J) in Hz. Using JEOL's DELTA version 5.0.4 software, 1H-NMR and 13C-NMR data were combined. Based on the database of typical NMR absorptions published in Organic Chemistry and a likely proposed structure provided by the NIST library, https://www.nist.gov/nist-research-library, the peaks of the 1H-NMR and 13C-NMR spectra observed were assigned.222.5 In silico prediction and computational analysis
Incensole acetate was identified from the GC/MS analysis of Catharanthus roseus essential oil and verified using the PubChem database (https://pubchem.ncbi.nlm.nih.gov/). Its 3D structure was attained from open-source PubChem (https://pubchem.ncbi.nlm.nih.gov/) in SDF format. The ligand was then transformed into PDB files using the Open Babel software, as designed for this purpose.23 The grid box was positioned surrounding the active site and the final affinity value was determined by averaging the finest positions.24 To visualize the interaction between docked complexes, Discovery Studio 4.0 version (2021 client) was used.
2.6 Toxicity-based screening
The term “in silico toxicity-based screening” in the context of pharmaceutical research refers to the application of computer-based techniques to predict potentially harmful side effects of a drug molecule. These approaches provide details on the toxicity of substances that have been detected.28 In silico approaches may be used to forecast a drug candidate's probable side effects as well as any hazardous effects it might have on specific organ systems. In addition to lowering the price of animal testing, this can aid in accelerating the medication development process. Incensole acetate's toxicity was evaluated using in silico techniques after ADME and drug likeliness analysis, and then the compound's toxicity was explored utilizing the ADMET 2.0 server (https://admetmesh.scbdd.com/).292.7 Molecular dynamics simulation
The dynamics and thermodynamics of biological molecules and their interactions are studied using computational molecular dynamics (MD) simulation methods in a simulated environment. In order to depict the interactions between atoms or molecules, this approach integrates the equations of motion.30 MD simulations may be used to analyze the interactions between drugs and their intended protein targets, determine potential binding sites, and calculate the binding affinities of medications.31 With the ability to predict conformational changes, protein–ligand interactions, the stability of a protein and provide atomic level details of the structural changes occurring within a system, MD simulations can be a useful tool to supplement experimental data. The Desmond module (Schrödinger Release 2020-4) package was used to run an all-atom NTP simulation of the incensole acetate docked complex that was energy-minimized, with a TIP3P water model being used to fill in the empty space.322.8 Preparation of the nanoemulsion
IA-mediated nanoemulsion was prepared following a literature method,33 with adjustments. The nanoemulsion was formulated utilizing a spontaneous emulsification process, which naturally takes place when an organic and aqueous phase are combined and then sonicated. Tween 80 (12.2% v/v) was used to create the nanoemulsion in order to formulate nano-sized droplets and to maintain the stability of the particles. Tween 20 (8% v/v) was used due to the emulsifying properties of this surfactant to prepare an oil in water nanoemulsion. The procedure involved mixing surfactant (Tween 80) and double-distilled water (69.8% v/v) followed by 50 min of stirring to create a homogeneous aqueous phase. Then, the combined mixture of Tween 20 and isolated IA (10% v/v) from EO of C. roseus was dropwise added for 20 min at 8000 rpm using a magnetic stirrer. It was believed that the combination of the self-emulsifying process and sonication can increase nanoemulsion stability. A 20 kHz sonicator (Ultrasonic Processor, GEX 750, USA) with a maximum power output of 750 W was used to sonicate the emulsion for 10 min and the operation was carried out in an ice bath to prevent oil phase deterioration brought on by the sonicator's 150 °C heat output.34 The prepared emulsion was continuously stirred for 4 h at room temperature to ensure the complete removal of solvent and then centrifuged at 4000 rpm. The nanoemulsion was finally filtered through a membrane syringe filter with a pore size of 0.45 μm for removal of impurities and separation of the excess concentration of surfactants and then used for further characterization. As terpene compounds are volatile in nature and light sensitive, the entire preparation of the IA-mediated nanoemulsion was performed in the dark and under controlled temperature conditions.2.9 Entrapment efficacy
The IA-mediated nanoparticles were separated from the produced formulations containing free IA by centrifugation, and the proportion of this isolated component in the emulsified nanoparticles was calculated. The quantity of free chemical in the supernatant was determined using a UV spectrophotometer at 268 nm after centrifuging the emulsion that resulted from solvent evaporation. The difference between the drug (IA compound) utilized in the formulation and the amount of IA in the supernatant was used to calculate the quantity of drug trapped inside the nanoparticles.35 The following is the equation used to determine the percentage entrapment effectiveness:| Entrapment efficacy (%) = actual drug content in nanoparticles/total amount of drug used × 100 |
The EE% assay was performed in triplicate, and values were recorded as the mean ± SD.
2.10 Characterization and stability study of the nanoemulsion
The prepared nanoemulsion storage stability was studied by dynamic light scattering measurements, PDI values and Zeta sizer measurements. These metrics indicate the stability and homogeneity of a nanoemulsion. An ultraviolet/visible (UV) spectrophotometer and Fourier-transform infrared (FTIR) spectroscopy analysis were used to determine the homogeneity of the oil droplets in nanoparticles and a Malvern Zeta sizer was used to determine the size distribution of the nanoemulsion.362.11 Droplet size determination
The size distribution of the augmented formulation was determined by photon correlation spectroscopy using a Delsa Nano C Zetasizer (Zetasizer ZS90, Nanoseries, Malvern, UK). For the purpose of measuring the globule size, the nanoformulation was diluted ten times with double-distilled water and poured into quartz cuvettes with 2 mL of nanoemulsion. Measurements were conducted in triplicate, and the final calculation used the average results. The nanoemulsion's physical stability was determined according to particle charge. Surface charges of the nanoemulsion were determined using a Beckman Coulter Delsa Nano C particle analyzer.372.12 pH, accelerated stability tests and viscosity determination
In a test tube, 9.0 mL of distilled water and 1.5 mL of nanoemulsion were added and homogenized. By placing the electrode directly into the sample, the pH value was calculated using a digital pH meter (Mi 151 Martini Instruments).The nanoemulsions considered stable by preliminary tests were stored under different conditions: 4 ± 3 °C; 25 ± 4 °C (room temperature), and 40 ± 4 °C. The samples were maintained under these conditions for 40 days. Up to 3 mL of fresh nanoemulsion were transferred to a glass tube and transition from a steady state to aggregation and cohesion was studied during the storage period.
The dynamic viscosity was measured using a VR 3000 digital viscometer at 200 rpm at 25 °C without any dilution.38
2.13 UV/visible and FT-IR spectroscopy
An attribute of chemical composition is the wavelength of light that the substance absorbs. The stimulation of electrons (atoms and molecules) to higher energy levels is related to how visible and UV light are absorbed. Using a UV-visible NIR spectrophotometer (Jasco SLM-468, Japan) in absorbance mode with a wavelength of up to 1000 nm, the turbidity of the nanoemulsion was examined.39In transmission mode, the 500 to 4000 cm−1 wavenumber region of the spectrum was examined. A few absorption bands with minuscule variations were visible in the IR spectra. FT-IR spectroscopy was used to evaluate the structures of the nanoformulations (Thermo Nicolet, Madison, WI, USA). Prior to recording the spectra, the samples were mixed with potassium bromide powder in a 100![[thin space (1/6-em)]](https://www.rsc.org/images/entities/char_2009.gif) :
:![[thin space (1/6-em)]](https://www.rsc.org/images/entities/char_2009.gif) 1 ratio and pressed into discs. An FT-IR spectrophotometer was used to record the samples' IR spectra.40
1 ratio and pressed into discs. An FT-IR spectrophotometer was used to record the samples' IR spectra.40
2.14 SEM and EDX spectroscopy
A scanning electron microscope (SEM) was used to examine the shape and structure of IA-based nanoemulsions at various magnifications. This method showed the surface morphology, including the size, structure, homogeneity, and roughness, of the nanoparticles. The samples were prepared via a simple drop coating of prepared formulation on a clean glass, the solvent was allowed to evaporate, and then at room temperature, the coated glass slide was dried and finally analyzed using a high-resolution field emission scanning electron microscope (Nova Nano SEM, Japan). After striking the sample with an electron beam, the sample produced secondary electrons, backscattered electrons and particular X-rays. Samples were photographed by SEM using a high-pressure technique at 20 kV with a working distance at magnification of 5000×.41Energy dispersive X-ray (EDX) spectroscopy is a method of elemental analysis. This method confirms the presence of silver and other basic components. EDX analysis of the sample was determined using an SEM. Samples were made on grids of holey carbon, and the instrument's signals were observed in graphs.42
2.15 Determination of the DPPH antioxidant activity
A DPPH free-radical scavenging assay was conducted to determine the antioxidant activity of the compounds and nanoformulations. Ascorbic acid was used as a standard control and 3 mL of the selected concentration of IA and nanoemulsions with different concentrations (0.25, 0.5 and 1 mg mL−1) were mixed with 5 mL of methanolic DPPH (0.2 mmol L−1) solution. The content was incubated in the dark at room temperature for 30 min. A UV wavelength of 516 nm was used to assess the sample's absorption activity in triplicate. As the proportion of DPPH fell in comparison to the control, the inhibitory activity was determined. The proportion of DPPH that dropped in comparison to the control was used to calculate the inhibitory activity.432.16 MTT cytotoxicity assay
The antiproliferative activity and cell viability of IA and the IA-mediated nanoemulsions was determined using the MTT (3-(4,5-dimethylthiazol-2-yl)-2,5-diphenyltetrazolium bromide) assay. The MDA-MB-231 breast cell line and HMEpC healthy epithelial cells were obtained from the Institute of Molecular Biology and Biotechnology Department at The University of Lahore. Cancer cells were injected into microtiter plate wells at a density of 6 × 10³ and the medium used was 100 μL cells per well. To aid in the cell adhesion, the plate was then incubated in a CO2 incubator for an additional night. To each well containing cells, test complexes (IA and different concentrations of nanoemulsion) were added separately. For 72 h at 37 °C, the plates were kept incubated. Each well received 20 μL of MTT reagent and then re-incubated after 4 h. The plates were then scanned using a traditional ELISA microplate reader at wavelengths of 570 and 620 nm.44 The results were obtained to determine how the test complexes affected the viability of cells and the ability to stop cancer cell growth. The optical density (OD) determined from the MTT experiment was used to quantify the percentage of growth inhibition.452.17 Crystal violet assay
The cell viability of the MDA-MB-231 cancer cell line and HMEpC cells and the maximum cytotoxicity concentration of IA and the nanoemulsion prepared from IA was determined by using a crystal violet staining method by adopting a recognized protocol.46 The 96-well plate used for this method was washed with PBS after the medium from each experimental group was removed. After cleaning, 2% ethanol and 0.1% crystal violet dye were added to the wells. At room temperature, incubation was carried out for 15 min. To stop cells from rising out of the well, wells were properly cleansed and the dye was disposed. After that, the stain was solubilized by adding 200 μL of 1% SDS to each well and the absorbance was measured at 540 nm on a microtiter plate.2.18 Animal experimental design
Female adult SD rats (weighing 150–170 g), obtained from the laboratory animal center of the Institute of Molecular Biology and Biotechnology, University of Lahore, were used in this experimental study. Institutional animal ethics for control and supervision of experimental animals' regulations were followed strictly. The rats were kept in a controlled environment with a 12 h light/dark cycle, humidity of 50% and temperature of 24–27 °C. Rats were randomly assigned to control and experimental groups (7 rats in each group) after acclimatizing for a set number of days. Each group had its own identity and was housed in a separate cage. DMBA (7,12-dimethylbenz[a]anthracene) manufactured by Macklin (China, product number D807576-100 mg), was used for breast cancer induction in rats. Rats were divided into six distinct groups at random after a week of acclimatization. Rats in the vehicle group received neither DMBA exposure nor nanoemulsion treatment; those in the positive control group received only a 50 mg per kg dose of the nanoemulsion; those in the DMBA group received a 25 mg per kg dose of DMBA without receiving IA or nanoemulsion treatment; those in the IA treated group, received a 25 mg per kg dose of DMBA and a 25 mg per kg dose of IA; those in the nanoemulsion treatment group were treated with nanoemulsion at 50 mg kg−1 after DMBA administration; rats in the EO group were exposed to 25 mg per kg DMBA and were treated with 20 mg kg−1 of EO.Breast cancer was induced and tumor palpation was observed in the DMBA-administered animals after 4–5 weeks of administration of a single dose of DMBA injected intraperitonially in the mammary glands. After tumor induction given intragastric EO, IA and nanoemulsion treatment for 4 weeks was carried out on every alternate day in the morning at a particular time. Blood samples were collected from the heart via cardiac puncture using a sterile syringe and needle. The whole blood sample was divided into two fractions, one fraction was put into plain sample tubes while the second fraction containing whole blood cells was put into EDTA sample collection tubes. For serum collection, blood was centrifuged at 3000 rpm to separate serum and plasma. Following centrifugation, the serum samples were stored at −20 °C for stress marker and cytokine cancer marker analysis. The blood samples collected to the EDTA bottles were shaken gently to mix them with anticoagulant and prevent them from cell hemolysis. The hematological and biochemical analyses were carried out as soon as the blood samples were collected.
2.19 Measurement of tumor volume and tumor ratio
The tumor growth rate in all the experimental groups after administration of DMBA in the rats was monitored and then treatment was initiated with IA and the nanoemulsion in the respective groups for 5 weeks. The weight of the animals and tumor size were regularly measured. The tumor size was measured using a Vernier caliper to analyze the tumor growth rate, and the tumor volume and data are presented as the mean ± S.E.47 Rats were checked for palpable tumors and the tumor volume was recorded using length and width diameters by employing the following formula:| Tumor volume (mm3) = [(W2 × L)]/2 |
The tumor growth ratio (V/V0) can be calculated from the final tumor size of the treated group divided by the initial tumor growth at the baseline (before starting treatment).48
2.20 Biochemical analysis
A hematological auto-analyzer (Abacus 380) was used to measure the levels of hematological indices, including hemoglobin (Hb), red blood cells (RBC), platelets, monocytes, lymphocytes, and white blood cell (WBC) count. Each sample that was collected underwent serum biochemistry analysis. Concentrations of aspartate transaminase (AST), alanine transaminase (ALT), alkaline phosphatase (ALP), total protein, and albumin were measured in liver function tests for analysis. Utilizing an auto-analyzer (the Cobas C111 Chemistry analyzer), electrolytes (sodium, potassium, chloride, and bicarbonate ions), creatinine and urea were measured in order to evaluate the in vivo toxicity study of the kidney function tests.2.21 Oxidative markers (CAT, GPx, SOD, GSH) analysis
Glutathione reductase, superoxide dismutase, glutathione per oxidase and catalase were assessed from collected serum samples of tested compound IA and nanoemulsion treated rats as indicators of oxidative stress in DMBA cancer-induced animals using ELISA kits in accordance with established protocols.49The Aebi (1974) approach was used to determine the presence of catalase. First, 50 μL of 10% homogenate was poured into a container, to which 1.95 mL of potassium phosphate buffer (pH 7.0) and 1 mL of 30 mM H2O2 were added.50 The absorbance was measured at 240 nm after 30 s and again after a 15 s delay.51
Glutathione peroxidase activity was determined by Paglia and Valentine. GPx catalyzed the reduction of hydrogen peroxide, oxidizing the reduced glutathione to form oxidized glutathione, and NADPH oxidation caused the decrease in absorbance at 340 nm, which could be measured spectrophotometrically.52
A superoxide dismutase (SOD) test kit-WST was used to measure the total SOD activity (Sigma-Aldrich, Switzerland). Spectrophotometric analysis at 450 nm was used to determine the WST-1 formazan dye. Assay was accomplished as per the manufacturer's protocol and a microplate reader was used to read the absorbance after the plate had been incubated for 20 min at 37 °C.53
Following the method of Sedlak and Lindsay (1968), the GSH level was measured by precipitating a 10% tissue homogenate with 50% trichloroacetic acid and centrifuging the sample for 5 min at 1000 rpm. Thereafter, 0.5 mL of the supernatant was added to 2 mL of Tris–EDTA and mixed with 0.1 mL of 5,5-dithio-bis-(2-nitrobenzoic acid) (DTNB) compound. The reaction mixture was measured at 412 nm absorbance.54
2.22 Determination of inflammatory markers (IL-1, IL-6, IL-23 and TNF-α)
In all the experimental groups, cytokine markers and interleukins (IL-1, IL-6, IL-23 and TNF-α) were measured in the samples by using ELISA kits according to the manufacturer's instructions. To quantify IL-1, IL-6, IL-23 and TNF-α, ELISA was performed using Ready-SET-BT Lab Kits (IL-1, E0107Ra; IL-6, E0684; IL-23, E0125Ra; TNF-α, E0764Ra) as per the manufacturer's instructions. Standard solutions, specified antibodies, and control and test samples were applied to each pre-coated plate. The manufacturer's instructions were followed for all operations, including plate washing, and addition of antibodies, substrates and stop solution.552.23 Cell apoptosis assay
Following the manufacturer's instructions, standard kits were used to assess the apoptotic activity of the breast cancer samples of rats. Apoptotic cells were subsequently stained with Annexin VFITC/PI Kit Cat. No. E0457Ra and the results were assessed using ELISA analysis. Then, 50 μL of standard solution was added to the well and 40 μL of sample was poured into the sample wells followed by 10 μL of anti-ANX-5 antibody in the wells. Subsequently, 50 μL of substrate solution A was added to each well, followed by 50 μL of substrate solution B. After the addition of stop solution, there was a waiting period of 10 min before measuring the optical density of each well using a microplate reader set to 450 nm analysis.562.24 Analyses of histopathological changes
Mammary tumor specimens were taken from slaughtered animals at the end of study and fixed in buffered formalin before being cleaned, then fixed for 24 h at room temperature with 4% paraformaldehyde. Sections of the fixed tissue (5 mm thick) were cut and embedded in paraffin. After being stained with hematoxylin for 10 min, the slices were rinsed with tap water. The slices were then sealed with neutral glue and images were captured by digital camera using an optical microscope.57The liver and kidneys were also taken out of the experimental animals to determine the histopathological changes caused by IA and the synthesized nanoemulsion on such vital organs. Liver and kidney specimens were fixed in 10% buffered formalin, and then processed for histological analysis. Hematoxylin and eosin staining was performed, tissues were mounted with DPX mountant on glass slides, and microscopic analysis of tissues embedded in paraffin wax was performed on histological sections cut at a thickness of 5 μm. Photomicrographs of particular slides selected for study were taken by a digital camera mounted on an optical microscope.
2.25 Statistical analysis
The levels of analysis in each experiment were contrasted with the vehicle control group and the DMBA-induced group (left untreated). For statistical analysis, SPSS statistics software version 25 (SPSS Inc., USA) and graph pad prism program version 9.5.1 were utilized. ANOVA, followed by Dunnett analysis, was used to examine differences between the means of each sample. p values of 0.05, 0.001 and 0.0001 were used to determine statistical significance.3. Results
3.1 GC-MS of C. roseus essential oil
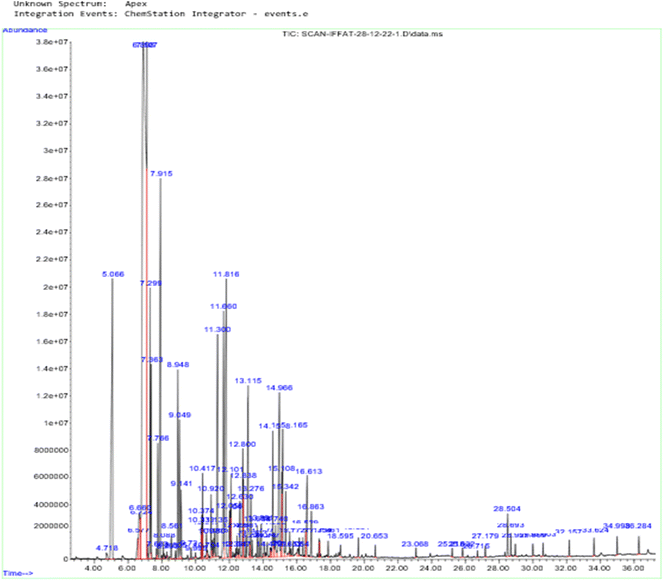
Essential oils are complex combinations of volatile chemical molecules that are produced by plants as secondary metabolites. The essential oil's content was measured at 6.41 ± 0.21%, which demonstrates that a significant amount of the plant's essential oil is extracted using hydro distillation from C. roseus.A GC/MS chromatogram of the analysis of the chemical constituents of C. roseus essential oil produced by HD methods (A method in which plant materials are boiled in solvent and vapors are condensed to collect droplets) is shown in Fig. 2 (percentage compositional data are given in Table T1 in the ESI†). IA was isolated by silica gel column chromatography and thin-layer chromatography. The calculated RT (time taken for a solute to pass through a chromatography column) of IA is 28.69, the calculated RI (retention index of compound is retention time interpolated between adjacent n-alkanes) is 2173, and the literature cited RI is 2195.58 IA isolation was previously reported in Boswellia resin essential oil.59
3.2 IR spectrum analysis
The IR spectrum of IA indicates the presence of sp2 hybridized carbon, and the presence of carbonyl carbon was indicated by the appearance of a stretching frequency at 1643 cm−1. The presence of unsaturated bonds was indicated by the presence of signal at 1436 cm−1, while a C–O band appeared at 1376 cm−1. Stretching corresponding to sp3 hybridized C–C–H was also very prominent in the spectrum, indicating the sample compound to be a hydrocarbon with some degree of unsaturation (Fig. S1 in the ESI†).3.3 NMR spectroscopy analysis
NMR spectroscopy analysis uses proton (1H) and carbon (13C) NMR to integrate and assign each proton and carbon to the observed compound. 34 total proton resonances were observed during the 1H-NMR observation, and the hypothesized chemical structure is based on the splitting pattern. The 1H-NMR spectrum of IA indicates the presence of six methyl groups; two methyl groups appeared as a broad singlet at 1.66 ppm of six-proton integration and two more methyl groups appeared as a singlet at 1.74 ppm, with a more downfield signal of four-proton integration appearing at 4.71 ppm, corresponding to a methyl group and a proton. The downfield protons were attributed to the attachment of a methyl group to a highly electronegative atom. Two olefinic protons were also observed, which appeared as a doublet of doublets (J = 0.84, 2.66 Hz) at 5.41 ppm. Another methyl group appeared as a multiplet at 1.87–1.96 ppm. Alongside these protons, the 1H-NMR spectrum also indicated the presence of 16 protons that appeared as two sets of doublets at 1.46 and 1.51 ppm. Two more protons appeared as two sets of doublets of double doublets at 1.80 and 1.82 ppm, with the splitting pattern of these protons indicating them to be diastereotopic protons next to a chiral center. Two protons appeared as multiplets at 1.97–1.98 ppm, with eight more protons appearing as a multiplet at 2.02–2.14 ppm (Fig. S2 in the ESI†).C bond signal was allocated to the proposed chemical structure of the compound in terms of its 13C-NMR characteristic absorptions as reported in the spectroscopic identification (Fig. S3 in the ESI†). A total of 22 carbon resonates were observed in the carbon spectrum of compound terpene II. 13C-NMR indicated the presence of six types of aliphatic carbons at 20.7, 23.4, 27.9, 30.6, 30.8 and 40.1 ppm, two doublet carbons at 108.4 ppm, two singlet olefinic carbons at 120 and 133 ppm, and a singlet carbon at 149.9 ppm corresponding to the carbonyl group attached to an electron donating group. The LC ESI MS of the sample indicated the appearance of a molecular ion peak at 348 amu and a loss of 43 amu corresponding to the loss of an acetyl group. From this spectroscopic and spectrometric data, the compound was identified as IA, with a molecular weight of 334 g mol−1. The compound eluted at 28.693 min in the GC/MS analysis of C. roseus essential oil.
3.4 Molecular docking results
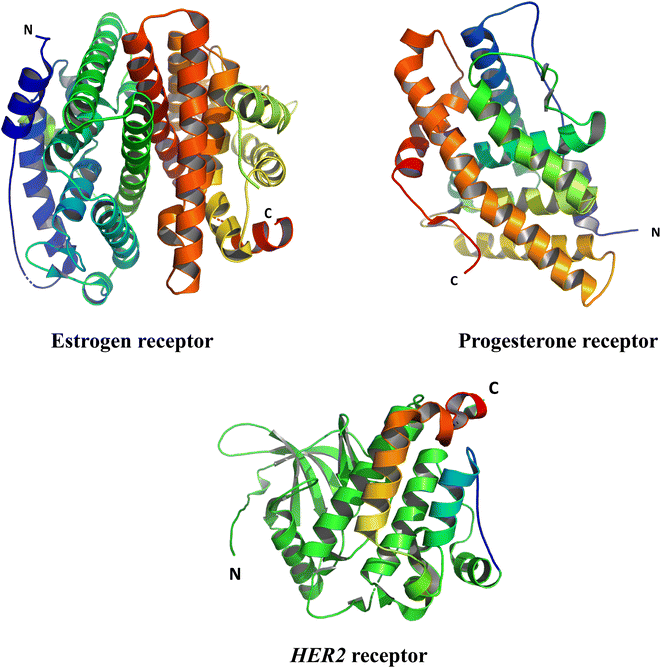
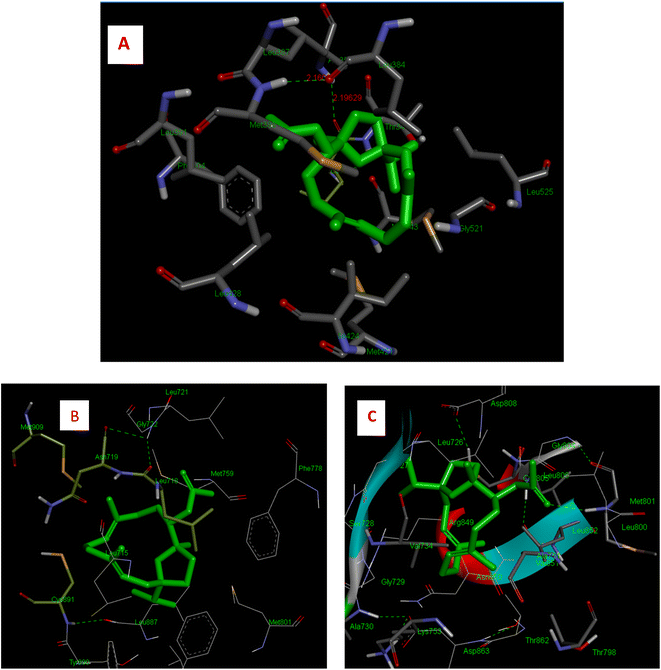
To better understand how IA interacts with breast cancer receptors, docking studies were performed with the modeled 3D structures of ER, PR, and HER2, and the results are shown in Table 1. The free binding energy and hydrogen bonding molecules were observed clearly, and the negative least free energy value of binding demonstrates a strong favorable bond between estrogen and the HER2 receptor with IA in the most favorable conformations.| Target | Van Der Waals interactions | No. of H bonds | H-bond length (Å) | Hydrogen bond residues | Pi–pi interactions | Docking score (kcal mol−1) |
|---|---|---|---|---|---|---|
| Estrogen receptor | LEU 384, MET 388, PHE 404, GLY 521 | 3 | 2.196 | ALA 354 | — | −8.0 |
| 2.160 | MET 388 | |||||
| 2.178 | LEU 375 | |||||
| Progesterone receptor | MET 759 | 3 | 1.91 | GLY 722 | ASN 719, MET 909 LEU 718 | −4.6 |
| LEU 887 | 2.46 | GLY 724 | ||||
| TYR 890 | 2.08 | CYS 891 | ||||
| HER2 receptor | THR 862 | 4 | 1.797 | ALA 730 | VAL 734 | −3.4 |
| MET 801 | 1.746 | LYS 853 | ||||
| ASP 863 | 2.058 | LEU 806 | ||||
| LEU 800 | GLY 804 |
IA showed better interaction with the ER protein with a docking score of −8.0 kcal mol−1, with the intermolecular interactions at residues LEU 346, ALA 350, MET 388, PHE 404 and hydrogen bond interactions with ALA 354, LEU 375 and MET 388. The Van dDer Waals interactions were observed at residues LEU 384, MET 388, PHE 404, and GLY 521. Interactions with progesterone protein showed that IA has a docking score of −4.6 kcal mol−1 as well as Van Der Waals interactions with amino acid residues, MET 759, LEU 887 and TYR 890 and hydrogen bonding at residues GLY 722 and CYS 891. A pi–pi interaction was observed at amino acid residues ASN 719, MET 909 and LEU 718. Similarly, the docking results of the IR-HER2 complex showed hydrogen bonding interactions with the amino acid residues GLY 804, ASP 863, LYS 853 and ALA 730, with a binding score of energy of −3.4 kcal mol−1, as well as pi–pi interactions with VAL734. Moreover, van der Waals interactions were observed with the amino acid residues THR 862, MET 801, ASP 863 and LEU 800. The 3D interaction of IA with BC targets is shown in Fig. 3 and a ligplot representation is shown in Fig. 4. From the binding affinity score, it was observed that IA docked fine with ER with a high binding energy value of −8.0 kcal mol−1 with three hydrogen and multiple hydrophobic interactions.
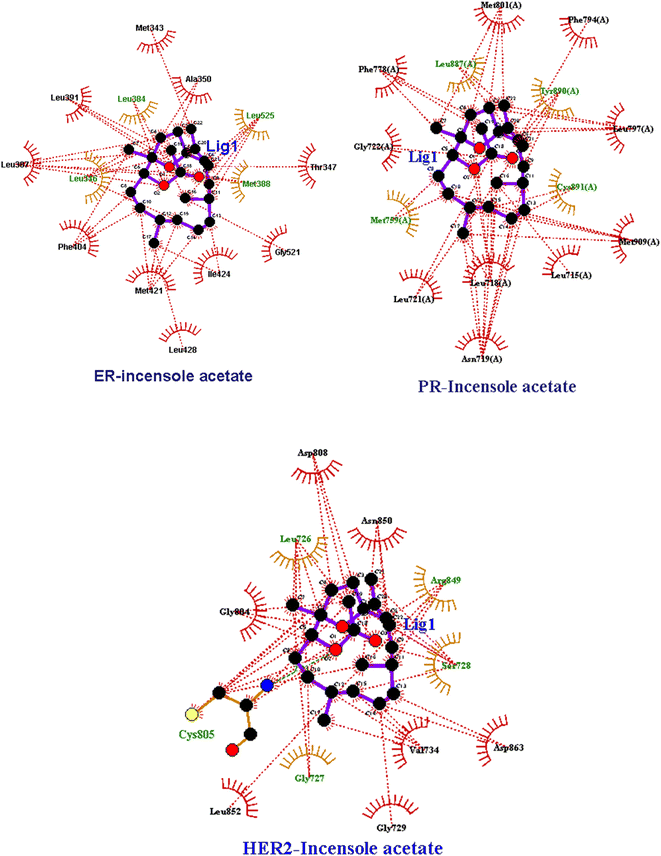 | ||
| Fig. 4 Two-dimensional LigPlot+ representation of IA with the amino acid residues of receptor proteins. | ||
3.5 ADME analysis
Eleven rotatable bonds, seven H-bond donors, and twelve H-bond acceptors were discovered to be present in the molecular structure of IA. The molecule received high marks, with a synthetic accessibility value of 5.33, and the ligand showed substantial gastrointestinal absorption as well as blood–brain barrier permeability. The IA ligands were initially screened using Lipinski's rule of five, PAINS, and gastrointestinal retention characteristics, a standard criterion for assessing drug-likeness. For additional testing, a drug that met Lipinski's rule of five, had significant gastrointestinal retention, and displayed no PAINS signals was employed. The ADME parameters of IA are shown in Table 2.| ADME parameter | ADME score/prediction |
|---|---|
| Molecular weight | 348.27 g mol−1 |
| nHet | 3 |
| Fraction C sp3 | 0.773 |
| TPSA | 35.53 |
| iLOGP | 4.999 |
| LOGS | −5.431 |
| HIA | 0.012 |
| PPB | 96.09% |
| GI absorption | High |
| BBB penetration | 0.299 |
| Pgp substrate | 0.003 |
| CYP1A2 inhibitor | 0.054 |
| CYP3A4 inhibitor | 0.568 |
| Lipinski violations | 1 |
| CYP2C19 inhibitor | 0.155 |
| Bioavailability score | 0.55 |
| PAINS alerts | 0 |
| Lead likeness violations | 0 |
3.6 Toxicity screening analysis
The toxicity profile of IA was evaluated by performing the ADME study. IA was used to estimate the toxicity profile using the docking score with the ER receptor as the anticancer target (PDB ID 2Iok). IA showed no evidence of potential for tumorigenesis, mutagenesis activity, or reproductive consequences, however, it did demonstrate moderate irritating qualities (Table 3).| Toxicity parameter | Prediction value | Outcome |
|---|---|---|
| a Mutagenic potential of chemical compound (AMES), human hepatotoxicity (H-HT), drug-induced liver injury (DILI), FDA maximum recommended daily dose (FDAMDD). | ||
| hERG blockers | 0.007 | Active blocker |
| AMES toxicity | 0.006 | Moderately toxic |
| H-HT | 0.285 | Moderately toxic |
| Rat oral acute toxicity | 0.001 | Highly toxic |
| DILI | 0.358 | Mild toxic |
| FDAMDD | 0.078 | Positive |
| Mutagenic | 0 alert | No risk |
| Tumorigenic | 0 alert | No risk |
| Reproductive effects | 0 alert | No risk |
| Skin sensitization | 0.948 | Sensitizer |
| Carcinogenicity | 0.033 | Mild carcinogenic |
| Respiratory toxicity | 0.014 | Mild toxic |
| Eye corrosion | 0.006 | Non corrosive |
| Eye irritation | 0.095 | Mild irritant |
3.7 Molecular dynamics simulations
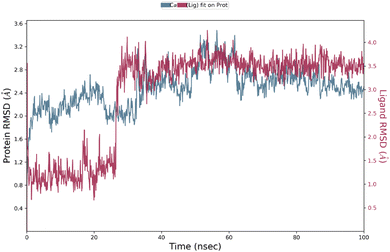
Understanding the relationship between protein structure dynamics and the atomic-level residues of a ligand is greatly facilitated by MD simulation studies.60 Following the virtual screening of phytocompounds, MD simulations at nanosecond time scales were used to assess compound stability and receptor flexibility. | ||
| Fig. 6 Residue-wise RMSF of IA with respect to target ER (blue color) and atom-wise RMSF of protein (red color). | ||
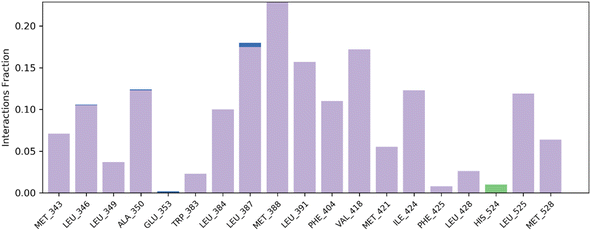 | ||
| Fig. 7 Histogram summary of contacts between protein–ligand interaction during the MD simulation that occur at >30.0% of the simulation run time. | ||
3.8 Nanoemulsion characterization
3.9 Size, zeta potential and viscosity analysis
The size distribution of IA-based nanoparticles appeared to be polydisperse and exhibit nanoparticle sizes. It was possible to see the average distinctive peak at 263.8 nm (Fig. S8 in the ESI†). The PDI of the nanoemulsion was observed as 0.460, with an average range of around 0.3 to 0.5, showing the homogeneity of the particles. The zeta potential of is the nanoemulsion shifted to −23.8 (mV) with a single significant peak of 100% area, zeta deviation of 4.51 (mV), and a conductivity of 0.0160 (mS cm−1) (Fig. S9 in the ESI†). Table 4 shows the viscosity and pH of the nanoemulsion after formulation and at different time intervals to determine the stability and nature of the prepared formulation.| Days | Viscosity (mPa s) ± SD | pH ± SD |
|---|---|---|
| Day 1 | 2.01 ± 0.11 | 6.34 ± 0.04 |
| After 14 days | 2.14 ± 0.11 | 6.36 ± 0.01 |
| After 28 days | 2.15 ± 0.21 | 6.33 ± 0.04 |
| After 40 days | 2.23 ± 0.20 | 6.30 ± 0.02 |
3.10 UV and FTIR analysis
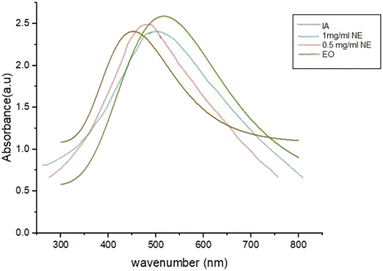
The UV-visible spectra of IA, the IA-containing nanoemulsion and EO exhibit broad absorption peaks, and, at the same time, shifted absorption to longer wavelengths and a substantial drop in absorption intensity were observed when the concentration of the nanoparticles was reduced in the sample. IA in pure form showed an absorbance of 2.63 at the wavelength with the largest peak, which was 536.79 nm.The sharp maximum absorption peaks of the nanoemulsion concentrations at 487 nm and 513 nm were indicative of the presence of spherical-shaped nanoparticles (Fig. 9). The wavelength of the nanoparticles was observed to fall within the necessary range, proving that nanoparticles were produced. Physical analysis revealed that the isolated nanoparticle-containing natural compounds remained stable in solution for 4–6 weeks following their production.
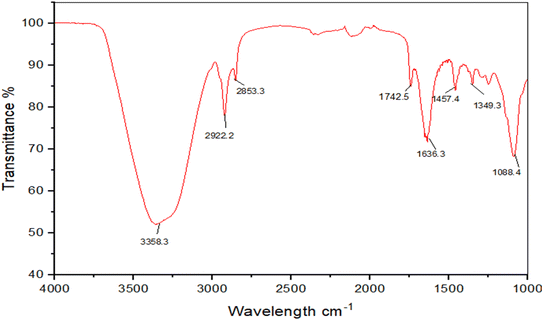
The FTIR spectroscopic analysis of the nanoemulsion made from the isolated compound IA was used to identify the potential functional groups that were likely responsible for the reduction of different ions present in the formulation. The nanoemulsion showed a number of distinctive absorption bands at 3358.3 cm−1, 2922.2 cm−1, 2853.3 cm−1, 1742.5 cm-,1 1636.3 cm−1,1457.4 cm−1,1349.3 cm−1, and 1088.4 cm−1 (Fig. 10). The vibrational peak at around 3358.3 cm−1 was assigned to O–H possibly derived from carbohydrate or phenolics. The peak at 2922.2 cm−1 was ascribed to the C–H of an alkyl group, the peak at 1636.3 cm−1 was indicative of a C![[double bond, length as m-dash]](https://www.rsc.org/images/entities/char_e001.gif) O of a carboxyl group or esters and the peak at 1088 cm−1 is likely due to C–O from phenols. The tentative assignment of the peaks was supported by published literature reports.
O of a carboxyl group or esters and the peak at 1088 cm−1 is likely due to C–O from phenols. The tentative assignment of the peaks was supported by published literature reports.
3.11 SEM and EDX analysis
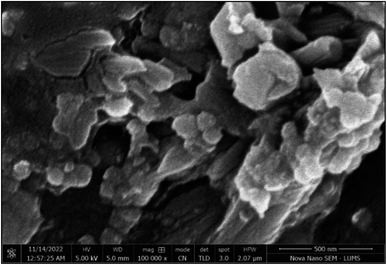
The IA-mediated nanoemulsion sample was subjected to SEM analysis to determine its particle shape and size (Fig. 11). The findings revealed that the freshly generated nanoparticles were nanosized, with a typical average size range of between 170 nm and 275 nm. The image identifies that the nanoemulsion particles have a non-spherical, slightly clustered structure due to the molecular weight of the IA compound and the presence of an isoprene ring. The growth of particles may be due to the coalescence of the nanoparticle droplets at some stage in the formulation process as a result of the nature of the emulsifying agents used, as supported by previous studies.33An EDX study was carried out to explore the elemental composition of the nanoparticles. Typical peaks were recorded at approximately apparent concentrations of 29.23, 21.55, 1.49, 11.15 and 1.2% (Fig. S10 in the ESI†). The spectral signals of carbon (C) and sulphur (S) also revealed the presence of molecules that were adsorbed on the nanoparticles. Weak peaks for Zn and intense peaks were also present for carbon and oxygen.
3.12 Antioxidant activity (DPPH assay)
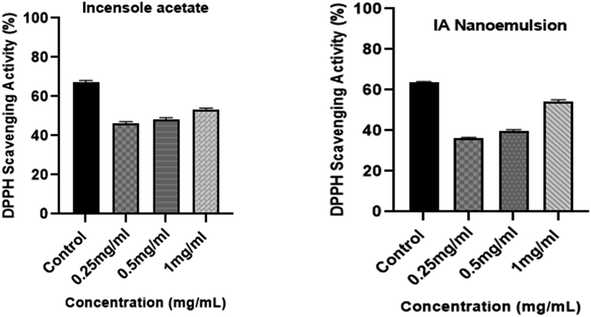
The DPPH technique was used to assess the in vitro antioxidant activity of IA and its nanoemulsion at various concentrations (Fig. 12). First, 5 mL of methanolic solution (containing 0.2 mM of DPPH radicals) were combined with IA and different concentrations of IA-mediated nanoemulsion. The average antioxidant activity of IA was greater than that of the nanoemulsion formulation. A dose-dependent increase in the DPPH activity of the nanoemulsion was observed and the maximum DPPH activity was observed with the highest 1 mg mL−1 concentration of nanoemulsion at 54.29%. At a concentration in the range of 0.25–1 mg mL−1, IA showed a scavenging activity of 46% to 53% and the nanoemulsions showed a scavenging activity of 43% to 55% with an average IC50 value of 0.67 ± 0.05, but it was observed that the maximum observed antioxidant activity of the nanoemulsion was lower than that of standard ascorbic acid, at around 64%. At all the studied concentrations, 1 mg mL−1 of nanoemulsion exhibited significantly higher DPPH radical scavenging activity than those recorded for IA and the other NE concentrations (p < 0.05).3.13 Cytotoxicity assay
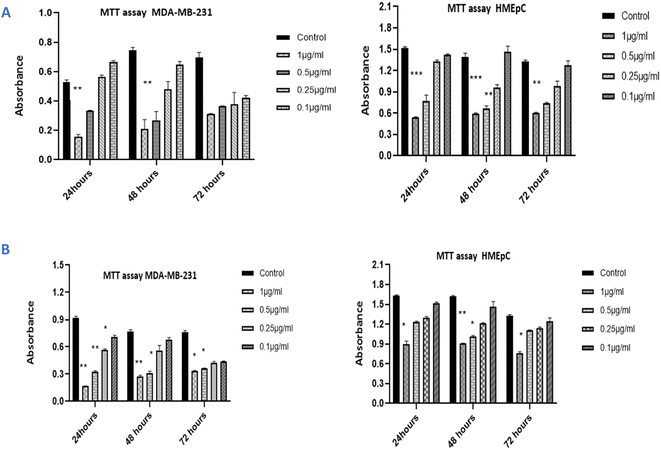
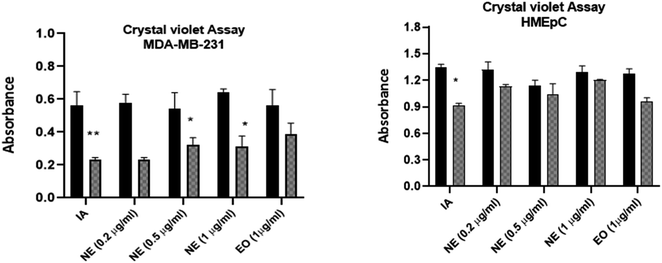
The cytotoxicity of IA and the nanoemulsions were investigated with different concentrations of the test samples (0.10 μg mL−1, 0.25 μg mL−1, 0.5 μg mL−1 and 1 μg mL−1) over various time periods. The antiproliferative effect depends on the time duration and concentration of nanoemulsions used against the MDA-MB-231 cancer cell line and HMEpC healthy epithelial cells. A very significant p value of 0.0001 indicated that unpackaged IA is more harmful than the nanoparticle formulations when compared to 58.7% viability with nanoemulsions at a dose of 1.0 μg mL−1 when cells were treated with IA. Notably, 0.5 μg mL−1 of pure IA showed significant cytotoxicity, with p < 0.001, whereas for 0.25 μg mL−1, the observed cytotoxicity was reduced (p > 0.05) (Fig. 13A). The nanoemulsion reduces the viability of cancer cells, but significant cytotoxicity was observed for the 1 μg mL−1 (p < 0.001) and with 0.5 μg mL−1 (p < 0.05) concentrations as compared to untreated MDA-MB-231 cells (Fig. 13B). The maximal IC50 concentration of the nanoemulsion was 1 μg mL−1, and the observed inhibition rate at 24 and 48 h was >50%. The cytotoxicity increased as the concentration of the nanoemulsion increased. In comparison, the HMEpC healthy cell lines did not show any significant effect on cell growth and viability, except for the nanoemulsion with 1 μg mL−1, where p < 0.001.MDA-MB-231 cells in crystal violet assay (live cells detection) treated with IA and nanoemulsion concentrations showed fewer live cells compared to the viability of HMEpC cells (Fig. 14). IA showed significant absorption (p = 0.0013) compared to untreated MDA-MB-231 cells, while nanoemulsion concentration (0.2, 0.5, 1 1.0 μg mL−1) also showed cytotoxicity (p < 0.05) toward cancer cells. The cell viability of HMEpC healthy cells was observed to be p = 0.028 when treated with IA and p = 0.052 (insignificant) with nanoemulsion concentrations compared to control untreated cells.
3.14 Effect of IA and nanoemulsion on tumor volume
The effects of IA and the IA-mediated nanoemulsion were observed on tumor features (Table 5). Tumor incidence was highest in DMBA control group rats compared to the vehicle control group (p < 0.0001) that was not further treated using the nanoformulation. A decrease in the tumor incidence was observed in the IA-treated group (0.0024) and the nanoemulsion-treated group (p < 0.001).| Parameter | Vehicle control | Nanoemulsion control | DMBA | DMBA + IA | DMBA + NE | DMBA + EO |
|---|---|---|---|---|---|---|
| Tumor volume mm3 (pre-treatment) | 0 | 0 | 8.339 | 8.27 | 8.286 | 9.108 |
| Tumor volume mm3 (post-treatment) | 0 | 0 | 10.36 | 6.647 | 5.435 | 7.012 |
| Tumor ratio | 0 | 0 | 1.24 | 0.80 | 0.65 | 0.769 |
Similarly, the tumor volume decreased significantly (p = 0.001) with IA treatment compared to the DMBA control group (Fig. 15). The tumor size was the highest in the DMBA control group, whereas in the nanoemulsion-treated groups, the decrease in tumor size was evident significantly, with a p value of 0.0034.
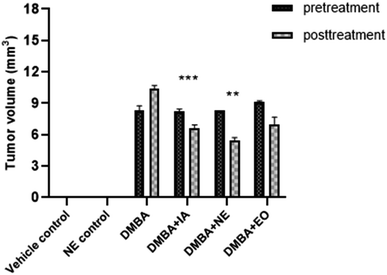 | ||
| Fig. 15 Pretreatment and posttreatment tumor volume. Means with *(p < 0.05), **(p < 0.001), and ***(p < 0.0001) are statistically significant compared to the control and DMBA control groups. | ||
3.15 Hematological analysis
Hematological analysis after 4 weeks of administration of IA and nanoemulsion treatment on control and DMBA-induced rats showed some changes in the blood profiles of the experimental animals. Elevated levels of platelets, WBCs and RBCs were detected in the DMBA group (not treated with the nanoemulsion) compared to the control group, whereas, reduction in WBCs (p < 0.001) in the nanoemulsion-treated group was noted. A significant increase in the number of WBCs (p < 0.001) was observed in the DMBA group compared to the normal group. RBCs and hemoglobin (HB) were reduced significantly (p < 0.001) due to the administration of the synthesized nanoemulsion in the cancer-induced rats compared to the DMBA group. The hemoglobin level was reduced in the IA-treated group, but this was not statistically significant. IA improved the WBC count (p < 0.05) and platelet count (p < 0.001) compared to those of the DMBA-induced untreated group. Neutrophils and monocytes were increased in the IA terpene treated group and the nanoemulsion treated group compared to the control (p < 0 0.001). It was noted that the IA-mediated nanoemulsion has substantial effects on WBCs, TLC and platelet profile of the DMBA cancer-induced rats (Table 6).| Parameter | Vehicle control | Nanoemulsion control | DMBA control | DMBA + IA | DMBA + NE | DMBA + EO |
|---|---|---|---|---|---|---|
| a The results represent the mean ± standard deviation of the group results obtained (n = 7). Means having *(p < 0.05), **(p < 0.001), ***(p < 0.0001) are statistically significant compared with the control group and DMBA control group (RBCs = red blood cells, WBCs = white blood cells, TLC = total leukocyte count, and HB = hemoglobin). | ||||||
| RBCs (×106/μL) | 7.64 ± 0.05 | 8.42 ± 0.08 | 10.83 ± 0.13 | 7.82 ± 0.11 | 9.32 ± 0.54 | 10.43 ± 0.33 |
| WBCs (×103/μL) | 11.25 ± 0.25 | 13.21 ± 0.41 | 16.44 ± 0.22** | 12.76 ± 0.43* | 11.21 ± 0.11** | 13.76 ± 0.77 |
| Platelets (×103/μL) | 934.00 ± 13.01 | 1233 ± 14.8 | 1743 ± 12.8 | 1487 ± 10.9** | 1287 ± 12.9* | 1598 ± 13.98 |
| TLC (×103/μL) | 8.77 ± 0.16 | 7.97 ± 0.14 | 13.44 ± 0.81 | 13.22 ± 0.17 | 12.87 ± 0.19 | 14.65 ± 0.17** |
| Hb (g dL−1) | 13.72 ± 0.31 | 15.0 ± 0.21 | 18.5 ± 0.22** | 14.9 ± 0.13 | 14.1 ± 0.18 | 17.5 ± 0.71 |
| Neutrophils (%) | 26.50 ± 2.12 | 30.1 ± 2.11 | 33 ± 2.42** | 31 ± 2.31 | 34 ± 2.32 | 28 ± 2.16 |
| Monocytes (%) | 2.17 ± 0.22 | 3.11 ± 0.12 | 4.5 ± 0.42 | 4.1 ± 0.54 | 4 ± 0.16 | 3.76 ± 0.91* |
3.16 In vivo toxicology analysis
When compared to the normal control, the DMBA-induced cancer-induced rats' levels of urea and creatinine were clearly higher (p < 0.05). The groups treated with IA and NE exhibited a notable rise. Serum creatinine is a significant predictor of renal health and is a result of the metabolism of biomolecules. According to statistical analysis, DMBA induction caused increases in the urea and creatinine levels, and treatment with IA considerably (p < 0.001) raised the urea levels in comparison to the normal control group. The increase in urea levels brought on by DMBA was considerably (p < 0.001) reduced by nanoemulsion administration. The elevation of creatinine levels in all the groups shows that more creatinine was retained in the blood of all the DMBA-administered rats. ANOVA analysis showed that treatment with IA reduced creatinine levels as compared to the DMBA control animals, but this difference was insignificant. Similarly, treatment with the nanoemulsion significantly (p < 0.05) inhibited the DMBA-induced increase in creatinine levels. The balance of electrolytes (sodium, potassium, chloride, and bicarbonate) in the blood is a reliable sign of how effectively the kidneys are working. The results showed that in comparison to the vehicle control group, the DMBA cancer-induced rats have raised sodium and potassium levels (statistically insignificant), while the EO treated group have significantly increased sodium levels (p < 0.0010). However, nanoemulsion administration significantly (p < 0.05) reduced the DMBA-induced rise in the chloride ion levels compared to the vehicle control group (Table 7).| Group | Urea mmol L−1 | Creatinine mmol L−1 | Na+ mmol L−1 | K+ mmol L−1 | Cl− mmol L−1 | HCO3− mmol L−1 |
|---|---|---|---|---|---|---|
| a The results represent the mean ± standard deviation of group results obtained (n = 7). Means having *(p < 0.05), **(p < 0.001), ***(p < 0.0001) are statistically significant compared with the control group and DMBA control group (Na+ = sodium, K+ = potassium, Cl− = chloride, HCO3− = bicarbonate). | ||||||
| Vehicle control | 6.23 ± 1.53 | 61.77 ± 2.41 | 139.70 ± 2.06 | 4.43 ± 0.26 | 104.75 ± 1.26 | 24.50 ± 1.29 |
| Nanoemulsion control | 6.81 ± 0.78 | 64.33 ± 3.21 | 146.1 ± 2.4 | 4.76 ± 0.31 | 113.43 ± 1.42* | 27.22 ± 1.14 |
| DMBAcontrol | 9.14 ± 0.47* | 81.0 ± 4.12* | 151.5 ± 2.3 | 6.73 ± 0.52 | 95.43 ± 1.12* | 35.65 ± 1.16** |
| DMBA + IA | 8.13 ± 0.98 | 67.21 ± 2.11 | 148.5 ± 1.9* | 6.13 ± 0.41** | 107.43 ± 1.51 | 28.03 ± 1.11 |
| DMBA + NE | 6.11 ± 1.31** | 64.3 ± 2.61* | 143.9 ± 2.6 | 5.51 ± 0.22 | 97.2 ± 0.98* | 34.97 ± 1.17* |
| DMBA + EO | 7.42 ± 0.76 | 69.42 ± 3.15 | 154.7 ± 2.8** | 5.69 ± 0.37 | 116.4 ± 1.32** | 26.82 ± 1.06 |
For the experimental groups receiving IA and the IA-mediated nanoemulsion in comparison to the vehicle control group and DMBA control group, statistical analyses and comparisons of the mean concentrations of AST, ALT, ALP, albumin, and total protein were conducted (Table 8). The experimental groups receiving IA and the IA-mediated nanoemulsion compared to the control group are significantly different from each other. In comparison to the control group, the DMBA control, DMBA + NE treatment, and EO treated groups had significantly higher mean blood concentrations of the AST enzyme (p < 0.05). Similarly, the mean serum concentrations of the ALT enzyme and serum albumin levels in the DMBA + NE group relative to the control group increased significantly at the level of p < 0.05. Also, the mean serum AST, ALP and total protein levels in the IA-treated group showed a significant increase compared to the control group at the levels of p < 0.05 and p < 0.001.
| Group | AST (U L−1) | ALT (U L−1) | ALP (U L−1) | Total protein (mg dL−1) | Albumin (mg dL−1) |
|---|---|---|---|---|---|
| a The results represent the mean ± standard deviation of group results obtained (n = 7). Means having *(p < 0.05), **(p < 0.001), ***(p < 0.0001) are statistically significant compared with the control group and DMBA control group. | |||||
| Vehicle control | 123 ± 12.43 | 56.43 ± 2.56 | 61.87 ± 3.11 | 0.13 ± 0.12 | 0.12 ± 0.05 |
| Nanoemulsion control | 135.4 ± 14.32 | 54.32 ± 5.61 | 67.23 ± 4.12 | 0.24 ± 0.04 | 0.22 ± 0.01 |
| DMBA control | 165.4 ± 17.32*** | 79.14 ± 3.22* | 89.54 ± 4.53** | 0.52 ± 0.51* | 0.41 ± 0.51* |
| DMBA + IA | 161.3 ± 19.31* | 82.32 ± 3.12** | 81.32 ± 3.21* | 0.31 ± 0.32* | 0.37 ± 0.32 |
| DMBA + NE | 148.4 ± 13.64 | 76.21 ± 4.24* | 63.87 ± 1.43 | 0.24 ± 0.03 | 0.39 ± 0.06* |
| DMBA + EO | 156.4 ± 11.65* | 69.21 ± 5.21 | 72.54 ± 2.54* | 0.27 ± 0.24 | 0.36 ± 0.01 |
3.17 Oxidative stress markers
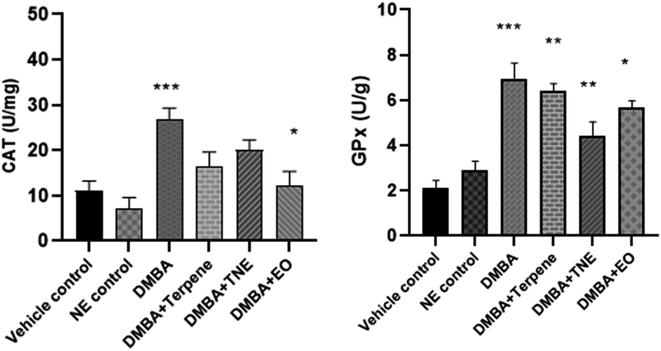
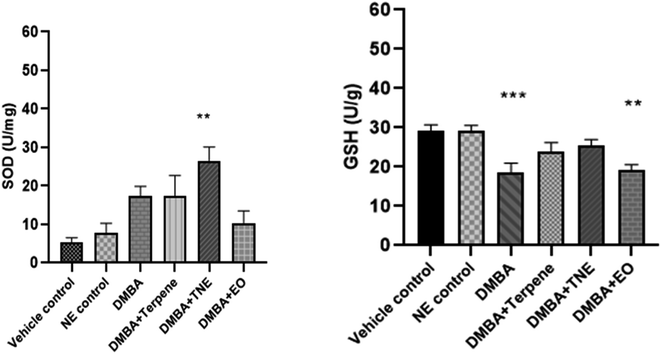
Antioxidative parameters were evaluated in stressful situations in the body and it was essential to detect levels of antioxidant enzymes related to DMBA-induced cancer and then evaluate the effects of the pure isolated compound IA, EO and nanoemulsion on different stress markers. The CAT level decreased (p = 0.404) in all the treatment groups compared to the untreated DMBA group (untreated group) but this decrease was not significant. The CAT level was improved in the IA-treated group to 16.32 ± 0.84 units per mg and p < 0.05. The maximum CAT level was observed in the DMBA-induced untreated group of 26.65 ± 0.33 units per mg. CAT values were observed as p = 0.091 in the NE-treated groups compared to the control group (Fig. 16).The DMBA control group exhibited GPx activity (p = 0.0001) in comparison to the control group. The nanoemulsion treatment group shows significant values (p = 0.001) compared to the control group, while the EO group exhibited p = 0.0001. It was also shown that GPx concentration increased in the DMBA-induced and treated groups in comparison to the vehicle control group. IA and the IA-based nanoemulsion significantly improved GPx activity (p < 0.01) in rats with DMBA-induced tumors and it was concluded that IA has potential effects on glutathione peroxidase levels.
The DMBA control group exhibited SOD activity (p = 0.035) in comparison to the vehicle control group. The nanoemulsion treatment group exhibited p = 0.0012. It was also shown that SOD concentration increased in DMBA-induced rats after they were treated with IA and IA-based nanoemulsion formulations compared to untreated DMBA-induced rats. The GSH levels were estimated in normal, untreated DMBA-induced, IA-treated and nanoemulsion-treated mammary tumor-induced rats. It was detected that the levels of glutathione reduced in DMBA-induced rats to 18.60 ± 2.76 units per g after tumor induction significantly (p = 0.0025) compared to the control group rats. Nanoemulsion treatment increased the levels of GSH in the DMBA-induced rat group (p = 0.429), but this was not significant in comparison to the control group (Fig. 17).
3.18 Inflammatory cytokine marker analysis
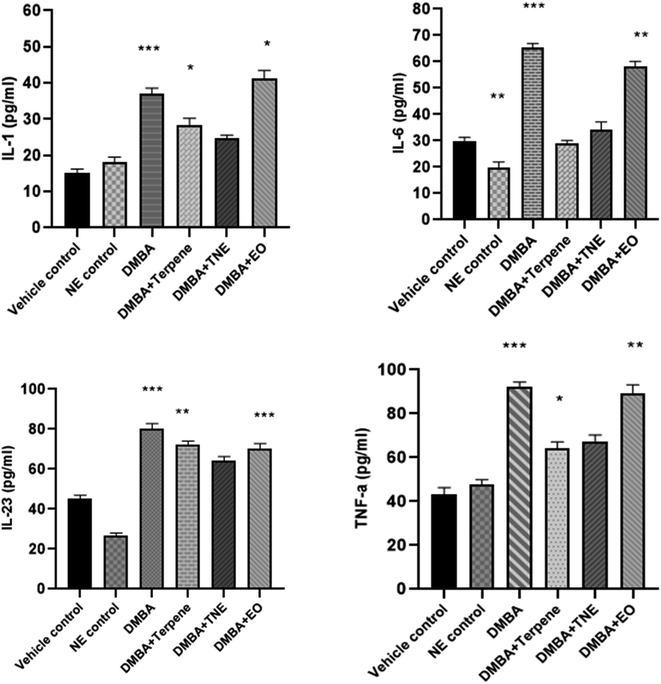
The concentration of proinflammatory cytokines IL-1, IL-6, IL-23 and TNF-α were measured in the serum samples of DMBA-induced mammary cancer-induced rats and cytokine levels were monitored. A rise in the level of serum IL-1 (p = 0.020) was observed in DMBA cancer-induced rats. The nanoemulsion-treated group showed IL-1 levels of 24.64 pg mL−1 (p > 0.05) compared to the vehicle control and DMBA-induced groups, which was statistically non-significant. However, IA improved the IL-6 levels in DMBA-induced rats, as shown in Fig. 18. Moreover, considerably improved levels were observed in the DMBA + EO treated group (p < 0.05). A significant difference was observed in IL-6 levels, where p = 0.017. An increase in the serum levels of IL-6 (p < 0.05) and (p < 0.01) was observed in DMBA cancer-induced rats in comparison to the vehicle control and nanoemulsion control groups. Animals treated with IA and nanoemulsion show no significant improvement in IL-6 levels, as shown in Fig. 18. The nanoemulsion positive control group showed decreased levels of IL-6 in comparison to the DMBA control group (p = 0.0284); a difference that was significant. A reduction of 36.33 ± 0.92 in the IL-6 levels was noted in the DMBA-induced group treated with the nanoemulsion, but according to one-way ANOVA analysis, this was observed to be non-significant.A significant rise in the level of IL-23 was observed (p = 0.001) in the DMBA cancer-induced rats in comparison to the vehicle control and nanoemulsion positive control groups. A significant improvement was detected in the IA-treated group, where a p value of p = 0.015 was observed compared to the control group and a remarkable difference was also observed in the essential oil treated group of rats treated by C. roseus EO (p = 0.014). The positive control group showed increased levels of TNF-α in comparison to the vehicle control group (p < 0.05). The serum level TNF-α was detected to be increased in the DMBA-induced group, which was suggestively different from that of the control animals (p = 0.005) and nanoemulsion positive control group (p = 0.015). The serum levels of the nanoemulsion-treated groups receiving 50 mg per kg nanoemulsions showed a reduction in TNF-α in comparison to the DMBA-induced cancer untreated group, but this was not statistically significant. However, both the treatments, i.e., IA and the nanoemulsion, markedly reduced the levels of TNF-α in the serum samples compared to in the untreated tumor-induced group. It was also observed that the serum TNF-α levels improved significantly upon treatment with IA, with an observed p value of 0.044.
3.19 Apoptosis assay
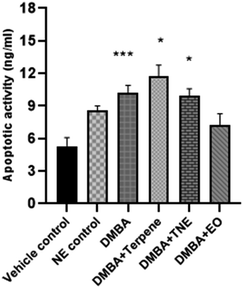
Apoptosis is a programmed death mode induced in cells by physiological and biochemical factors and it is the most common behavior of plant extracts or phytocompounds that exerts anti-tumor activity.63 The apoptosis rates of the IA-treated and nanoemulsion-treated groups were suggestively higher (p < 0.05) than that of the vehicle control group (Fig. 19). The apoptosis rates were 5.31 ng mL−1 (vehicle control group), 5.88 ng mL−1 (nanoemulsion control group) 10.23 ng mL−1 (DMBA group), 11.76 ng mL−1 (IA group), 9.92 ng mL−1 (nanoemulsion group) and 7.26 ng mL−1 (EO group). The apoptotic activity in the DMBA-induced group (left untreated by nanoemulsions) was significantly observed to be p = 0.005. Significant apoptotic events were more demonstrated by nanoemulsions at a dose of 50 mg per kg body weight (p = 0.000) compared to the control and DMBA-induced untreated nanoemulsion groups.3.20 Histopathology of mammary tissues
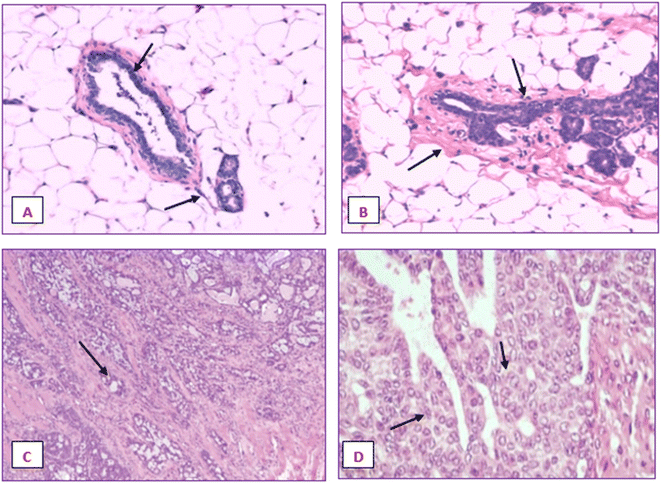
Fig. 20 displays the histoarchitecture of DMBA-induced tumors in rat mammary glands following H&E staining. The mammary glands of healthy rats had normal lobules, mammary acini and likewise showed normal morphology. Histopathology identified the tumor type in the group treated with DMBA as a differentiated adenocarcinoma. Proliferative lesions and lobular alveolar hyperplasia were visible in breast tissue samples of cancer-induced animals. Comparing the IA group to the DMBA group, there was a very minor decrease in the tubular formations with surrounding fibrosis. Examination of mammary tumors from rats given nanoemulsion revealed an adenocarcinoma, which was supported by a mild disruption of mammary cells. Animals post-treated with the terpene nanoemulsion showed modestly reduced lobular alveolar damage and an architecture that was close to normal. Nanoemulsion treatment can reduce the hyperproliferation of breast tumor-bearing rats, which is extremely important for extending their lifespan.3.21 Histopathology of liver and kidney
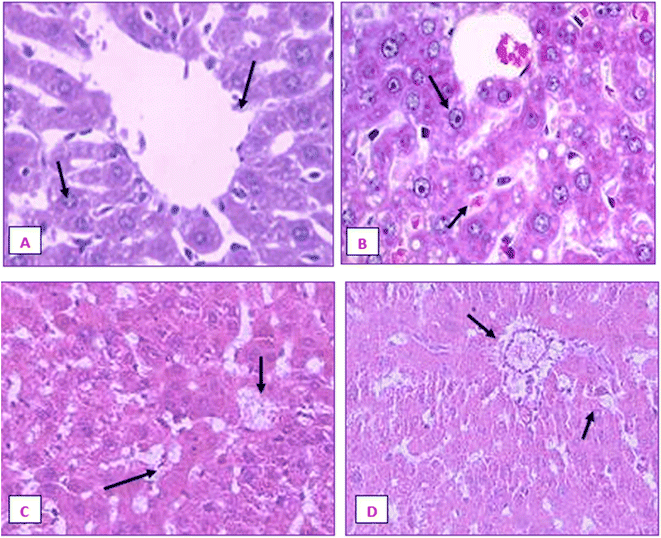
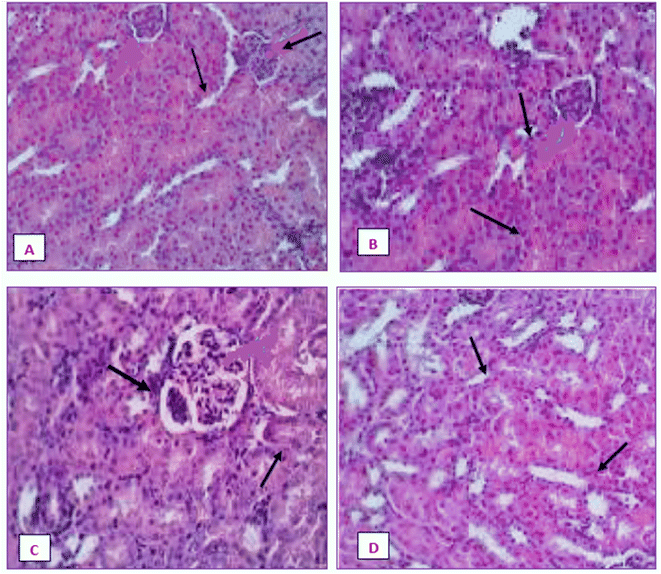
The liver and renal tissues of the rats treated with the IA-mediated nanoemulsion after cancer induction showed no discernible histological alterations compared to the control group. Observations of the liver's morphology (Fig. 21) revealed that the organ was enlarged (hepatomegaly) and that it differed from healthy control group rats in terms of color, size, and texture. In H&E (hematoxylin and eosin) stained liver slices of the NE-treated rats, abnormal architecture and granular cytoplasm with neoplastic cells and intrahepatic spaces were observed. The morphology of the kidneys did not exhibit any enlargement and was comparable in terms of size and texture between the normal and cancer-induced groups. In the group that had been exposed to DMBA, which causes cancer, the renal characteristics included some minor degenerative alterations of renal glomeruli with normal tubules, as well as modest atrophy in certain glomeruli. The absence of tubular degeneration in the kidney tissue of the nanoemulsion-treated group compared to the normal control group (Fig. 22) indicated that there were no major alterations in kidney cells. Fig. 21 and 22 depict the histological alterations in the liver and kidneys.4. Discussion
IA is a terpene compound and terpenes are therapeutically used for their cytotoxic and antiproliferative activity in multiple cancer treatments. It has been reported that there are abundant terpenes, triterpenes and terpenoids present in plant extracts, which are major constituents of essential oil, that show anti-inflammatory, apoptotic, anti-cancer and anti-oxidant effects. As IA is a diterpenoid compound isolated from C. roseus essential oil, the in vitro and in vivo anticancer activities of this compound were investigated. It was of great significance to systematically investigate its effect in a breast cancer model by formulating a nanoemulsion of this compound for effective and safe drug delivery. There were no clear data reported for the anticancer activity of the IA-mediated nanoemulsion in a cancer model so this molecule was suggested for investigation in an in silico, in vivo and in vivo breast cancer study. As consolidated by our analysis, the IA-synthesized nanoemulsion exerts anti-oxidative, anticancer and anti-inflammatory properties. It was reported in previous studies that cytokine-mediated NF-κB activation was stimulated by IA.64 This repressive impact indicated that particular IA therapy significantly reduced inflammation in a mouse model. Moreover, pre-treatment with IA decreased levels of various stress markers, interleukin-6, malondialdehyde, while increasing levels of SOD and CAT.65Natural remedies can significantly aid in dealing with a number of human illnesses, including cancer, which is a major cause of mortality worldwide after cardiovascular diseases.66,67 To find new hits or leads against certain physiologically active macromolecules, in silico drug design uses theoretical and computational methodologies. The computer-aided drug design (CADD) techniques utilized today to find medicines and other physiologically active chemicals include pharmacophore modelling and dynamic simulation methods. Whenever a chemical attaches to a designated macromolecule and triggers a certain reaction, its biological function may be evaluated using an in silico molecular docking method.68
Naturally occurring terpene and terpenoids can be found in many different plants and herbs and some of them serve as a chemical intermediary in the synthesis of biochemical metabolites.69 Some terpenes are also said to be able to lessen oxidative stress and inflammation in animals being experimented on. Linalool, geranyl acetate, α-terpinene and α-pinene were found to be present in coriander EO, and act as anti-inflammatory agents, as suggested in a prospective study.70 Traditional uses of Annona muricata leaves have considerable ameliorative benefits due to the presence of terpenoid compounds. The research investigation involved the distillation of essential oils to identify their volatile components. Animals were put into three groups, control, DMBA group and experimental group, with differential doses of EO and DMBA. EO reduced the frequency of tumors, the amount of oxidative stress and the tumor volume due to the presence of terpene phytocompounds. These ameliorative and protective effects of A. muricata EO leaves were concluded in a BC murine model.71
A monoterpene that has been examined in vitro against liver cancer cells is geraniol, and this molecule aids the prevention of human breast and liver cancer cells from proliferating. The in vivo and in vitro activities of these medications were highlighted to identify molecular pathways.72 The triterpenoids glycyrrhizic acid and oleanolic acid have immunomodulatory and anticancer characteristics and these phytocompounds might initiate diverse proapoptotic signaling cascades, leading to apoptosis in cancer cells. The ability of these terpenoid compounds to inhibit the growth of tumor-induced angiogenesis and metastatic spread has been well demonstrated. The chemoprotective and chemo preventive qualities of these compound indicate that they have a potential role in modern anticancer therapy.73 A natural compound from a plant-based study demonstrated the ameliorative effects of ellagic acid and Punica granatum extracts on cancer-induced biochemical alterations and revealed that they were effective in protecting against hepatic function tests and antioxidative enzymes. It was determined that the ameliorative action against radiation-induced biochemical changes in mice of natural extracts and the biosynthesized nanoformulations may be related to their capacity to stimulate antioxidant enzymes and scavenge free radicals.74 According to the findings of an experimental model, the levels of blood liver enzyme biomarkers, total bilirubin, lipid profile, total protein levels, lipid peroxidation, tissue morphology, and histopathological injuries can all be successfully restored by the use of herbal medicinal plants. In order to prevent hepatotoxicity and deliver prospective positive activity, they also switched up different molecular functions and pathways.75 Animals treated with plant-containing substances displayed variable degrees of improvement in the biochemical and pathological evaluated indices of RFT. The findings suggested that a number of phytocompounds derived from plant components might be used as a readily available treatment for aberrant kidney biochemical parameters.
Cytokine and lipopolysaccharide-mediated NF-κB activation were suppressed by IA as it prevented the TAK/TAB-mediated phosphorylation of the IKB activation loop. The repressive impact indicates that particular IA therapy significantly reduced inflammation in the mouse model. As a result, diterpenoid IA and its derivatives, which were once used as anti-inflammatory herbal medicines, may represent a possible new class of NF-κB inhibitors.76 Moreover, pre-treatment with IA decreased levels of interleukin-6, tumor necrosis factor-alpha, malondialdehyde, and metabolites while increasing levels of IL-10, SOD, CAT and brain-derived neurotrophic factor. IA lessened the memory and learning deficits brought on by LPS.65 After a head injury, the mice brains were treated with IA, which decreased glial activation, inhibited the production of IL-1 and TNF-α mRNAs and caused cell death in macrophages.77 IA can prevent oxidative stress, inflammation and death in neural progenitors and Aβ25–35 induced growth and differentiation. In addition to restoring dysregulated MMP, ROS levels, dysregulated apoptosis and inflammation-related mRNA/protein expression were also minimized and this neuroprotective impact was also linked to decreased inflammation.78
It has been discovered that IA, obtained from Boswellia resin, inhibits nuclear factor-kB, a critical transcription factor in multiple inflammatory responses. IA lessens the production of many kinds of inflammatory mediators in an in vitro model system employing C6 glioma and in human peripheral monocytes. IA induced cell death in macrophages around the site of damage, reduced glial activation, and lowered the production of interleukin-1β and TNF-α mRNAs to minimize inflammatory response in cells.59 The effect of the nanoemulsions of Mentha piperita EO was still noticeably superior to that of the EO M. piperita, and by creating dosage form nanoemulsions, the anticancer properties were further enhanced due to the presence of some terpene compounds, such as menthone and camphane.79 Significant dose- and time-dependent anticancer effects were also observed in breast cancer cells (4T1), along with less cytotoxicity in non-tumor cells upon the use of the pequi oil nanoemulsion. Pequi oil also serves as a structural component of the nanoemulsion and a potent cytotoxic agent for BC cells. These findings point to the pequi oil-based nanoemulsion serving as a viable nanosized platform for usage as an adjuvant therapy for treating breast cancer.80 Such nanoformulations are used to enhance drug-specific targeting and direct uptake into BC cells, thus improving therapeutic effectiveness. Engineered NPs used in nanomedicine-based delivery can improve therapeutic and diagnostic results, raising patient survival and their overall wellbeing.81
5. Conclusion
Nanoparticles and natural compounds with anti-cancer therapeutic properties may assist formulations to be delivered safely. In this study, a phytocompound IA-based nanoemulsion was synthesized, which was identified from the essential oil of the Catharanthus roseus medicinal plant. The results were found to be positive and comparable to improvements in breast cancer via biochemical measures and molecular markers. Molecular docking, molecular dynamics simulation, drug similarity analysis, and ADMET profiling were used to examine how IA interacts with breast cancer targets. The binding cavities of the ER, PR, and HER2 receptors were predicted by docking studies to identify best docked complex with highest binding affinity. It was determined from the docking study of all complexes that ER had the best docking interaction with IA. Hydrophobicity, interactions between hydrogen atoms in hydrogen bonds, and Van Der Waals interactions, had a substantial impact on the stability of the receptor–ligand complexes. The biosynthesized IA-containing nanoemulsions also showed remarkable in vitro antioxidant and cytotoxic activity. IA and the prepared nanoformulations also showed some improved biochemical parameters, oxidative stress markers and inflammatory cytokine markers in a cancer-induced rat model. Overall, it was deduced that biogenically produced nanoemulsions IA have the potential to be employed in targeted treatment for cancer indicators and have a selective anticancer impact. Given the potency of IA-mediated nanoparticles, future research must focus on carrying out exhaustive preclinical studies on bioavailability, pharmacodynamics, biomarkers, and tumor suppression parameters.Abbreviations
| ADMET | Adsorption, metabolism, distribution, excretion, and toxicity |
| BBB | Blood–brain barrier |
| CADD | Computer-aided drug design |
| EOs | Essential oils |
| GC/MS | Gas chromatography-mass spectrometry |
| GI | Gastrointestinal |
| HER2 | Human epidermal growth factor receptor 2 |
| MD simulations | Molecular dynamics simulations |
| PDB | Protein data bank |
| RMSD | Root mean square deviation |
| RMSF | Root mean square fluctuations |
Data availability
We declare that all the generated data are included in this study.Author contributions
Conceptualization, writing original draft preparation, Iffat Nayila; resources, Farhana Aman; data curation, review and editing, Iffat Nayila, Sumaira Sharif, Madeeha Shahzad Lodhi; supervision, project administration, Sumaira Sharif and Muhammad Fayyaz Ur Rehman. All authors have read and agreed to the published version of the manuscript.Conflicts of interest
The authors declare that they have no known competing financial interests or personal relationships that could have appeared to influence the work reported in this paper.References
- N. Wilking, G. Brådvik, P. Lindgren, C. Svedman, B. Jönsson and T. Hofmarcher, 1588MO_PR A Comparative Study on Costs of Cancer and Access to Medicines in Europe, Ann. Oncol., 2020, 31, S1197, DOI:10.1016/j.annonc.2020.08.2303.
- A. M. Tomko, E. G. Whynot, L. D. Ellis and D. J. Dupré, Anti-Cancer Potential of Cannabinoids, Terpenes, and Flavonoids Present in Cannabis, Cancers, 2020, 12(7), 1985, DOI:10.3390/cancers12071985.
- S. Kumar, B. Singh and R. Singh, Catharanthus Roseus (L.) G. Don: A Review of Its Ethnobotany, Phytochemistry, Ethnopharmacology and Toxicities, J. Ethnopharmacol., 2022, 284, 114647, DOI:10.1016/j.jep.2021.114647.
- O. A. Lawal, I. A. Ogunwande, A. E. Ibirogba, O. M. Layode and A. R. Opoku, Chemical Constituents of Essential Oils from Catharanthus Roseus (L.) G. Don Grown in Nigeria, J. Essent.Oil Bear. Plants, 2015, 18(1), 57–63, DOI:10.1080/0972060X.2014.998720.
- S. Lamichhane, R. P. Rai, A. Khatri, R. Adhikari, B. G. Shrestha and S. K. Shrestha, Screening of Phytochemicals as Potential Anti-Breast Cancer Agents Targeting HER2: An In Silico Approach, J. Biomol. Struct. Dyn., 2021, 1–15, DOI:10.1080/07391102.2021.2014972.
- J. Pereira, M. Miguel Castro, F. Santos, A. Rita Jesus, A. Paiva, F. Oliveira and A. R. C. Duarte, Selective Terpene Based Therapeutic Deep Eutectic Systems against Colorectal Cancer, Eur. J. Pharm. Biopharm., 2022, 175, 13–26, DOI:10.1016/j.ejpb.2022.04.008.
- M. Aqil, A. Ahad, Y. Sultana and A. Ali, Status of Terpenes as Skin Penetration Enhancers, Drug Discovery Today, 2007, 12(23), 1061–1067, DOI:10.1016/j.drudis.2007.09.001.
- F. L. Hakkim, M. Al-Buloshi and J. Al-Sabahi, Frankincense Derived Heavy Terpene Cocktail Boosting Breast Cancer Cell (MDA-MB-231) Death In Vitro, Asian Pac. J. Trop. Biomed., 2015, 5(10), 824–828, DOI:10.1016/j.apjtb.2015.06.008.
- P. M. Döll-Boscardin, A. Sartoratto, B. H. L. d. N. Sales Maia, J. Padilha de Paula, T. Nakashima, P. V. Farago and C. C. Kanunfre, In Vitro Cytotoxic Potential of Essential Oils of Eucalyptus Benthamii and Its Related Terpenes on Tumor Cell Lines, Evid.-Based Complementary Altern. Med., 2012, 2012, 342652, DOI:10.1155/2012/342652.
- A. M. Tomko, E. G. Whynot, L. D. Ellis and D. J. Dupré, Anti-Cancer Potential of Cannabinoids, Terpenes, and Flavonoids Present in Cannabis, Cancers, 2020, 12(7), 1985, DOI:10.3390/cancers12071985.
- Y. Zhao, R. Chen, Y. Wang and Y. Yang, α-Pinene Inhibits Human Prostate Cancer Growth in a Mouse Xenograft Model, Chemotherapy, 2018, 63(1), 1–7, DOI:10.1159/000479863.
- T. R. de O. Ramalho, M. T. P. de Oliveira, A. L. de A. Lima, C. R. Bezerra-Santos and M. R. Piuvezam, Gamma-Terpinene Modulates Acute Inflammatory Response in Mice, Planta Med., 2015, 81(14), 1248–1254, DOI:10.1055/s-0035-1546169.
- J. Rajendran, P. Pachaiappan and R. Thangarasu, Citronellol, an Acyclic Monoterpene Induces Mitochondrial-Mediated Apoptosis through Activation of Proapoptotic Factors in MCF-7 and MDA-MB-231 Human Mammary Tumor Cells, Nutr. Cancer, 2021, 73(8), 1448–1458, DOI:10.1080/01635581.2020.1800766.
- I. A. Ansari and M. S. Akhtar, Current Insights on the Role of Terpenoids as Anticancer Agents: A Perspective on Cancer Prevention and Treatment, in Natural Bio-active Compounds: Volume 2: Chemistry, Pharmacology and Health Care Practices, ed. M. K. Swamy and M. S. Akhtar, Springer, Singapore, 2019, pp. 53–80, DOI:10.1007/978-981-13-7205-6_3.
- J. J. Chebet, J. E. Ehiri, D. J. McClelland, D. Taren and I. A. Hakim, Effect of D-Limonene and Its Derivatives on Breast Cancer in Human Trials: A Scoping Review and Narrative Synthesis, BMC Cancer, 2021, 21(1), 902, DOI:10.1186/s12885-021-08639-1.
- E. Sánchez-López, M. Guerra, J. Dias-Ferreira, A. Lopez-Machado, M. Ettcheto, A. Cano, M. Espina, A. Camins, M. L. Garcia and E. B. Souto, Current Applications of Nanoemulsions in Cancer Therapeutics, Nanomaterials, 2019, 9(6), 821, DOI:10.3390/nano9060821.
- F. Salehi, H. Behboudi, G. Kavoosi and S. K. Ardestani, Incorporation of Zataria Multiflora Essential Oil into Chitosan Biopolymer Nanoparticles: A Nanoemulsion Based Delivery System to Improve the In Vitro Efficacy, Stability and Anticancer Activity of ZEO against Breast Cancer Cells, Int. J. Biol. Macromol., 2020, 143, 382–392, DOI:10.1016/j.ijbiomac.2019.12.058.
- L. A. Conde-Hernández, J. R. Espinosa-Victoria, A. Trejo and J. Á. Guerrero-Beltrán, CO2-Supercritical Extraction, Hydrodistillation and Steam Distillation of Essential Oil of Rosemary (Rosmarinus Officinalis), J. Food Eng., 2017, 200, 81–86, DOI:10.1016/j.jfoodeng.2016.12.022.
- T. Furuhashi and K. Okuda, Application of GC/MS Soft Ionization for Isomeric Biological Compound Analysis, Crit. Rev. Anal. Chem., 2017, 47(5), 438–453, DOI:10.1080/10408347.2017.1320215.
- Y. L. Ngo and L. S. Chua, Column Chromatography for Preparing Rosmarinic Acid Rich Extract from Orthosiphon Aristatus, J. Liq. Chromatogr. Relat. Technol., 2019, 42(17–18), 546–554, DOI:10.1080/10826076.2019.1635891.
- H.-Y. Yu, S. Myoung and S. Ahn, Recent Applications of Benchtop Nuclear Magnetic Resonance Spectroscopy, Magnetochemistry, 2021, 7(9), 121, DOI:10.3390/magnetochemistry7090121.
- M. Efdi, S. Fujita, T. Inuzuka and M. Koketsu, Chemical Studies on Goniothalamus Tapis Miq, Nat. Prod. Res., 2010, 24(7), 657–662, DOI:10.1080/14786410903132449.
- F. Boyles, C. M. Deane and G. M. Morris, Learning from the Ligand: Using Ligand-Based Features to Improve Binding Affinity Prediction, Bioinformatics, 2020, 36(3), 758–764, DOI:10.1093/bioinformatics/btz665.
- O. Trott and A. J. Olson, AutoDock Vina: Improving the Speed and Accuracy of Docking with a New Scoring Function, Efficient Optimization, and Multithreading, J. Comput. Chem., 2010, 31(2), 455–461, DOI:10.1002/jcc.21334.
- M. P. Gleeson, A. Hersey, D. Montanari and J. Overington, Probing the Links between In Vitro Potency, ADMET and Physicochemical Parameters, Nat. Rev. Drug Discovery, 2011, 10(3), 197–208, DOI:10.1038/nrd3367.
- Y. Isyaku, A. Uzairu and S. Uba, Computational Studies of a Series of 2-Substituted Phenyl-2-Oxo-, 2-Hydroxyl- and 2-Acylloxyethylsulfonamides as Potent Anti-Fungal Agents, Heliyon, 2020, 6(4), e03724, DOI:10.1016/j.heliyon.2020.e03724.
- L. Guan, H. Yang, Y. Cai, L. Sun, P. Di, W. Li, G. Liu and Y. Tang, ADMET-Score – A Comprehensive Scoring Function for Evaluation of Chemical Drug-Likeness, MedChemComm, 2018, 10(1), 148–157, 10.1039/c8md00472b.
- M. D. M. Fernando, A. Adhikari, N. H. K. S. Senathilake, E. D. de Silva, C. M. Nanayakkara, R. L. C. Wijesundera, P. Soysa and B. G. D. N. K. de. Silva, In Silico Pharmacological Analysis of a Potent Anti-Hepatoma Compound of Mushroom Origin and Emerging Role as an Adjuvant Drug Lead, Food Nutr. Sci., 2019, 10(11), 1313–1333, DOI:10.4236/fns.2019.1011095.
- Q. Xiong, M. Xu, J. Li, Y. Liu, J. Zhang, Y. Xu and W. Dong, Clinical Sequelae of COVID-19 Survivors in Wuhan, China: A Single-Centre Longitudinal Study, Clin. Microbiol. Infect., 2021, 27(1), 89–95, DOI:10.1016/j.cmi.2020.09.023.
- A. W. Sousa da Silva and W. F. Vranken, ACPYPE - AnteChamber PYthon Parser interfacE, BMC Res. Notes, 2012, 5(1), 367, DOI:10.1186/1756-0500-5-367.
- M. Shaldam, A. Nocentini, Z. M. Elsayed, T. M. Ibrahim, R. Salem, R. A. El-Domany, C. Capasso, C. T. Supuran and W. M. Eldehna, Development of Novel Quinoline-Based Sulfonamides as Selective Cancer-Associated Carbonic Anhydrase Isoform IX Inhibitors, Int. J. Mol. Sci., 2021, 22(20), 11119, DOI:10.3390/ijms222011119.
- T. Duran, B. Minatovicz, J. Bai, D. Shin, H. Mohammadiarani and B. Chaudhuri, Molecular Dynamics Simulation to Uncover the Mechanisms of Protein Instability During Freezing, J. Pharm. Sci., 2021, 110(6), 2457–2471, DOI:10.1016/j.xphs.2021.01.002.
- G. Giunti, D. Palermo, F. Laudani, G. M. Algeri, O. Campolo and V. Palmeri, Repellence and Acute Toxicity of a Nano-Emulsion of Sweet Orange Essential Oil toward Two Major Stored Grain Insect Pests, Ind. Crops Prod., 2019, 142, 111869, DOI:10.1016/j.indcrop.2019.111869.
- S. Navaei Shoorvarzi, F. Shahraki, N. Shafaei, E. Karimi and E. Oskoueian, Citrus Aurantium L. Bloom Essential Oil Nanoemulsion: Synthesis, Characterization, Cytotoxicity, and Its Potential Health Impacts on Mice, J. Food Biochem., 2020, 44(5), e13181, DOI:10.1111/jfbc.13181.
- R. Ramachandran and P. Shanmughavel, Preparation and Characterization of Biopolymeric Nanoparticles Used in Drug Delivery, IJBB, 2010, 47(1), 56–59 CAS.
- A. V. M. Abadi, E. Karimi, E. Oskoueian, G. R. K. S. Mohammad and N. Shafaei, Synthesis, Characterization and Cytoxicity Evaluation of Syzygium Aromaticum L. Bud (Clove) Essential Oil Nanoemulsion, 2021, preprint, in review, DOI:10.21203/rs.3.rs-952488/v1.
- S. Bhattacharjee, DLS and Zeta Potential – What They Are and What They Are Not?, J. Controlled Release, 2016, 235, 337–351, DOI:10.1016/j.jconrel.2016.06.017.
- H. Agrawal and A. Mishra, A Study on Influence of Density and Viscosity of Emulsion Explosive on Its Detonation Velocity, Modell., Meas. Control, C, 2017, 78(3), 316–336, DOI:10.18280/mmc_c.780305.
- O. Uncu, B. Ozen and F. Tokatli, Use of FTIR and UV–Visible Spectroscopy in Determination of Chemical Characteristics of Olive Oils, Talanta, 2019, 201, 65–73, DOI:10.1016/j.talanta.2019.03.116.
- H. Masmoudi, Y. L. Dréau, P. Piccerelle and J. Kister, The Evaluation of Cosmetic and Pharmaceutical Emulsions Aging Process Using Classical Techniques and a New Method: FTIR, Int. J. Pharm., 2005, 289(1), 117–131, DOI:10.1016/j.ijpharm.2004.10.020.
- G. Crippa, F. Ye and C. Malinverno, Which Is the Best Method to Prepare Invertebrate Shells for SEM Analysis? Testing Different Techniques on Recent and Fossil Brachiopods, Boll. Soc. Paleontol. Ital., 2016, 2, 111–125, DOI:10.4435/BSPI.2016.11.
- B. S. Tüzün, J. Hohmann and B. Kivcak, Green Bio-Inspired Synthesis, Characterization and Activity of Silver Nanoparticle Forms of Centaurea Virgata Lam. and the Isolated Flavonoid Eupatorin, Green Process. Synth., 2018, 7(4), 372–379, DOI:10.1515/gps-2017-0027.
- M. Valko, D. Leibfritz, J. Moncol, M. T. D. Cronin, M. Mazur and J. Telser, Free Radicals and Antioxidants in Normal Physiological Functions and Human Disease, Int. J. Biochem. Cell Biol., 2007, 39(1), 44–84, DOI:10.1016/j.biocel.2006.07.001.
- C. Luis, Y. Castaño-Guerrero, R. Soares, G. Sales and R. Fernandes, Avoiding the Interference of Doxorubicin with MTT Measurements on the MCF-7 Breast Cancer Cell Line, Methods Protoc., 2019, 2(2), 29, DOI:10.3390/mps2020029.
- X.-Q. Yang, H. Zheng, Q. Ye, R.-Y. Li and Y. Chen, Essential Oil of Cinnamon Exerts Anti-Cancer Activity against Head and Neck Squamous Cell Carcinoma via Attenuating Epidermal Growth Factor Receptor - Tyrosine Kinase, J. Balk. Union Oncol., 2015, 20(6), 1518–1525 Search PubMed.
- T. Maqbool, S. J. Awan, S. Malik, F. Hadi, S. Shehzadi and K. Tariq, In Vitro Anti-Proliferative, Apoptotic and Antioxidative Activities of Medicinal Herb Kalonji (Nigella Sativa), Curr. Pharm. Biotechnol., 2019, 20(15), 1288–1308, DOI:10.2174/1389201020666190821144633.
- M. M. Baris, E. Serinan, M. Calisir, K. Simsek, S. Aktas, O. Yilmaz, S. Kilic Ozdemir and M. Secil, Xenograft Tumor Volume Measurement in Nude Mice: Estimation of 3D Ultrasound Volume Measurements Based on Manual Caliper Measurements, J. Basic Clin. Health Sci., 2020, 4(2), 90–95, DOI:10.30621/jbachs.2020.902.
- A. Talkington and R. Durrett, Estimating Tumor Growth Rates In Vivo, Bull. Math. Biol., 2015, 77(10), 1934–1954, DOI:10.1007/s11538-015-0110-8.
- M. Gyurászová, A. Kovalčíková, K. Janšáková, K. Šebeková, P. Celec and Ľ. Tóthová, Markers of Oxidative Stress and Antioxidant Status in the Plasma, Urine and Saliva of Healthy Mice, Physiol. Res., 2018, 921–934, DOI:10.33549/physiolres.933866.
- H. Aebi, Catalase, in Methods of Enzymatic Analysis, Elsevier, 1974, pp. 673–684, DOI:10.1016/B978-0-12-091302-2.50032-3.
- M. H. Hadwan, Simple Spectrophotometric Assay for Measuring Catalase Activity in Biological Tissues, BMC Biochem., 2018, 19(1), 7, DOI:10.1186/s12858-018-0097-5.
- W. Duda, K. Curzytek, M. Kubera, M. Iciek, D. Kowalczyk-Pachel, A. Bilska-Wilkosz, E. Lorenc-Koci, M. Leśkiewicz, A. Basta-Kaim, B. Budziszewska, M. Regulska, J. Ślusarczyk, P. Gruca, M. Papp, M. Maes, W. Lasoń and L. Antkiewicz-Michaluk, The Effect of Chronic Mild Stress and Imipramine on the Markers of Oxidative Stress and Antioxidant System in Rat Liver, Neurotoxic. Res., 2016, 30, 173, DOI:10.1007/s12640-016-9614-8.
- C. J. Weydert and J. J. Cullen, Measurement of Superoxide Dismutase, Catalase, and Glutathione Peroxidase in Cultured Cells and Tissue, Nat. Protoc., 2010, 5(1), 51–66, DOI:10.1038/nprot.2009.197.
- I. rahman, Assay for quantitative determination of glutathione and glutathione disulfide levels using enzymatic recycling method, Nat. Protoc., 2006, 1(6), 3159–3165, DOI:10.1038/nprot.2006.378.
- S. S. Jang, H. G. Kim, J. S. Lee, J. M. Han, H. J. Park, G. J. Huh and C. G. Son, Melatonin Reduces X-Ray Radiation-Induced Lung Injury in Mice by Modulating Oxidative Stress and Cytokine Expression, Int. J. Radiat. Biol., 2013, 89(2), 97–105, DOI:10.3109/09553002.2013.734943.
- R. K. Lindemann, A. Newbold, K. F. Whitecross, L. A. Cluse, A. J. Frew, L. Ellis, S. Williams, A. P. Wiegmans, A. E. Dear, C. L. Scott, M. Pellegrini, A. Wei, V. M. Richon, P. A. Marks, S. W. Lowe, M. J. Smyth and R. W. Johnstone, Analysis of the Apoptotic and Therapeutic Activities of Histone Deacetylase Inhibitors by Using a Mouse Model of B Cell Lymphoma, Proc. Natl. Acad. Sci. U.S.A., 2007, 104(19), 8071–8076, DOI:10.1073/pnas.0702294104.
- A. V. da Silva and H. Langoni, The Detection of Toxoplasma Gondii by Comparing Cytology, Histopathology, Bioassay in Mice, and the Polymerase Chain Reaction (PCR), Vet. Parasitol., 2001, 97(3), 193–200, DOI:10.1016/S0304-4017(01)00404-6.
- N. A. Ayoub, O. A. Eldahshan, A.-N. B. Singab and M. M. Al-Azizi, Chemical Composition of Essential Oil from Doum Fruits Hyphaene Thebaica (Palmae), J. Essent.Oil Bear. Plants, 2011, 14(2), 245–249, DOI:10.1080/0972060X.2011.10643928.
- A. Moussaieff, N. A. Shein, J. Tsenter, S. Grigoriadis, C. Simeonidou, A. G. Alexandrovich, V. Trembovler, Y. Ben-Neriah, M. L. Schmitz, B. L. Fiebich, E. Munoz, R. Mechoulam and E. Shohami, Incensole Acetate: A Novel Neuroprotective Agent Isolated from Boswellia Carterii, J. Cereb. Blood Flow Metab., 2008, 28(7), 1341–1352, DOI:10.1038/jcbfm.2008.28.
- M. De Vivo, M. Masetti, G. Bottegoni and A. Cavalli, Role of Molecular Dynamics and Related Methods in Drug Discovery, J. Med. Chem., 2016, 59(9), 4035–4061, DOI:10.1021/acs.jmedchem.5b01684.
- M. Memar Bashi Aval, E. Hoveizi, R. Mombeiny, M. Kazemi, S. Saeedi and S. Tavakol, Dutasteride Nanoemulsion Preparation to Inhibit 5-Alpha-Hair Follicle Reductase Enzymes in the Hair Follicle; an Ex Vivo Study, IET Nanobiotechnol., 2023, 17(1), 13–21, DOI:10.1049/nbt2.12101.
- T. Sharma, G. S. Kumar, B. H. Chon and J. S. Sangwai, Viscosity of the Oil-in-Water Pickering Emulsion Stabilized by Surfactant-Polymer and Nanoparticle-Surfactant-Polymer System, Korea Aust. Rheol. J., 2014, 26(4), 377–387, DOI:10.1007/s13367-014-0043-z.
- M. B. Mirza, A. I. Elkady, A. M. Al-Attar, F. Q. Syed, F. A. Mohammed and K. R. Hakeem, Induction of Apoptosis and Cell Cycle Arrest by Ethyl Acetate Fraction of Phoenix Dactylifera L. (Ajwa Dates) in Prostate Cancer Cells, J. Ethnopharmacol., 2018, 218, 35–44, DOI:10.1016/j.jep.2018.02.030.
- T. Efferth, M. E. M. Saeed, O. Kadioglu, E.-J. Seo, S. Shirooie, A. T. Mbaveng, S. M. Nabavi and V. Kuete, Collateral Sensitivity of Natural Products in Drug-Resistant Cancer Cells, Biotechnol. Adv., 2020, 38, 107342, DOI:10.1016/j.biotechadv.2019.01.009.
- N. Marefati, F. Beheshti, F. Vafaee, M. Barabadi and M. Hosseini, The Effects of Incensole Acetate on Neuro-Inflammation, Brain-Derived Neurotrophic Factor and Memory Impairment Induced by Lipopolysaccharide in Rats, Neurochem. Res., 2021, 46(9), 2473–2484, DOI:10.1007/s11064-021-03381-3.
- Global Burden of Disease Cancer Collaboration, Global, Regional, and National Cancer Incidence, Mortality, Years of Life Lost, Years Lived With Disability, and Disability-Adjusted Life-Years for 32 Cancer Groups, 1990 to 2015: A Systematic Analysis for the Global Burden of Disease Study, JAMA Oncol., 2017, 3(4), 524–548, DOI:10.1001/jamaoncol.2016.5688.
- A. G. Desai, G. N. Qazi, R. K. Ganju, M. El-Tamer, J. Singh, A. K. Saxena, Y. S. Bedi, S. C. Taneja and H. K. Bhat, Medicinal Plants and Cancer Chemoprevention, Curr. Drug Metab., 2008, 9(7), 581–591 CrossRef CAS PubMed.
- S. Dutta, P. S. Kharkar, N. U. Sahu and A. Khanna, Molecular Docking Prediction and In Vitro Studies Elucidate Anti-Cancer Activity of Phytoestrogens, Life Sci., 2017, 185, 73–84, DOI:10.1016/j.lfs.2017.07.015.
- P. Pripdeevech, W. Chumpolsri, P. Suttiarporn and S. Mahatheeranont, The Chemical Composition and Antioxidant Activities of Basil from Thailand Using Retention Indices and Comprehensive Two-Dimensional Gas Chromatography, J. Serb. Chem. Soc., 2010, 75, 1503–1513, DOI:10.2298/JSC100203125P.
- A. Abbas, F. Anwar, N. Ahmad, M. Shahid, S. H. Al-Mijalli, M. Yaseen, S. Farooq and M. Iqbal, Characterization of Bioactives and Nutra-Pharmaceutical Potential of Supercritical Fluid and Hydro-Distilled Extracted Coriander Leaves Essential Oil, Dose-Response, 2022, 20(4) DOI:10.1177/15593258221130749.
- J. P. Rojas-Armas, J. L. Arroyo-Acevedo, M. Palomino-Pacheco, J. M. Ortiz-Sánchez, J. Calva, H. J. Justil-Guerrero, A. Castro-Luna, N. Ramos-Cevallos, E. C. Cieza-Macedo and O. Herrera-Calderon, Phytochemical Constituents and Ameliorative Effect of the Essential Oil from Annona Muricata L. Leaves in a Murine Model of Breast Cancer, Molecules, 2022, 27(6), 1818, DOI:10.3390/molecules27061818.
- R. J. Thoppil, Terpenoids as Potential Chemopreventive and Therapeutic Agents in Liver Cancer, World J. Hepatol., 2011, 3(9), 228, DOI:10.4254/wjh.v3.i9.228.
- G. Kuttan, P. Pratheeshkumar, K. A. Manu and R. Kuttan, Inhibition of Tumor Progression by Naturally Occurring Terpenoids, Pharm. Biol., 2011, 49(10), 995–1007, DOI:10.3109/13880209.2011.559476.
- A. M. Thotambailu, B. S. K. Bhandary and K. P. Sharmila, Protective Effect of Punica Granatum Extract in Head and Neck Cancer Patients Undergoing Radiotherapy, Indian J. Otolaryngol. Head Neck Surg., 2019, 71(suppl. 1), 318–320, DOI:10.1007/s12070-018-1297-4.
- M. Parthasarathy and S. Evan Prince, The Potential Effect of Phytochemicals and Herbal Plant Remedies for Treating Drug-Induced Hepatotoxicity: A Review, Mol. Biol. Rep., 2021, 48(5), 4767–4788, DOI:10.1007/s11033-021-06444-4.
- A. Moussaieff, E. Shohami, Y. Kashman, E. Fride, M. L. Schmitz, F. Renner, B. L. Fiebich, E. Munoz, Y. Ben-Neriah and R. Mechoulam, Incensole Acetate, a Novel Anti-Inflammatory Compound Isolated from Boswellia Resin, Inhibits Nuclear Factor-κB Activation, Mol. Pharmacol., 2007, 72(6), 1657–1664, DOI:10.1124/mol.107.038810.
- N. Ur Rehman, S. Al-Shidhani, N. Karim, A. Khan, I. Khan, S. Ahsan Halim, S. Khan Sadozai, S. Kumar Avula, R. Csuk and A. Al-Harrasi, Incensole Derivatives from Frankincense: Isolation, Enhancement, Synthetic Modification, and a Plausible Mechanism of Their Anti-Depression Activity, Bioorg. Chem., 2022, 126, 105900, DOI:10.1016/j.bioorg.2022.105900.
- M. A. El-Magd, S. F. Khalifa, F. A. A. Alzahrani, A. A. Badawy, E. S. El-Shetry, L. M. Dawood, M. M. Alruwaili, H. A. Alrawaili, E. F. Risha, F. M. El-Taweel and H. E. Marei, Incensole Acetate Prevents Beta-Amyloid-Induced Neurotoxicity in Human Olfactory Bulb Neural Stem Cells, Biomed. Pharmacother., 2018, 105, 813–823, DOI:10.1016/j.biopha.2018.06.014.
- N. Abedinpour, A. Ghanbariasad, A. Taghinezhad and M. Osanloo, Preparation of Nanoemulsions of Mentha Piperita Essential Oil and Investigation of Their Cytotoxic Effect on Human Breast Cancer Lines, BioNanoScience, 2021, 11(2), 428–436, DOI:10.1007/s12668-021-00827-4.
- A. S. Ombredane, V. H. S. Araujo, C. O. Borges, P. L. Costa, M. G. Landim, A. C. Pinheiro, Í. O. Szlachetka, L. E. C. Benedito, L. S. Espindola, D. J. S. Dias, D. M. Oliveira, J. A. Chaker, S. W. da Silva, R. B. de Azevedo and G. A. Joanitti, Nanoemulsion-Based Systems as a Promising Approach for Enhancing the Antitumoral Activity of Pequi Oil (Caryocar Brasilense Cambess.) in Breast Cancer Cells, J. Drug Delivery Sci. Technol., 2020, 58, 101819, DOI:10.1016/j.jddst.2020.101819.
- K. Ganesan, Y. Wang, F. Gao, Q. Liu, C. Zhang, P. Li, J. Zhang and J. Chen, Targeting Engineered Nanoparticles for Breast Cancer Therapy, Pharmaceutics, 2021, 13(11), 1829, DOI:10.3390/pharmaceutics13111829.
Footnote |
| † Electronic supplementary information (ESI) available. See DOI: https://doi.org/10.1039/d3ra06335f |
| This journal is © The Royal Society of Chemistry 2023 |

