 Open Access Article
Promoting jet fuel production by utilizing a Ru-doped Co-based catalyst of Ru-Co@C(Z-d)@Void@CeO2 in Fischer Tropsch synthesis
Masoud Safari ,
Ali Haghtalab
 * and
Farzaneh Arabpour Roghabadi
Faculty of Chemical Engineering, Department of Process, Tarbiat Modares University, PO Box: 14115-143, Tehran, Iran. E-mail: haghtala@modares.ac.ir
First published on 6th December 2023
Abstract
In this study, the MOF-derived hollow void catalyst Co@C(Z-d)@Void@CeO2 is promoted using ruthenium (Ru) for application as an efficient catalyst for the Fischer Tropsch synthesis (FTS). The reducibility of Co active sites is significantly improved in the presence of the Ru nanoparticles (NPs), leading to a higher degree of reduction (DOR) and dispersion. Hence, the catalyst performance, i.e., CO conversion, was enhanced by 56% at 12 bar in comparison with the catalyst without Ru. Moreover, the Ru-doped catalyst promotes the jet fuel production yields more than the other FTS products. Remarkably, both the experimental results and the molecular dynamics (MD) simulation confirmed the desired effects, where the calculated Gibbs free energy (ΔG) of paraffinic hydrocarbon formation, particularly in the jet fuel range, was lower in the presence of Ru. The thermal stability of the Ru-doped catalyst was characterized by thermogravimetric analysis (TGA) and confirmed by a dramatic low-performance loss of 4.2% at 17.5 bar during TOS of 192 h.
1. Introduction
The increase in the demand for energy and the environmental problems caused by fossil fuels have focused the attention of researchers' toward finding practical substitution routes for producing cleaner fuel from cheaper sources. The Fischer Tropsch synthesis (FTS) is a promising pathway that can convert syngas (a mixture of H2 and CO), which is derived from coal, natural gas, and biomass, to an ultraclean fuel without gradual fossil fuel pollutants, such as SOx, NOx, and particulate matter.1 FTS is a catalytic surface polymerization reaction that produces a wide range of hydrocarbons from syngas. Hence, similar to polymerization reactions, the Anderson–Schulz–Flory (ASF) principle presents a statistic distribution of FT products from C2–C4 (including olefins and paraffins), C5–C11 (gasoline), C8–C16 (jet fuel), and C10–C20 (diesel) hydrocarbons.2 In recent decades, making a positive deviation from ASF distribution toward a selective product distribution has been a prominent challenge.3 The FTS reaction has a high tendency to form heavier carbon chains because the carbon chain growth reaction is exothermic but there are other limitations.2 The catalyst plays a critical role in achieving the appropriate selectivity in FTS. Numerous criteria have a significant influence on the catalyst's selectivity since the dominant agents consist of the catalyst-active metal base, promoter, appropriate support, and catalyst fabrication with controlled size, and suitable porosity.2,3The transition metal groups illustrate significant catalytic activity in an extended range of reactions, particularly FTS, due to their electronic flexibility derived from their d orbitals that pave the way to contributing the electron density through the adsorption or desorption from substrates.4 This feature of transition metals provides the ability to adequately bind to the substrate atoms from the surface to provoke CO dissociation in the chemisorption process of FTS.
Despite iron being denoted as the most applicable FTS-based catalyst, it presents some drawbacks like low catalytic activity in FTS, contrary to its high catalytic activity in the water gas shift reaction (WGSR) and it presents low selectivity toward heavier hydrocarbons and high CO2 selectivity.5,6 In contrast, cobalt enhances FTS catalytic activity to an appropriate level and it also shows a low tendency toward the WGSR and high selectivity toward hydrocarbons with more than 5 carbons (SC5+).7 Although cobalt improves the FTS to achieve suitable targets, there have been numerous studies geared toward maximum achievement by utilizing the appropriate promoter alongside effective catalyst support. As a result, in recent decades, noticeable promoters like Ru, Rh, Pt, La, and Zr have been introduced to effectively promote the behavior of cobalt catalysts in FTS.8 Ruthenium as an effective promoter can contribute to various types of oxidation states (from II to VIII) and presents itself as a polyvalent metal that can easily show its prominent features. Although Ru is used as the base metal in FTS catalysts that have been reported in some studies,9 its dramatic price propels it as a promoter. To enhance the FTS catalytic performance of Co, it is essential to improve the reducibility of cobalt species. Since the metallic phase of cobalt is the active phase of the FTS catalyst, its dispersion and degree of reduction (DOR) have a significant impact on the catalyst performance.10 In addition, the strong interactions of cobalt species and supports such as silicate lead to an unsuitable form of cobalt composites, which may decrease the cobalt NP reducibility.11 It has been reported8–10,12 that the natural properties of ruthenium have a significant impact on the enhancement of the surface site's reactivity. Ruthenium as a promoter can facilitate the reduction of cobalt oxide particles and decrease the amount of hardly reducible mixed oxides. Besides, ruthenium can form bimetallic particles with cobalt to produce an alloy that leads to improvement in cobalt dispersion, which not only increases the catalytic performance of the FTS catalyst but also improves the resistance of the catalyst deactivation.8–10,12,13
A multi-shell catalyst was presented as a promoted catalyst that has a significant effect on the FTS reaction output due to its outstanding structural attributes.14 In this work, this catalytic structure was fabricated to achieve the maximum activity and selectivity in the presence of Ru in the mentioned FTS catalyst. Thus, the results from the promoted fabricated catalyst have been compared with the results from the catalyst without the ruthenium. The incorporation of a noble metal as a promoter alongside a base metal in the catalyst can be conducted via the formation of various nanostructures such as alloy, core–shell, and segregation, which are presented in the literature,15–18 but intertwining the promoter (Ru) and the base metal (Co) through a porous carbon shell in the core of a MOF-derived catalyst with a hollow void is a new approach in the present work.
On the other hand, for instance, the Shell Oil Company presented its Shell Middle Distillate Synthesis (SMDS) process with a two-stage reactor, which in the first stage utilizes a cobalt-based catalyst and in the second stage applies a noble metal catalyst to achieve the highest selectivity of the middle distillate fuel.3 Therefore, in this work, it is noteworthy to enhance our selectivity to the most valuable FTS product, jet fuel, in one stage with a promoted cobalt-based catalyst with Ru. The fuel utilized in gas turbine-powered aircraft is called aviation fuel or jet fuel and its ideal carbon chain ranges from C8 to C16.19
Hence, this study employs the three main tools of performance testing, characterization, and theoretical computation to evaluate the behavior of the catalyst precisely. The impact of Ru's existence on the performance of the nano-catalyst of Ru-Co@C(Z-d)@Void@CeO2 in FTS is investigated experimentally and theoretically by employing molecular dynamics, in particular, to evaluate the catalyst selectivity toward jet fuel. It is worthwhile to validate our results by utilizing the MD computational tools because it can consider all the atomic interactions and specifications in the presence of large numbers of particles that are included in our catalyst. Hence, in the current study, we applied this computational method to compare the formation tendency of some FTS products in the presence and absence of ruthenium.
2. Experimental and theoretical approach
2.1. Catalyst preparation
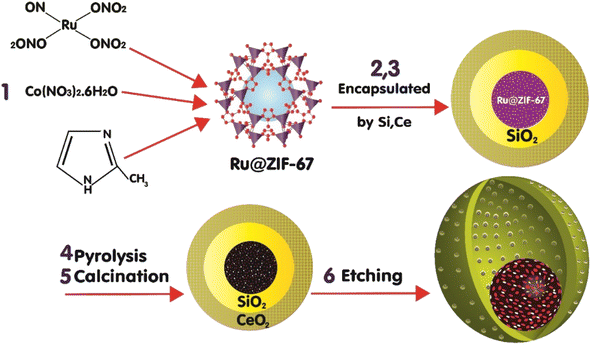
The MOF-derived catalyst with a hollow void between the core and outer shell of the ceria can be achieved by sacrificing the two coated shells.14 First, to synthesize ZIF-67, Co(NO3)2·6H2O was dissolved in 100 ml methanol, and a methanol solution containing 2-methylimidazole (MeIm) and CTAB was prepared. These solutions were mixed and aged, and the products were separated and dried.14 The cobalt and ruthenium NPs were encapsulated in the ZIF-67 matrix, a metal–organic framework (MOF), and then through the thermal treatment steps, pyrolysis (at the 883 K under N2 for 4 h) and calcination (in the air at the 673 K for 2 h),14,20 the ZIF-67 complex was converted to a porous carbon layer that encapsulated the cobalt nanoparticles and was doped with the ruthenium nanoparticles at the core of the catalyst.18,21 The insertion of Ru into the catalyst structures was implemented by adding ruthenium(III) nitrosyl nitrate (RuN4O10) as the precursor during the synthesis of the ZIF-67 with a volume ratio of 2% RuN4O10 of the entire solution.22 RuN4O10 was encapsulated by ZIF-67 crystals. The second sacrificed layer was formed by coating the ZIF-67 crystals with the silica in the catalyst fabrication steps; the outer shell of ceria was formed and thermal steps were conducted, and the silica layer was removed by chemical treatment, the etching step, with a solution of NaOH. The synthesis of ZIF-67@SiO2 involved dissolving ZIF-67 (0.5 g) in ethanol (100 ml) and adding CTAB (1% w) and deionized water (100 ml). Then, TEOS (5 ml) was added and stirred, and the sediment was separated and dried after 20 h.14 For the encapsulation of catalysts by ceria, ZIF-67@SiO2 (1 g) and Ce(NO3)3·6H2O (5 g) were dissolved in ethanol (20 ml) and mixed until ethanol evaporated.14The reduction step was implemented in the final step to activate the catalyst's active sites.12,18 Overall, the preparation procedure of the catalyst is depicted in Fig. 1. The presence of the ruthenium species during the ZIF-67 formation facilitates the segregation of the ionic cobalt species from the anionic nitrates toward the formation of the ZIF-67 crystals, increasingly.23,24 The formation of more ZIF-67 crystals leads to more atomic cobalt dispersion and paves the way for obtaining a high level of cobalt dispersion that is encapsulated in a carbon layer after catalyst thermal treatments in the form of small-sized easily reducible Co3O4. To compare the impact of Ru on the catalyst performance, the catalyst synthesis was conducted with and without the addition of ruthenium(III) nitrosyl nitrate, which led to the preparation of nano-catalysts with ruthenium (RNC), Ru-Co@C(Z-d)@Void@CeO2, and without Ru (NC), Co@C(Z-d)@Void@CeO2.
2.2. Structural characterization
To characterize the effective attributes of the catalyst, multiple characterization techniques were implemented. X-ray Diffraction (XRD) patterns were obtained by employing a Philips X'Pert MPD X-ray diffractometer with monochromatic Co Kα radiation (λ = 0.179026 nm). Crystalline size was calculated by utilizing the cobalt oxide XRD patterns with the Scherrer equation (2θ = 44.2°). The spectra for X-ray photoelectron spectroscopy (XPS) are obtained by utilizing an X-ray photoelectron spectrometer within the ultra-high vacuum (UHV) analysis system (SPECS) with the use of Al Ka radiation.Temperature Programmed Reduction (TPR) was conducted by flowing ten vol% H2/Ar (30 ml min−1) at a heating rate of 5 °C min−1 from ambient temperature to 900 °C. The TA Instruments SDT-Q600 was used to conduct the TGA test in a flow of Ar with a heating rate of 10 °C min−1 from ambient temperature to 1000 °C. The hydrogen temperature programmed desorption (H2-TPD) and oxygen titration test were conducted in a U-tube quartz reactor with the Quantachrome CHEMBET-3000 unit, which includes a thermal conductivity detector (TCD). The dispersion and degree of reduction (DOR) of cobalt NPs in each catalyst were evaluated by the H2-TPD/oxygen titration test. The cobalt crystalline diameter can be calculated from this test.14
The N2 adsorption–desorption isotherms, Brunauer–Emmett–Teller surface area (SBET), and the total pore volume (VP) of the catalysts were achieved by N2 physisorption at 77 K using Micromeritics Tristar 3020 on degassed samples. The catalysts' compositions were determined by Inductively Coupled Plasma Atomic Emission Spectroscopy (ICP-OES) Varian-735 and Field Emission Scanning Electron Microscopy (FE-SEM/EDX) TESCAN MIRA3. The FE-SEM/EDS mapping of the elemental composition was conducted using TESCAN MIRA3.
2.3. Technical description of MD simulation
To evaluate the experimental results, it is worth utilizing theoretical modeling and computational simulations. A quantitative measure of the favorability of a designed atomic process in the initial condition can be described with Gibbs free energy calculations. Hence, in this work, we employed molecular dynamics to compare the changes in the Gibbs free energy (ΔG) of paraffinic hydrocarbons as target products of the FTS in both catalysts. In addition, to evaluate the role of methane adsorption and desorption in the catalyst methanation tendency in the presence of Ru NPs, the methane adsorption, and desorption enthalpies on both catalysts were computed using MD.For this computational section, all simulations were performed using LAMMPS software. The simulation box and periodic boundary conditions were implemented in three directions.25 The atomic motion evolution of catalysts is defined by Newton's equation, where the atomic interactions between various nanostructures are defined by the interatomic potential concept. The atomic interactions between various atoms were determined by the Universal Force Field (UFF).26 The Lennard-Jones (LJ) equation was implemented to describe the nonbonded interactions.27 According to the following equation, the atomic forces among the atomic compounds contribute to the interatomic potential. The atomic force (Fi), position (ri), and momentum (Pi) of atoms can be evaluated using the following equations:28
 | (1) |
| Pi = mivi | (2) |
In the next step of the MD simulations procedure, the Nose–Hoover thermostat was implemented in atomic structures to set the initial conditions (temperature) in the MD simulation box.29,30 It was conducted on the atomistic systems at a fixed temperature of 300 K with 0.001 fs as a simulation time step. The total simulation time in modeled samples was set to 10 ns.
Eventually, by detecting the equilibrium phase in defined compounds, the NVE micro-canonical ensemble was implemented in the equilibrated system. With this setting, interatomic distances in various regions of the computational box changed and some bonds were lost with the passing MD time steps. Also, with decreasing interatomic distance, new interatomic bonds were created, and chemical reaction phenomena (chemisorption or compound formation) occurred. Therefore, calculating the enthalpy value in the forward and backward steps of this reaction introduces the enthalpy change value in our MD simulations. Furthermore, computationally, Gibbs free energy changes can be estimated with the ΔH − TΔS formalism. Therefore, by calculating enthalpy changes and estimating entropy parameters with this MD-base package, the Gibbs energy parameter is reported at a specific temperature. The entropy parameter was calculated using eqn (3):
 | (3) |
2.4. Catalytic testing
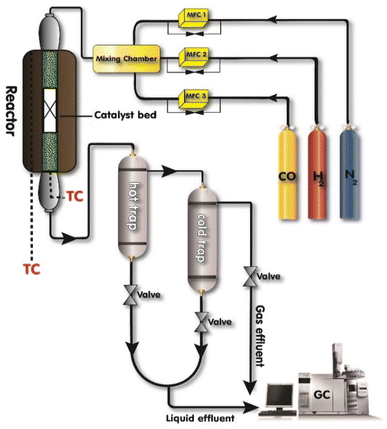
The catalyst performance in the FTS was evaluated using the setup in Fig. 2 which includes a mini vertical fixed bed reactor with the tube inner diameter of 10 mm. Here, 0.3 g of each catalyst was loaded into the reactor with the silicon carbide. First, the oxidation and reduction conditions for the catalyst were implemented by increasing the reactor temperature at the rate of 1 °C min−1 from room temperature to 748 K and then keeping it at the constant temperature for 12 h under hydrogen flow. The FTS tests were conducted after decreasing the reactor temperature to the operating conditions and achieving a steady-state condition. The outlet gas and liquid products were analyzed by separating them with two traps and directing them to an Agilent 7890A refinery gas analyzer (RGA) and an Agilent 7890A detailed hydrocarbon analyzer (DHA), respectively. The results were presented by calculating the CO conversion (XCO), the methane, C2–4, and C5+ selectivity (SC1, SC2–4, SC5+).14
 | (4) |
 | (5) |
| SC5+ = 1 − (SC1 + SC2 + SC3 + SC4) | (6) |
3. Results and discussion
3.1. Structural characterization
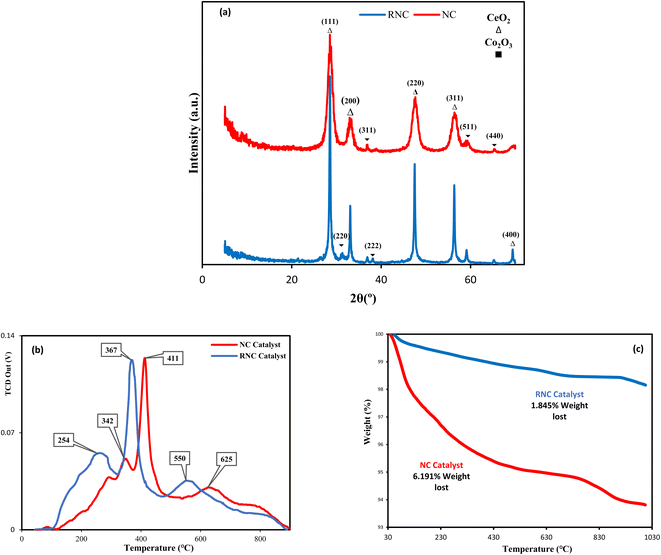
XRD was employed for each catalyst. Although the XRD patterns, shown in Fig. 3a, do not illustrate a noticeable distinction between both catalysts, the XRD peak intensity of the RNC catalyst is noticeably higher than the NC catalyst, which indicates that its crystallinity grows significantly in the presence of Ru. T. W. van Deelen et al.31 reported that the lower cobalt crystallinity leads to lower catalyst activity.Fig. 3a compares their XRD patterns and demonstrates that the ceria peaks for both catalysts were observed at 2θ = 28.61°, 33.19°, 47.33°, 56.42°, and 69.42°, which were respectively indexed by the (111), (200), (220), (311), and (400) ceria crystal planes, in good conformity with (JCPDS 01-075-0076). In contrast, the characteristic peak numbers of the Co3O4 in all the catalysts are not equal. The NC catalyst pattern illustrates the Co3O4 diffraction peaks at 2θ = 36.89°, 38.12°, 59.21°, and 65.12°, which are marked by the (311), (222), (440), and (511) crystal faces of Co3O4, respectively. In the RNC catalyst, the mentioned peaks were observed along with another peak at 2θ = 31.3° that was assigned to the (220) Co3O4 plane. All the mentioned Co3O4 crystal faces correspond well with (JCPDS 01-078-1969).
A reduction in the size of Co3O4 particles was observed with the addition of Ru as a promoter. B. G. Leendert et al.32 reported that the optimal cobalt crystallite size for the FTS is within the range of 6–8 nm; our work, Ru paves the way to achieving this in the RNC catalyst. The average size of cobalt NPs, which are derived from XRD, is given in Table 1, where the RNC catalyst presents a smaller size than the NC catalyst. The encapsulation of MNPs was conducted, to reach the high surface energy of MNPs, to minimize the system total energy.18 Therefore, the metal nanoparticles with smaller sizes have a greater tendency toward encapsulation due to higher surface energies, and subsequently, more nanocrystals are formed, which leads to higher crystallinity.33
| Sample | SBET (m2 g−1) | VP (cm3 g−1) | Da (nm) | Db (nm) | DOR% | Dispersion% |
|---|---|---|---|---|---|---|
| NC-V catalyst | 414 | 0.445 | 6.76 | 8.84 | 78.1 | 11.24 |
| RNC-V catalyst | 453.7 | 0.579 | 6.15 | 7.93 | 83.6 | 12.54 |
High-resolution XPS analysis was employed to investigate and identify the chemical states of Co and Ru in both the fresh and spent catalysts. The high-resolution Ru 3d spectra are shown in Fig. 4a and b, and peaks corresponding to Ru 3d5/2 and Ru 3d3/2 can be attributed to the presence of Ru3+ and Ru4+ species. In the fresh RNC catalyst, these peaks were observed at 282.4 eV and 284.2 eV, while in the spent catalyst, they appeared at higher energies of 283.2 and 285 eV.34 The high-resolution Co 2p spectra, shown in Fig. 4c–f, exhibit characteristic double peaks corresponding to Co 2p3/2 and Co 2p1/2. Additionally, two satellite peaks, attributed to the high-spin unpaired 3d electrons indicate the presence of Co2+ in this structure. The peaks related to the oxidation states of Co2+ and Co3+ were observed at 779.17 eV and 782.58 eV in the fresh catalysts and 780.25 eV and 783.7 eV in the spent catalysts, respectively. For the fresh and spent RNC samples, these values were lower, measuring 779.5 eV and 780.84 eV, and 780.1 eV and 782.2 eV, respectively. The analysis of Co3+/Co2+ ratios in both catalysts revealed that in fresh catalysts, the pattern is as follows: NC has a ratio of 0.8, while RNCE has a higher ratio of 1.47. In spent catalysts, the pattern is similar, with NC having a ratio of 0.78, and RNCE showing a higher ratio of 1.21.35
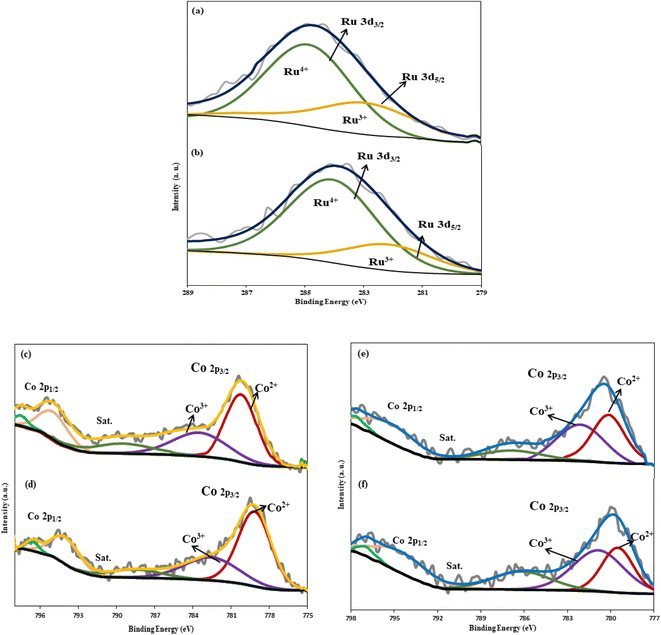 | ||
| Fig. 4 The high-resolution XPS spectra of Ru 3d for (a) the spent and (b) fresh RNC catalyst, Co 2p for (c) the spent and (d) fresh NC catalyst, and (e) the spent and (f) fresh RNC catalysts. | ||
Since Co3+ is the more active form among the cobalt species,36 it is worth noting that the Co3+/Co2+ values were higher in the presence of Ru in the RNC catalyst as compared to the NC catalyst in both their fresh and spent forms.
The temperature-programmed reduction in H2 (H2-TPR) profiles of both catalysts with and without Ru are depicted in Fig. 3b. Although the H2-TPR patterns of both catalyst samples indicate two prominent peaks that are related to the reduction of Co3O4 to cobalt in two steps, the TPR peaks of the Ru-Co-based catalyst occur at lower temperatures of 301 °C and 370 °C. Hence, the catalyst reducibility is significantly enhanced by the addition of Ru, which is in accordance with the other studies.10,37,38 Moreover, the third peak also implies the reduction of ceria's surface oxygens, while Ru at the RNC catalyst paves the way towards the lower reduction temperature, consistent with the report by A. Trovarelli.39 The vacant d-orbitals of Ru atoms exert a strong interaction with the Co atoms in cobalt oxides NPs and shift their electronic density toward Ru atoms. As a result, the electronic density of cobalt oxides' oxygen atoms was reduced, and their tendency toward oxygen dissociation from cobalt oxides via electronic charge sorption from hydrogen molecules was enhanced significantly, which led to a more appropriate reduction of the RNC catalyst's Co NPs. In addition, to evaluate the thermal resistance of the catalyst samples, thermogravimetric analysis (TGA) was conducted. Although the results of TGA characterization depicted in Fig. 3c illustrate that both catalysts have prominent thermal stability due to their internal hollow void that acts as a thermal resistance, the weight loss of the NC catalyst is more than three times that of the RNC catalyst. During the TGA analysis, the RNC catalyst lost less than 2 percent of its weight at 1000 °C, which indicates that the thermal resistance of the catalyst was dramatically enhanced by utilizing the promoter of Ru in line with the other studies.40,41 According to other studies,42,43 the catalyst decomposition during the temperature rise occurs when bulk oxygen ions of metal oxides are transferred to the surface sites; therefore, in the RNC catalyst, the strong Ru NPs-metal oxides interactions prevent the transfer of metal oxide bulk oxygen ions to the surface and enhance the catalyst thermal stability.
After calcination, a nano-porous coating of carbon encapsulates the Co3O4 particles but ruthenium can reduce a noticeable amount of them. Therefore, the encapsulation of the Co NPs in small pores intensifies the cobalt dispersion in the presence of a ruthenium promoter, and a great value of DOR is also obtained.16 The H2-TPD and oxygen titration can be utilized to evaluate the dispersion of Co active sites and the average size of cobalt particles, which are listed in Table 1. The results illustrate that the Co-active sites were dispersed more effectively at the Ru-doped catalyst with a percentage of 12.54, and also a higher DOR was provided at the RNC catalyst in comparison with the NC catalyst, which is 83.6%. In conformity with XRD results, the results that were evaluated from the H2-TPD analysis demonstrated that the size of Co NPs was gradually reduced to the optimal size distribution32 in the presence of Ru. The size reduction of the Co NPs indicated that the presence of Ru in the porous carbon shell at the core of the catalyst can provide more cobalt phase exchange between Co3O4 and cobalt silicate, even in small sizes; the cobalt dispersion and accessibility will also improve.
The results (Fig. 5a and b) illustrate that the adsorption isotherm of both catalysts is type IV with type H3 hysteresis. Although there is no noticeable distinction between the values of SBET and VP in both catalysts, the RNC catalyst demonstrated approximately 11% higher SBET and 32% higher pore volume. The strong interaction between Ru and Co particles not only promotes the DOR and Co dispersion but the SBET and VP of the catalyst were also enhanced in the presence of Ru by facilitating the separation of Co particles from the silica through the etching step.
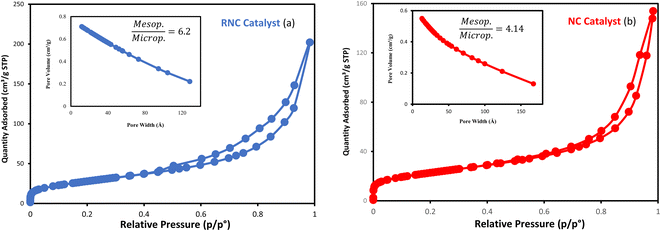 | ||
| Fig. 5 N2-adsorption/desorption isotherm and BJH adsorption cumulative pore volume of the RNC catalyst (a) and NC catalyst (b). | ||
The particle size distribution of catalysts is presented in Fig. 6a and b. Following the etching process, the TEM catalysts' images exhibited brighter areas surrounding the darker central core of Co3O4@C. These bright areas are related to the partial removal of the silica layer within the catalyst structure, which is more reflective than other parts.14 The etching treatment does not eliminate the silica layer, rather, it selectively removes silica from this layer, resulting in brighter regions in the TEM images. The phenomenon of cavity formation was further confirmed by BET analysis, which shows an increase in the sample's surface area due to the etching effect. This increase in surface area is responsible for the formation of internal void spaces within these catalysts.14
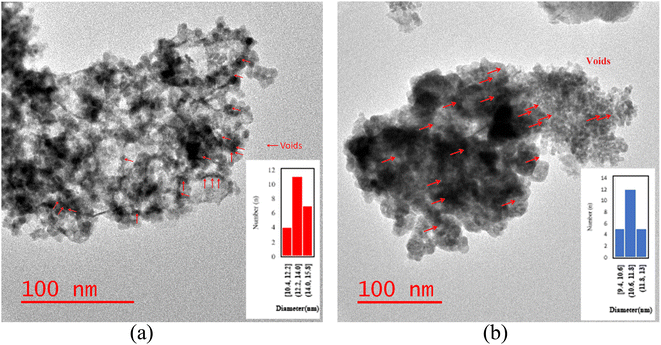 | ||
| Fig. 6 The TEM images and the particle size distribution histograms of the (a) NC catalyst and (b) RNC catalyst. | ||
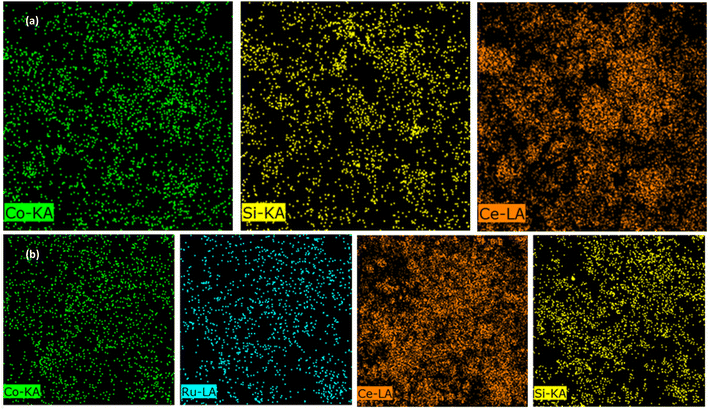
To evaluate the chemical composition of both catalysts, FE-SEM/EDX and ICP-OES were employed; the results are listed in Table 2 and they reveal the presence of Ru in the RNC catalyst. The small distinction of the Co percentage, which is illustrated by the ICP-OES, can be derived from the impact of Ru on the conversion of cobalt silicate to Co3O4 during the calcination step.23 Hence, Ru is the reason for the higher cobalt loading in the RNC catalyst versus the NC catalyst because it can pave the way to achieving more accessible cobalt particles that can be detected through the ICP-OES. The elemental mapping of both catalysts is depicted in Fig. 7a and b, revealing the distribution of major elements.
| Sample | Elemental content (FE-SEAM/EDX) w% | Elemental content (ICP-OES) w% | ||||||
|---|---|---|---|---|---|---|---|---|
| Ce | Si | Co | Ru | Ce | Si | Co | Ru | |
| RNC catalyst | 71.2 | 4.26 | 24.07 | 0.47 | 66.29 | 3.8 | 29.33 | 0.58 |
| NC catalyst | 69.55 | 12.26 | 18.19 | — | 60.6 | 11.6 | 27.8 | — |
3.2. Theoretical approach
ΔG has been used as a catalytic descriptor in theoretical studies of catalyst activities.44–46 The Gibbs energy exhibits the thermodynamical formation tendency of paraffinic hydrocarbons using our FTS catalysts, with the lowest value representing the most suitable catalyst for their formation from an energy viewpoint. Furthermore, thermodynamic data can be useful in FTS catalyst design due to its revealing the minimum energy level. To simplify the computations, some paraffins were chosen as the agents for a wide range of FTS products.Fig. 8a illustrates that the ΔG values of all the paraffinic hydrocarbons in the RNC catalyst are smaller as compared to the NC catalyst. As a result, the RNC catalyst is more progressive for paraffin formation than the NC catalyst. In addition, the maximum distinctions between the ΔG of paraffin hydrocarbons in both catalysts belong to the hydrocarbons with 11 and 15 carbons. Among all the modeled hydrocarbons except methane, heptane has the lowest difference value of ΔG of formation between RNC and NC catalysts (0.06 kcal mol−1). Hence, it was predicted that the selectivity towards jet fuel (C8–C16) at the RNC catalyst would be greater in comparison to the FTS products, in particular, liquid fuels. Besides, from a thermodynamic point of view, methane is the most probable product in FTS, which is according to the reports by Davies et al. and Zaffran et al.,47,48 and the ΔG results that were extracted from MD computations confirm this. The MD simulation results illustrate that ΔG for methane formation, 0.29 and 0.26 kcal mol−1 in NC and RNC catalysts, respectively, have the lowest values and Ru boosts its formation. Hence, the MD results predict that the methane selectivity in FTS would be higher in the RNC catalyst than in the NC catalyst. In this regard, to implement a meticulous evaluation of the catalysts' methanation tendencies, the methane adsorption and desorption enthalpy on both catalysts were compared by computation. Fig. 8b indicates that in the presence of Ru, the methane adsorption enthalpy on the catalyst does not have a noticeable distinction from the catalyst in the absence of Ru. Although the negative sign of the high methane adsorption enthalpy values in both catalysts reveals that the methane re-adsorption pathway onto these catalysts is noticeable, it is not the dominant agent for the methanation tendency difference between these catalysts. In contrast, the methane desorption enthalpy in the NC catalyst 2 kcal mol−1 is higher than the RNC catalyst. Hence, it indicates that although Ru in the cobalt-based catalyst modifies the FTS product distribution selectivity toward the jet fuel range, it gradually promotes the methanation tendency by facilitating methane desorption.
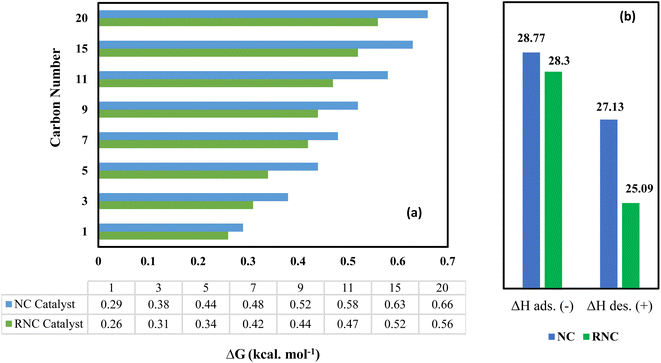 | ||
| Fig. 8 Gibbs free energy of paraffin hydrocarbons (a) and methane adsorption and desorption enthalpy in both catalysts (b) were computed by the MD simulation. The methane adsorption sign is negative. | ||
3.3. Performance testing
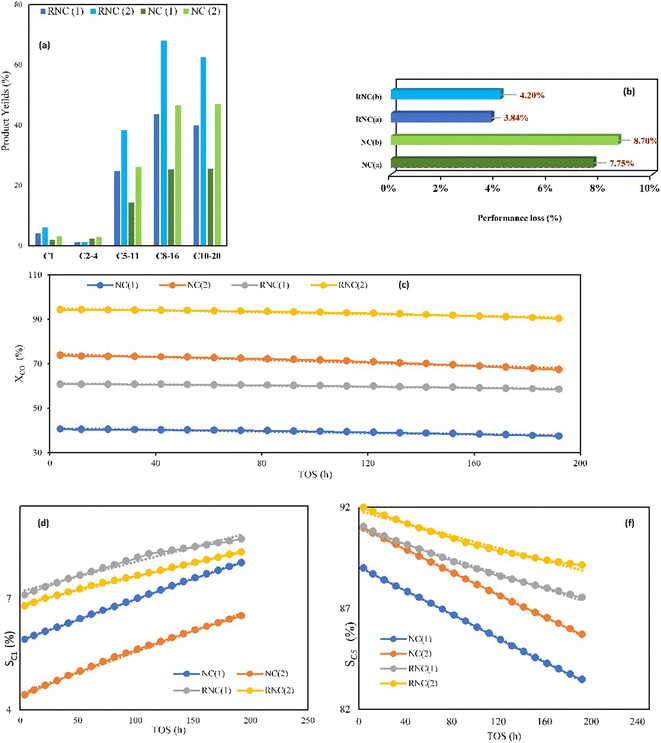
The FTS catalytic testing of both catalysts was performed at the two pressures of 12 and 17.5 bar and feed ratios of 1.6 and 2. The CO conversion (XCO) to longer chain hydrocarbons with more than five carbons (SC5+) and yields are listed in Table 3, which illustrate 56% and 59.5% growth, respectively, with the Ru-doped catalyst (RNC) in comparison with the NC catalyst that is achieved at low pressure and H2/CO ratio of 1.6. In addition, at the higher pressure and feed ratio of 2, while the XCO and SC5+ were enhanced for both catalysts, the RNC catalyst offered higher values of 90.33% and 92%, respectively. Besides, the cobalt time yield (CTY) and turnover frequency (TOF) values in Table 3 exhibited higher values for the RNC catalyst as compared to the NC catalyst which highlights the impact of Ru NPs on the catalyst performance. Although the SC5+ values for both catalysts do not have noticeable distinctions, the yield of C5+ clarifies their productivity in achieving heavier hydrocarbons. Table 4 demonstrates that the yields of C5+ (YC5+) with the RNC catalyst at both operating conditions of 59.5% and 35.7% are higher than in the NC catalyst. Table 4 also represents the carbon balance of FTS product yields for both catalysts under the two aforementioned operating conditions. Fig. 9a compares their yields in producing diverse FTS products based on their carbon numbers under both operative conditions. In compliance with the MD computations, Fig. 9a clarifies that the RNC catalyst paves the way to producing a higher percentage of jet fuel (C8–C16). The MD computation results include lower ΔG for the heavier hydrocarbons, in particular C11 and C15, in the RNC catalyst than the NC catalyst. Although Fig. 9a exhibits an equal yield of jet fuel (C8–C16) and diesel (C10–C20) in the NC catalyst, its selectivity toward the hydrocarbons with the jet fuel carbon number range is higher due to the carbon number range in diesel being wider. The same pattern can be considered for the RNC catalyst, which highlights its selectivity toward the jet fuel significantly. Although the RNC catalyst exhibits higher XCO and YC5+ than the NC catalyst, it intensifies the selectivity towards methane up to 7.1% which is in accordance with the other reports.9,49 MD simulation illustrated the same trend toward methane selectivity for the Ru-doped catalyst.| Sample | Pres. (bar) | H2/CO | CO conv.% | CTY (10−4 molCO g−1Co s−1) | TOF (10−3 s−1) | SC1% | SC2–4% | SC5+% |
|---|---|---|---|---|---|---|---|---|
| RNC catalyst | 12 | 1.6 | 58.47 | 6.1 | 9.8 | 7.1 | 1.85 | 91.05 |
| RNC catalyst | 17.5 | 2 | 90.33 | 17 | 21.14 | 6.8 | 1.2 | 92 |
| NC catalyst | 12 | 1.6 | 37.4 | 5.1 | 7.47 | 5.1 | 5.9 | 89 |
| NC catalyst | 17.5 | 2 | 67.3 | 12 | 18.81 | 4.6 | 4.4 | 91 |
| CO(out)% | CO2% | C1% | C2–4% | C5–10% | C11–20% | C20+% | C5+% | |
|---|---|---|---|---|---|---|---|---|
| RNC (1) | 41.53 | 0.02 | 4.15 | 1.05 | 18.60 | 34.40 | 0.25 | 53.22 |
| RNC (2) | 9.67 | 0.02 | 6.14 | 1.08 | 28.45 | 54.47 | 0.17 | 83.09 |
| NC (1) | 62.6 | 0.03 | 1.90 | 2.20 | 10.85 | 22.30 | 0.12 | 33.27 |
| NC (2) | 32.7 | 0.04 | 3.09 | 2.96 | 19.90 | 41.17 | 0.14 | 61.21 |
Following Cheng et al.,50 the small Co crystallite size of the RNC catalyst, in comparison with the NC, can strongly enhance the adsorption of the syngas molecules and promote the formation of intermediate species towards the hydrocarbon chain growth. Moreover, the cobalt reducibility enhancement in Ru-doped catalyst has a significant impact on the formation of more active cobalt sites, which subsequently improves the FTS catalyst performance51 that is observable for RNC in contrast to the NC catalyst. Moreover, although the Ru NPs promote methane selectivity, the higher DOR and Co NPs dispersion in the presence of ruthenium suppresses the methane production growth and strongly enhances the C–C bond formation to the carbon chain growth. In conformity with the MD computations, the FT catalytic test results illustrate that the methane production growth, as compared to the other FTS products, in the presence of Ru is lower than in its absence.
From the viewpoint of stability, Fig. 9b demonstrates the catalyst performance loss percentage, which was evaluated by calculating the CO conversion reduction percentage during 192 h time of stream (TOS) for both catalysts under the operative conditions mentioned above at the GHSV of 2000 h−1 and 518 K. Fig. 9c–f indicate the trend of changes in XCO, SC1, and SC5+ for both catalysts. The results reveal that the RNC catalyst in both conditions has remarkable performance stability with a lower performance loss that is less than half the value of NC. The TGA results pattern showed equal conformity with these results due to the lower weight loss of the RNC catalyst, which is one-third of the NC catalyst. Hence, the presence of Ru promotes the catalyst stability as compared to the catalyst without it.
4. Conclusion
The promoting effect of ruthenium on our catalyst, in particular, the reducibility, has paved the way for achieving greater dispersion and degree of reduction, which led to a better catalytic performance in comparison with the catalyst without the ruthenium promoter. The XRD and H2-TPD results illustrated that the crystallinity and the size of cobalt oxide in the Ru-doped catalyst were in the higher and lower range, respectively, which boosted the activity of the catalyst. The ΔG values of paraffin in both simulated catalysts were evaluated by MD computations and revealed that the catalyst with the Ru promoter boosted their formation ratios, which was a strong confirmation for our catalytic test results. Moreover, the catalytic test results indicated that the catalyst in the presence of Ru had a higher jet fuel production yield than the other FTS product range, which was in good agreement with MD computations. The Ru-doped Co-based catalyst significantly intensified the catalyst stability.Author contributions
Masoud Safari: writing – original drafting, data curation, investigation, software, validation, formal analysis, visualization. Ali Haghtalab: conceptualization, methodology, supervision, resources, writing – reviewing and editing, project administration, software, funding acquisition. Farzaneh Arabpour Roghabadi: formal analysis.Conflicts of interest
The authors declare that they have no known competing financial interests or personal relationships that could have appeared to influence the work reported in this paper.Acknowledgements
The authors greatly appreciate the research grant of the vice president of research and technology of Tarbiat Modares University.References
- T. Zhang, X. Sun, X. Li, H. Liu and J. Hong, Drivers of spatiotemporal variations in traditional heating under carbon neutrality commitment: evidence from China at city-level, J. Cleaner Prod., 2023, 406, 137142 CrossRef CAS.
- W. Zhou, et al., New horizon in C1 chemistry: breaking the selectivity limitation in transformation of syngas and hydrogenation of CO2 into hydrocarbon chemicals and fuels, Chem. Soc. Rev., 2019, 48(12), 3193–3228 RSC.
- X. Li, et al., Enhanced gasoline selectivity through Fischer-Tropsch synthesis on a bifunctional catalyst: effects of active sites proximity and reaction temperature, Chem. Eng. J., 2021, 416, 129180 CrossRef CAS.
- M. R. Axet and K. Philippot, Catalysis with colloidal ruthenium nanoparticles, Chem. Rev., 2020, 120(2), 1085–1145 CrossRef CAS PubMed.
- S. Lyu, et al., Stabilization of ε-iron carbide as high-temperature catalyst under realistic Fischer–Tropsch synthesis conditions, Nat. Commun., 2020, 11(1), 1–8 CrossRef PubMed.
- Y. Fatih, U. Burgun, A. Sarioglan and H. Atakül, Effect of sodium incorporation into Fe-Zn catalyst for Fischer-Tropsch synthesis to light olefins, Mol. Catal., 2023, 535, 112866 CrossRef CAS.
- Z. Qi, L. Chen, S. Zhang, J. Su and G. A. Somorjai, A mini review of cobalt-based nanocatalyst in Fischer-Tropsch synthesis, Appl. Catal., A, 2020, 602, 117701 CrossRef CAS.
- A. Y. Khodakov, W. Chu and P. Fongarland, Advances in the development of novel cobalt Fischer–Tropsch catalysts for synthesis of long-chain hydrocarbons and clean fuels, Chem. Rev., 2007, 107(5), 1692–1744 CrossRef CAS PubMed.
- Y. Zhang, et al., Ru/TiO2 catalysts with size-dependent metal/support interaction for tunable reactivity in Fischer–Tropsch synthesis, ACS Catal., 2020, 10(21), 12967–12975 CrossRef CAS.
- J. Hong, P. A. Chernavskii, A. Y. Khodakov and W. Chu, Effect of promotion with ruthenium on the structure and catalytic performance of mesoporous silica (smaller and larger pore) supported cobalt Fischer–Tropsch catalysts, Catal. Today, 2009, 140(3–4), 135–141 CrossRef CAS.
- N. E. Tsakoumis, M. Rønning, Ø. Borg, E. Rytter and A. Holmen, Deactivation of cobalt based Fischer–Tropsch catalysts: a review, Catal. Today, 2010, 154(3–4), 162–182 CrossRef CAS.
- W. Chu, P. A. Chernavskii, L. Gengembre, G. A. Pankina, P. Fongarland and A. Y. Khodakov, Cobalt species in promoted cobalt alumina-supported Fischer–Tropsch catalysts, J. Catal., 2007, 252(2), 215–230 CrossRef CAS.
- J.-C. Zhang, B.-H. Ge, T.-F. Liu, Y.-Z. Yang, B. Li and W.-Z. Li, Robust ruthenium-saving catalyst for high-temperature carbon dioxide reforming of methane, ACS Catal., 2019, 10(1), 783–791 CrossRef.
- M. Safari, A. Haghtalab and F. A. Roghabadi, A hollow void catalyst of Co@C(Z-d)@void@CeO2 for enhancing the performance and stability of the Fischer–Tropsch synthesis, RSC Adv., 2023, 13(33), 23223–23235, 10.1039/D3RA04884E.
- L. Guczi, G. Boskovic and E. Kiss, Bimetallic cobalt based catalysts, Catal. Rev.: Sci. Eng., 2010, 52(2), 133–203 CrossRef CAS.
- C. Gao, F. Lyu and Y. Yin, Encapsulated metal nanoparticles for catalysis, Chem. Rev., 2020, 121(2), 834–881 CrossRef PubMed.
- Q. Zhang, I. Lee, J. B. Joo, F. Zaera and Y. Yin, Core–shell nanostructured catalysts, Acc. Chem. Res., 2013, 46(8), 1816–1824 CrossRef CAS PubMed.
- M. Safari and V. Nobakht, Encapsulation of Metal Nanoparticles (MNPs) as Catalyst, in Nanocomposite Materials for Biomedical and Energy Storage Applications, IntechOpen, 2022 Search PubMed.
- B. Yao, et al., Transforming carbon dioxide into jet fuel using an organic combustion-synthesized Fe-Mn-K catalyst, Nat. Commun., 2020, 11(1), 6395 CrossRef CAS PubMed.
- X. Sun, et al., Manufacture of highly loaded silica-supported cobalt Fischer–Tropsch catalysts from a metal organic framework, Nat. Commun., 2017, 8(1), 1680 CrossRef PubMed.
- X. Sun, et al., Manufacture of highly loaded silica-supported cobalt Fischer–Tropsch catalysts from a metal organic framework, Nat. Commun., 2017, 8(1), 1–8 CrossRef PubMed.
- P. Lara, K. Philippot and B. Chaudret, Organometallic ruthenium nanoparticles: a comparative study of the influence of the stabilizer on their characteristics and reactivity, ChemCatChem, 2013, 5(1), 28–45 CrossRef CAS.
- J. Hong, et al., Speciation of ruthenium as a reduction promoter of silica-supported Co catalysts: a time-resolved in situ XAS investigation, ACS Catal., 2015, 5(2), 1273–1282 CrossRef CAS.
- Y. Shao and H. C. Zeng, Pt, Ir, Ru, and Rh Nanoparticles Supported on ZIF-67 Nanocubes for Evaluation of Hydrogen Spillover Ability of Noble Metals, ACS Appl. Nano Mater., 2021, 4(6), 6030–6044 CrossRef CAS.
- W. Mai, et al., Prism-based DGTD with a simplified periodic boundary condition to analyze FSS With D 2n symmetry in a rectangular array under normal incidence, IEEE Antennas Wirel. Propag. Lett., 2019, 18(4), 771–775 Search PubMed.
- A. K. Rappé, C. J. Casewit, K. Colwell, W. A. Goddard III and W. M. Skiff, UFF, a full periodic table force field for molecular mechanics and molecular dynamics simulations, J. Am. Chem. Soc., 1992, 114(25), 10024–10035 CrossRef.
- J. E. Jones, On the determination of molecular fields.—I. From the variation of the viscosity of a gas with temperature, Proc. R. soc. Lond. Ser. A-Contain. Pap. Math. Phys. Character, 1924, 106(738), 441–462 CAS.
- D. Frenkel, B. Smit and M. A. Ratner, Understanding Molecular Simulation: From Algorithms to Applications, Academic Press, San Diego, 1996 Search PubMed.
- S. Nosé, A unified formulation of the constant temperature molecular dynamics methods, J. Chem. Phys., 1984, 81(1), 511–519 CrossRef.
- W. G. Hoover, Canonical dynamics: equilibrium phase-space distributions, Phys. Rev. A, 1985, 31(3), 1695 CrossRef PubMed.
- T. Van Deelen, H. Yoshida, R. Oord, J. Zečević, B. Weckhuysen and K. De Jong, Cobalt nanocrystals on carbon nanotubes in the Fischer-Tropsch synthesis: impact of support oxidation, Appl. Catal., A, 2020, 593, 117441 CrossRef CAS.
- B. G. Leendert, et al., Cobalt particle size effects in the Fischer− Tropsch reaction studied with carbon nanofiber supported catalysts, J. Am. Chem. Soc., 2006, 128(12), 3956–3964 CrossRef PubMed.
- C. C. Amoo, et al., Fabricating Fe Nanoparticles Embedded in Zeolite Y Microcrystals as Active Catalysts for Fischer–Tropsch Synthesis, ACS Appl. Nano Mater., 2020, 3(8), 8096–8103 CrossRef CAS.
- H. Wang, X. Li, Q. Ruan and J. Tang, Ru and RuO x decorated carbon nitride for efficient ammonia photosynthesis, Nanoscale, 2020, 12(23), 12329–12335 RSC.
- X. Cao, S. Zhao, X. Liu, X. Zhu, Y. Gao and Q. Liu, CeO2/Co3O4@ N-doped hollow carbon microspheres with improved peroxidase-like activity for the determination of quercetin, Anal. Bioanal. Chem., 2022, 414(16), 4767–4775 CrossRef CAS PubMed.
- J. Wang, et al., Catalytic oxidation of volatile organic compound over cerium modified cobalt-based mixed oxide catalysts synthesized by electrodeposition method, Appl. Catal., B, 2020, 271, 118941 CrossRef CAS.
- N. Tsubaki, S. Sun and K. Fujimoto, Different functions of the noble metals added to cobalt catalysts for Fischer–Tropsch synthesis, J. Catal., 2001, 199(2), 236–246 CrossRef CAS.
- N. Zhao, Y. Chen, X. Li, T. Chen, M. U. Nisa and Z. Li, Modulating Co reduction degree and Fischer-Tropsch synthesis performance by reducing cobalt silicate at different conditions, Mol. Catal., 2023, 549, 113483 CrossRef CAS.
- A. Trovarelli, Catalytic properties of ceria and CeO2-containing materials, Catal. Rev., 1996, 38(4), 439–520 CrossRef CAS.
- Z. Liu, et al., Thermally Stable RuOx–CeO2 Nanofiber Catalysts for Low-Temperature CO Oxidation, ACS Appl. Nano Mater., 2020, 3(8), 8403–8413 CrossRef CAS.
- C. Huang, et al., Ru/La2O3 catalyst for ammonia decomposition to hydrogen, Appl. Surf. Sci., 2019, 476, 928–936 CrossRef CAS.
- S. Kaliaguine, A. Van Neste, V. Szabo, J. Gallot, M. Bassir and R. Muzychuk, Perovskite-type oxides synthesized by reactive grinding: part I. Preparation and characterization, Appl. Catal., A, 2001, 209(1–2), 345–358 CrossRef CAS.
- J.-Y. Luo, et al., Mesoporous Co3O4–CeO2 and Pd/Co3O4–CeO2 catalysts: synthesis, characterization and mechanistic study of their catalytic properties for low-temperature CO oxidation, J. Catal., 2008, 254(2), 310–324 CrossRef CAS.
- P. Chen, et al., Phase-transformation engineering in cobalt diselenide realizing enhanced catalytic activity for hydrogen evolution in an alkaline medium, Adv. Mater., 2016, 28(34), 7527–7532 CrossRef CAS PubMed.
- X. Kong, et al., Free-standing two-dimensional Ru nanosheets with high activity toward water splitting, ACS Catal., 2016, 6(3), 1487–1492 CrossRef CAS.
- J. Su, Y. Yang, G. Xia, J. Chen, P. Jiang and Q. Chen, Ruthenium-cobalt nanoalloys encapsulated in nitrogen-doped graphene as active electrocatalysts for producing hydrogen in alkaline media, Nat. Commun., 2017, 8(1), 1–12 CrossRef CAS PubMed.
- I. Davies and K. P. Möller, Development of a kinetic model for low temperature Fischer-Tropsch synthesis, Chem. Eng. Sci., 2021, 241, 116666 CrossRef CAS.
- J. Zaffran and B. Yang, Theoretical Insights into the Formation Mechanism of Methane, Ethylene and Methanol in Fischer-Tropsch Synthesis at Co2C Surfaces, ChemCatChem, 2021, 13(11), 2674–2682 CrossRef CAS.
- P. Kangvansura, H. Schulz, A. Suramitr, Y. Poo-arporn, P. Viravathana and A. Worayingyong, Reduced cobalt phases of ZrO2 and Ru/ZrO2 promoted cobalt catalysts and product distributions from Fischer–Tropsch synthesis, Mater. Sci. Eng. B, 2014, 190, 82–89 CrossRef CAS.
- Q. Cheng, et al., Confined small-sized cobalt catalysts stimulate carbon-chain growth reversely by modifying ASF law of Fischer–Tropsch synthesis, Nat. Commun., 2018, 9(1), 1–9 CrossRef PubMed.
- J.-S. Girardon, E. Quinet, A. Griboval-Constant, P. Chernavskii, L. Gengembre and A. Khodakov, Cobalt dispersion, reducibility, and surface sites in promoted silica-supported Fischer–Tropsch catalysts, J. Catal., 2007, 248(2), 143–157 CrossRef CAS.
| This journal is © The Royal Society of Chemistry 2023 |

