 Open Access Article
Structural modulation of insulin by hydrophobic and hydrophilic molecules†
Shahnaz Begum a,
Hasan Parvej
 a,
Ramkrishna Daluia,
Swarnali Paula,
Sanhita Maitya,
Nayim Sepay
 b,
Mohd Afzalc and
Umesh Chandra Halder
 *a
*a
aDepartment of Chemistry, Jadavpur University, Kolkata-700032, India. E-mail: juumesh.halder@gmail.com
bDepartment of Chemistry, Lady Brabourne College, Kolkata-700017, India
cDepartment of Chemistry, College of Science, King Saud University, Riyadh 11451, Saudi Arabia
First published on 21st November 2023
Abstract
In the bloodstream, insulin interacts with various kinds of molecules, which can alter its structure and modulate its function. In this work, we have synthesized two molecules having extremely hydrophilic and hydrophobic side chains. The effects of hydrophilic and hydrophobic molecules on the binding with insulin have been investigated through a multi-spectroscopic approach. We found that hydrophilic molecules have a slightly higher binding affinity towards insulin. Insulin can bind with the hydrophilic molecules as it binds glucose. The high insulin binding affinity of a hydrophobic molecule indicates its dual nature. The hydrophobic molecule binds at the hydrophobic pocket of the insulin surface, where hydrophilic molecules interact at the polar surface of the insulin. Such binding with the hydrophobic molecule perturbs strongly the secondary structure of the insulin much more in comparison to hydrophilic molecules. Therefore, the stability of insulin decreases in the presence of hydrophobic molecules.
Introduction
Protein structure is very sensitive to their microenvironments.1 Structural alteration of proteins is often observed due to several factors (modulators) like pH,2 temperature,2 salt concentration,3 and different types of small molecules.4,5 This change in the presence of physical and chemical modulators is significant because it may change the function of the proteins.6,7 The study of the modulators' interactions with proteins has drawn attention from the scientific community.8,9Human insulin is a protein hormone in the blood that regulates blood sugar levels.10,11 Depending upon the exposure and availability of it in the body, several medical conditions like hypertension,12 coronary heart disease,13 stroke,14 cancer,15 and type II diabetes16 are widespread nowadays. The small monomeric insulin contains fifty-one amino acids and is divided into two α-helical structures, joined together by three disulfide bonds (intra-chain and inter-chain).17 This small monomeric form of insulin is highly unstable.18,19 Again, insulin is one of the serum proteins that commonly interact with the polar poly-hydroxyl group containing molecules like glucose. However, in the serum, many hydrophobic molecules can affect the structure and function of the insulin. Thus, the structure of insulin may change in the presence of diverse molecules in the blood and these compound can initiate insulin-related diseases. Therefore, an investigation of the effect of molecules with hydroxyl groups and hydrophobic groups on the insulin's structure is highly essential.
Protein-small molecule interaction studies are used to investigate the structural effect on proteins in the presence of different microenvironments.20,21 The tuning of the microenvironment is possible through the proper choice of small molecules.22,23 Hydrophilic to hydrophobic molecules can be synthesized from simple organic reactions. The reaction of an aldehyde with primary amine is one of the simple organic reactions used to join two fragments through imine bond formation.24 The products of the reaction are known as Schiff's base.24 With the proper choice of the substituent attached to the amine and aldehyde part, the hydrophilicity and hydrophobicity of the molecule can be tunable. For this reason, Schiff's base is used in very diverse fields of science like coordination chemistry,25,26 hydrogels,27,28 sensing,29 analytical chemistry, electronics, optics25 etc.
In this study, we have synthesized one hydrophobic Schiff's base (E)-2-((tert-butylimino) methyl)-6-methoxyphenol and one hydrophilic Schiff's base (E)-2-((2-hydroxy-3-methoxybenzylidene)amino)-2-(hydroxymethyl)propane-1,3-diol. The interactions of these two molecules with insulin have been investigated here. Therefore, it will provide a scope to monitor the structure of insulin in two opposite microenvironments.
Results and discussion
Synthesis of Schiff's base and choice of compounds
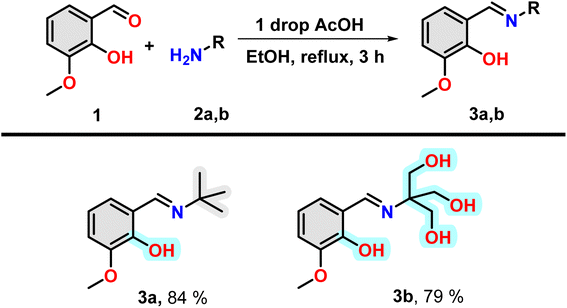
Insulin binds with glucose, which is a polar poly-hydroxy compound. For this reason, a poly-hydroxy compound is required to be designed in our study as one of the compounds. To understand the effect of binding a hydrophobic molecule to insulin, a similar molecule without the hydroxyl group has been designed. It is found that electron-rich aromatic molecules have unique protein binding ability. For this reason, the attachment of said poly-hydroxyl group containing and hydrophobic moiety with an aromatic moiety having a hydroxyl group separately will be one of the choices for the fulfilment of the target of investigation. For the easy joining of these two moieties, Schiff bases formation reaction is a convenient choice. Thus, two amine compounds 2-amino-2-(hydroxymethyl)propane-1,3-diol and 2-methylpropan-2-amine were selected for a poly-hydroxyl and hydrophobic moiety, respectively. Now, one electron-rich aldehyde is required for Schiff base formation. In this case, ortho-vanillin is the best because it contains one ortho-hydroxy and meta-methoxy group along with aldehyde at the benzene ring.Under refluxing conditions in dry ethanol, the reaction between ortho-vanillin (1) and aliphatic amine (2) yielded corresponding Schiff bases. With the addition of one drop of glacial acetic acid, this reaction proceeded for three hours. When tert-butyl amine (2a) and 2-amino-2-(hydroxymethyl)propane-1,3-diol (2b) were employed in the reaction, high-yield production of compound 3a and 3b was achieved respectively (Scheme 1). The compounds were characterized through the use of 1H NMR.
It is to be noted that the compound 3a have one hydrogen bond forming group, i.e. hydroxyl group and have hydrophobic t-Bu group and an aromatic ring (grey highlighted). Therefore, the molecule is hydrophobic in nature. However, in the case of 3b, the presence of three OH group in the nitrogen containing part instead of t-Bu group, make this region hydrophilic (cyan highlighted). Therefore, compound 3a and 3b will offer purely hydrophobic and largely hydrophilic environment in the vicinity of insulin.
Spectroscopic study of the Schiff base compounds
The 3b is a hydrophilic molecule, and it shows self-aggregation in the experimental conditions at high concentrations. In this case, the compound shows aggregation-induced emission as the fluorescence intensity increases slowly with 3b concentration (Fig. S4C and D†). However, at low concentrations (2–25 μM), there is also a linear relation between concentration and 3b fluorescence intensity. Therefore, at lower concentrations of both compounds, the self-aggregation of them cannot proceed rapidly.
Study of interactions of the Schiff bases with human insulin
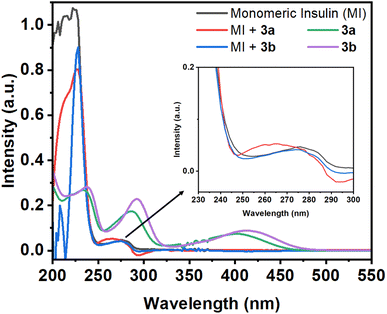 | ||
| Fig. 1 Absorption spectra of monomeric insulin (10 μM in pH 2.0) in the absence and presence of Schiff base compounds 3a and 3b. Absorption spectra of 3a and 3b (50 μM in pH 2.0). | ||
If the environment of the Tyr residues of protein changes during the interactions with small molecules, then the nature of this peak may changes. In the presence of the compound 3a, the 276 nm peak of the protein show a blue shift of 11 nm with the enhancement of the intensity. However, in the case of compound 3b, the protein peak shows slight blue shift of 2 nm. Although, the compounds have peak at 286 and 289 nm for 3a and 3b, respectively, but the protein peak (276 nm) shows blue shift upon addition of compounds. From this initial study, it may be assumed that the compounds can have capability to interact with the protein.
Intrinsic fluorescence study of insulin in presence of Schiff base compounds
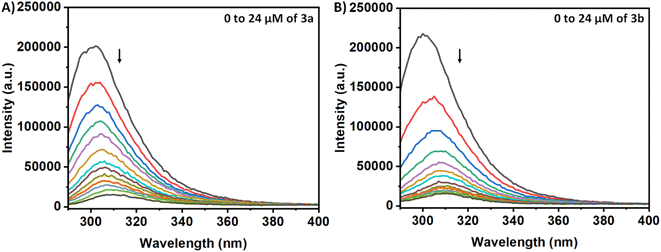
The Tyr residues of the monomeric insulin also show an emission response and give an emission peak at 304 nm on excitation at 276 nm. Upon addition to the 3a in the monomeric insulin solution (25 μM) at 283 K, the peak intensity of insulin (304 nm) decreases rapidly with a 7 nm red shift (Panel A, Fig. 2). The appearance of the peak at 312 nm with the addition of the compound is the characteristic of the compound 3a. In the case of compound 3b, a similar type of observation was found at the same temperature (Panel B, Fig. 2). The intensity of the said protein peak was decreased with the gradual addition of the compound.Stern–Volmer equation can be used to determine the affinity of compounds to bind to proteins.
| I0/I = 1 + Ksv[C] | (1) |
| Compound | Ksv, 104 (M−1) | Kb, 104 (M−1) | ||||
|---|---|---|---|---|---|---|
| 283 K | 293 K | 303 K | 283 K | 293 K | 303 K | |
| 3a | 4.99 | 3.94 | 3.65 | 2.83 | 2.18 | 1.65 |
| 3b | 6.64 | 7.47 | 8.64 | 16.08 | 17.09 | 18.57 |
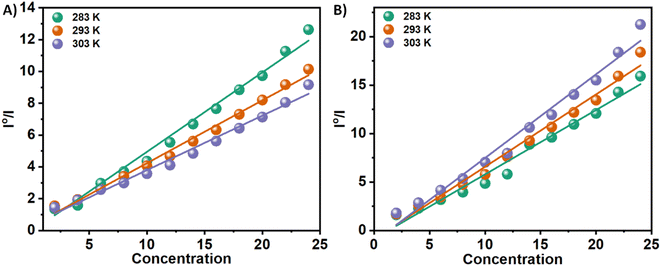 | ||
| Fig. 3 Stern–Volmer plots for the quenching of Tyr-fluorescence of insulin at 283, 293, and 303 K in the presence of two Schiff base 3a (Panel A) and 3b (Panel B) in solution. | ||
Binding parameters
By evaluating the binding constant (K) and the change in free energy (ΔG) of the synthesized compounds–insulin interaction, we can quantify the interaction between small molecules (3a and 3b) and protein. A fundamental aspect of the efficacy of small molecules lies in their ability to bind to the target protein, as well as their subsequent effect on its stability. This significantly affects binding efficacy. In order to determine the quantitative assessment of K and ΔG, the following equation is used to analyze the fluorescence quenching data. When a pair of complimentary species bind independently to equal sites in a macromolecule, this equation describes the equilibrium between the free and bound species.
ln((I0 − I)/I) = ln![[thin space (1/6-em)]](https://www.rsc.org/images/entities/char_2009.gif) Kb + n Kb + n![[thin space (1/6-em)]](https://www.rsc.org/images/entities/char_2009.gif) ln[C] ln[C]
| (2) |
n is the number of binding sites, and Kb is the binding constant. There have been extensive studies in the literature utilizing the above eqn (2) to elucidate binding parameters from fluorescence quenching data as a method for predicting binding parameters. Table 1 summarizes the results of this study, conducted at various temperatures. Fig. 4 shows representative plots of ln((I0 − I)/I) versus ln[C], which is a measure of how protein–compound interactions were affected by temperature. The results also indicate that the binding of 3a is weaker than that of 3b. Therefore, insulin has more preference to bind with the polar molecules in contrast with the hydrophobic molecules. The binding of the 3a to the insulin decreases with increasing temperature. However, reverse phenomenon was found in the case of 3b.
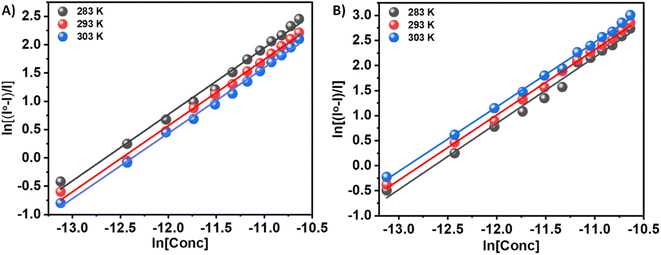 | ||
| Fig. 4 ln((I0 − I)/I) versus ln[C] plots for the quenching of Tyr-fluorescence of insulin at 283, 293, and 303 K in the presence of two Schiff base 3a (Panel A) and 3b (Panel B) in solution. | ||
Binding forces and thermodynamic parameters
In a broader sense, the interactions between small molecules and biomolecules can be summed up as having many different types of forces. A variety of forces interact within an interacting site, including electrostatic forces, hydrogen bonds, van der Waals interactions, and hydrophobic and steric contacts. Traditionally, to account for the principal forces of binding between small molecules and proteins, the signs and magnitudes of thermodynamic parameters have been invoked. By taking into account the assumption that there is no significant change in the enthalpy change (H) over a particular temperature range, the enthalpy change (H) and the entropy change (S) can both be calculated from the following van't Hoff equation:
ln![[thin space (1/6-em)]](https://www.rsc.org/images/entities/char_2009.gif) K = ΔH/RT + ΔS/R K = ΔH/RT + ΔS/R
| (3) |
| ΔG = ΔH − TΔS | (4) |
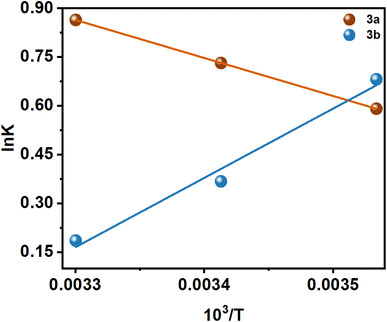
There are several thermodynamic parameters that can be calculated and listed in Table 2, and a representation of the van't Hoff plot (ln![[thin space (1/6-em)]](https://www.rsc.org/images/entities/char_2009.gif) K vs. 1/T) can be found in Fig. 5.
K vs. 1/T) can be found in Fig. 5.
Several kinds of interaction occur during protein–small molecule interaction. There is a link between these interactions and the thermodynamic parameters previously documented by Ross and Subramanian. These parameters have provided insights into the mechanisms by which each interaction occurs. According to the thermodynamic data, the following can be summarized as the model of interaction on the basis of the data related to the interaction:
(i) ΔH > 0, ΔS > 0 correspond to hydrophobic forces.
(ii) ΔH < 0, ΔS < 0 correspond to hydrogen bond formation and van der Waals interaction.
(iii) ΔH < 0, ΔS > 0 correspond to electrostatic/ionic interactions.
It has been demonstrated that the enthalpically unfavorable and entropically favorable thermodynamic parameters for the interaction between 3a and insulin are presented in Table 2, with a negative Gibbs free energy change, suggesting that the interaction may occur spontaneously. However, with a negative Gibbs free energy change, the 3b–insulin interaction is enthalpically favorable and entropically unfavorable. It should be noted that the positive enthalpy and entropy change demonstrate that the interaction process between 3a and insulin is dominated by hydrophobic forces. Again, 3b and insulin interact through hydrogen bond formation and van der Waals interaction, as demonstrated by the negative enthalpy and entropy changes.
| Compounds | Temperature (K) | ΔG° kJ mol−1 | ΔH° kJ mol−1 | ΔS° kJ mol−1 |
|---|---|---|---|---|
| 3a | 283 | −5.41 | ||
| 293 | −5.98 | +10.72 | +0.057 | |
| 303 | −6.55 | |||
| 3b | 283 | −12.16 | ||
| 293 | −11.33 | −35.65 | −0.083 | |
| 303 | −10.50 |
Monitoring the hydrophobicity changes in the microenvironment of insulin: ANS assay
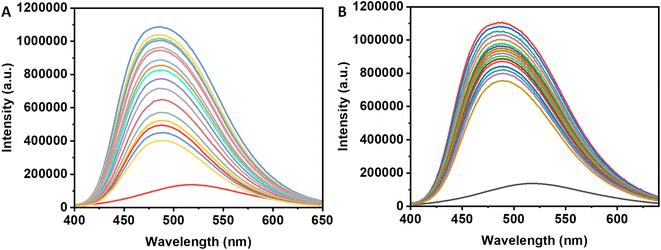
8-Anilinonaphthalene-1-sulfonic acid is a fluorescent probes having higher fluorescence intensity when binds at the hydrophobic pocket of the protein surface (also for insulin)30–33 with respect to its unbound state. Therefore, if one compounds able to displace ANS from the binding site of the protein, then the intensity of the ANS bound insulin will decrease. The results will indicate the said compound can bind at the hydrophobic site of the protein surface. In the case of the compound 3a, the intensity of the ANS-insulin system decrease with the gradual addition of it (Panel A, Fig. 6). However, for 3b, the decrease of fluorescence intensity is low with addition of the compound (Panel B, Fig. 6). Due to the presence of four hydroxyl groups in the compound, the compound is polar and unable to bind at hydrophobic protein surface. Again, 3a is sufficiently hydrophobic because it contains only one OH group and hydrophobic tert-butyl group. For this reason, the molecule has low solubility in the buffer medium.In the presence of insulin, having few hydrophobic pocket on the protein surface, become a host for both ANS and 3a. Due to lower solubility and higher binding ability of 3a with respect to the ANS, the molecule will move from polar aqueous medium to hydrophobic protein sites which will replace ANS from their binding site on insulin. It is evident from the decrease of ANS intensity. However, for the presence of four hydroxyl group in 3b, it is sufficiently hydrophilic and has lesser tendency to replace ANS from their binding sites. Therefore, 3b have different binding site than 3a which is polar in nature. The slight decrease in the ANS fluorescence intensity may be due to the ANS displacement from their binding sites for the conformational change of the protein during 3b binding to the protein. To confirm the results obtained in different studies, the circular dichroism (CD) spectroscopy was employed for monitoring the secondary structural changes.
Circular dichroism (CD) spectroscopy
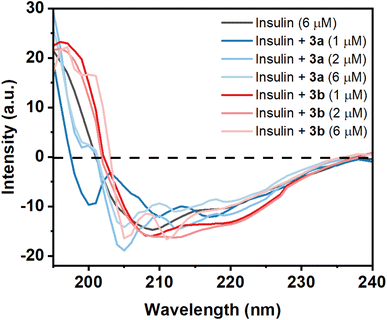
Circular dichroism (CD) of a protein gives indications of the secondary and tertiary structural change of the investigating protein. Insulin is an α-helix enriched protein which shows peak at 208 nm in far-UV CD spectral regions for its α-helical structure. If a small molecule such as a Schiff base interacts with the protein and is able to perturb the secondary structure of the insulin, then there will be a change or shift of these peaks. The purified monomeric insulin (6 μM) shows peaks at 208 nm and 221 nm which are the characteristic peaks of an alpha helix containing protein like insulin along with the presence of beta sheet structure. For a solution containing insulin and the compound 3a (1 μM), a significant change of far-UV CD spectrum was observed in the above-mentioned peak indicating that the binding of the compound to the protein unable to cause a major change of the secondary structure of the protein (Fig. 7). But addition of higher concentration of 3a (2 and 6 μM) changes the CD spectral pattern of insulin giving higher percent of random structure (Table S1†). Thus the hydrophobic compound 3a interacts with insulin and perturbs strongly its secondary structure. However, the compound 3b at its lower concentration (1 and 2 μM) interacts with insulin shows red-shift of these peaks with greater negative ellipticity value compared to monomeric insulin. CD structural analysis shows the formation of slight higher content of β-structure. The difference in MRE value can be related to the structure of the two molecules 3a and 3b. At higher concentration of the 3b, structural transition of insulin was observed. It showed lesser MRE value at 215 nm and increased MRE at 207 nm compared to insulin alone. Thus the hydrophilic compound 3b has influences in the secondary structure as well as the tertiary structure of the insulin.Protein function is very much related to the structure of the protein. The results indicate that hydrophobic molecule 3a has a high potential for the destruction of the secondary structure of insulin in comparison with hydrophilic molecule 3b. Therefore, the study shows that the stability of insulin is highly dependent on the hydrophilic and hydrophobic environment.
Theoretical studies
Structural investigation of the Schiff bases will provide significant insight into the nature of the molecule and the contribution of the functional groups to the properties. The molecular electrostatic potential map (MEP) of the energy-minimized structure (using density functional theory (DFT)) of the Schiff bases can provide its electronic distribution around the molecular backbone. Color-coding of the map indicates electron-rich (red), neutral (green), and electron-poor (blue) regions. The 3a molecule has methoxy and phenolic oxygen and imine nitrogen as polar atoms, whereas 3b has three additional hydroxyl groups (Fig. 8). All these groups can form an H-bond with protein through either H-bond donation or acceptance depending upon the group. The MEP of both compounds shows a red color on oxygen atoms. It is interesting to notice that the nitrogen atoms are buried in the neutral region. Therefore, imine nitrogen is less capable of H-bond formation.The polar surface area of 3a was calculated to be 41.82 Å2, whereas the value was 102.51 Å2 for 3b. Therefore, 3b has more than double the polar surface area than that of 3a. For this reason, the lipophilicity of 3a (log![[thin space (1/6-em)]](https://www.rsc.org/images/entities/char_2009.gif) Po/w = 2.83) is higher than (log
Po/w = 2.83) is higher than (log![[thin space (1/6-em)]](https://www.rsc.org/images/entities/char_2009.gif) Po/w = 1.73). Again, both the compounds are somewhat water soluble and the log
Po/w = 1.73). Again, both the compounds are somewhat water soluble and the log![[thin space (1/6-em)]](https://www.rsc.org/images/entities/char_2009.gif) S of 3a and 3b were calculated to be −2.41 and −0.48, respectively. For such small molecules, these parameters indicate that they have the potential to form H-bonds with molecules and enough polar.
S of 3a and 3b were calculated to be −2.41 and −0.48, respectively. For such small molecules, these parameters indicate that they have the potential to form H-bonds with molecules and enough polar.
Molecular docking is one of the most fascinating computational techniques which is used to predict the binding site of a small molecule to a protein, mechanism of protein binding, and weak forces involved in such binding process.34–36 Here, this method has been used to predict the binding mode of 3a and 3b in the human insulin. The structure of the molecules was energy minimized with the help of density functional theory (DFT). The molecular docking of these compounds to the human insulin showed that the compound 3b have higher binding affinity with respect to the 3a. The change of free energy for this binding process is −6.83 and −5.74 kcal mol−1 for 3b and 3a, respectively. It indicates that the compound 3b have more binding affinity to the human insulin than 3a which was also observed experimentally.
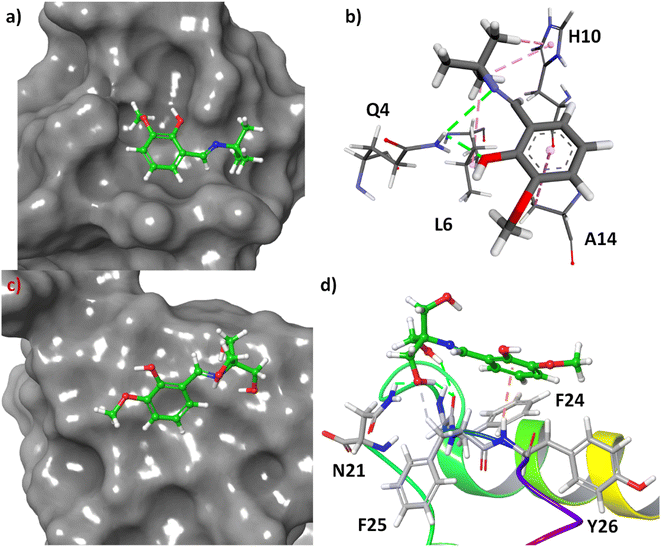
The molecular docking showed that the compound 3a has been bound at the hydrophobic cavity on the protein surface whereas the 3b attached at the surface of the protein (Fig. 9, Panel A and Panel B). In the binding process of the 3a, the amino acid residues Q4, L6, H10, and A14 are involved (Fig. 9C). In the case of 3b, the binder amino acids are Q21, F24, F25, and Y26 (Fig. 9D). In the binding sites, the N–H of amide group have hydrogen bond with the imine and hydroxyl group of 3a, imidazole ring of H10 shows C–H⋯π interactions with t-butyl group of 3a, the methyl group of A14 interact with C–H⋯π to the benzene ring of 3a, and L6 interact through hydrophobic interaction with tert-butyl group of 3a. However, hydrogen bonding is the main driving forces for the binding of 3b to the insulin. Amide C![[double bond, length as m-dash]](https://www.rsc.org/images/entities/char_e001.gif) O of F25 involved in hydrogen bonding with two hydroxyl groups at the side-chain of 3b. Another hydrogen bonding was found to be between amide N–H of N21 and the side-chain OH. The aliphatic C–H of F25 involved in non-conventional H-bonding interactions with the said OH group. Amide N–H of Y26 showed N–H⋯π interactions with benzene ring of 3b.
O of F25 involved in hydrogen bonding with two hydroxyl groups at the side-chain of 3b. Another hydrogen bonding was found to be between amide N–H of N21 and the side-chain OH. The aliphatic C–H of F25 involved in non-conventional H-bonding interactions with the said OH group. Amide N–H of Y26 showed N–H⋯π interactions with benzene ring of 3b.
Experimental
Materials
Human insulin, marketed by Eli Lilly, India under the trade name ‘Huminsulin’ was purchased from medicine shop. Few chemicals such as o-vanillin, tris(hydroxymethyl)aminomethane, tert-butyl amine were procured from Sigma-Aldrich, USA; acetic acid and HCl were purchased from Merck, Germany. Different fluorescent probes, namely 8-anilinonaphthalene-1-sulfonic acid ammonium salts (ANS), thioflavin T (ThT) were purchased from Sigma Chemical (St. Louis, USA). All the other reagents used in our experiments were of analytical grade or of high purity reagent available.Preparation and purification of monomeric state of insulin
The hexameric state of insulin marketed as 100 IU mL−1 equivalent to 2 mg mL−1 contains the preservative m-cresol, tonicity modifier glycerin and pH adjusting substances HCl/NaOH. However, through extensive dialysis with water, these substances were successfully removed. In the next step, 80% acetic acid was added to convert it to a monomer state with a final concentration of 20%. To ensure the formation of amyloid-like fibrils, the solution was filtered through a 0.22 μm (Millipore) filter membrane to remove traces of hexameric molecules. The filtrate was then kept at 37 °C overnight, resulting in a homogeneous solution serving as the monomeric state of insulin (1.5 mg mL−1). An optical value of ε (276 nm) = 10.0 was considered in this process.Synthesis of 3a and 3b
In a 10 mL round-bottomed flask equipped with a condenser and stirring bar, a mixture of ethanol (3 mL), ortho-vanillin (1.0 mmol), amine (1.2 mmol) and one drop of acetic acid was prepared. Upon addition of the components, the reaction mixture turned yellow in color. The mixture was then refluxed for three hours with stirring and subsequently allowed to cool to room temperature. To the cooled mixture, 10 mL of water was added and the resulting mixture was extracted with CH2Cl2 (3 × 5 mL). The combined organic layer was dried over anhydrous Na2SO4 and evaporated in vacuum. Finally, the compounds obtained were purified by either crystallization or column chromatography, followed by crystallization. The 1H and 13C NMR of the products (observed in DMSO-d6) can be found in ESI File (Fig S5–S8).†UV-visible spectroscopy
We utilized a JASCO Spectrophotometer model no. V700 (Serial No. B184461798) at room temperature (25 °C) to measure precisely the absorbance and determined the binding affinity and binding constants. UV titrations were conducted by gradually increasing the concentrations of insulin (1–20 μM) for 3a and (1–20 μM) for 3b in a 1 cm quartz cuvette that contained a constant concentration of 3a and 3b (20 μM) in Milli-Q water. The spectra were recorded between 200–600 nm. To check the stability of the compounds, they were subject to under investigation through UV-vis spectroscopy in water at 20 μM separately with respect to time.Intrinsic fluorescence study of insulin in presence of Schiff base compounds
The study conducted fluorescence quenching experiments using HORIBA (Model: FLUOROMAX-4C, serial no. 1734D-4018-FM) at room temperature after exciting the solutions at 276 nm and following the emission in the wavelength range 290–400 nm and keeping the excitation and emission slits at 5 nm. The concentration of insulin was kept constant at 25 μM while 3a and 3b were added successively from 2 to 24 μM and 2 to 24 μM, respectively. The excitation wavelength for 3a and 3b derivative was 335 nm and 325 nm, respectively, and emission was recorded between 350–550 nm. To understand the spectroscopic behaviour of both the compounds, concentration dependent fluorescence spectroscopy was recorded in water at the said excitation wavelength.ANS assay for monitoring the hydrophobicity changes
The hydrophobicity of protein molecules was determined by employing a fluorescent probe that binds to the hydrophobic pockets on the protein 1-anilinonapthalene-8-sulfonate (ANS) is a well-known polarity sensitive probe that shows specific binding with the hydrophobic pockets. A stock solution of ANS was prepared and mixed to 2 mL monomeric insulin samples to determine hydrophobicity. The final ANS concentration in each sample aliquot was kept constant at 30 μM. The protein samples were then treated with 3a and 3b chemicals at doses ranging from 2 to 60 μM and 2 to 60 μM, respectively. Shimadzu Spectrofluorometer (Shimadzu 5301 PC) was used to record the emission spectra from 390 to 600 nm after excitation at 350 nm. The length of the path was 1 cm. Both the excitation and emission slits were set at 5 nm.Circular dichroism (CD) spectroscopy
We recorded far-UV CD spectra of insulin in the presence of the Schiff bases 3a and 3b using a Jasco spectropolarimeter (Model: J-815). The measurements were done in a nitrogen atmosphere, with a quartz cell of path length 0.2 cm in the far-UV region (200–260 nm). We maintained a constant concentration of insulin at 6 μM, while the concentrations of 3a and 3b derivatives were varied (1–6 μM). We collected data for each nm from 260 to 200 nm at a scan speed of 50 nm per minute. The sample temperature was kept at 25 °C using a Neslab RTE-111 circulating water bath connected to water-jacketed quartz cuvettes. To calculate the secondary structures of insulin, we utilized CDNN 2.1 software attached with the instrument.Molecular docking
The RCSB Protein Data Bank website (PDB ID: 3I40) provided us with the crystal structure of human insulin. We thoroughly analyzed this biopolymer's structure and prepared it for a docking experiment. Our team optimized the structures of 3a and 3b using the Density Functional Theory (DFT) B3LYP/6-31G level of theory to minimized energy. For MEP, a same functional and basis sets have been utilized. These optimized structures were then used for docking with insulin protein to identify the most probable site and mode of binding using the grid-based docking program Auto Dock 4.2. To ensure accuracy, we removed the ligand present in the protein and water molecules from the protein and assigned Atom Kollman charges after adding polar hydrogen for the protein. We utilized the default parameters of Auto Dock and the generic algorithm to conduct this calculation. The visualization effects were expertly prepared using Discovery Studio 4.1 Client. We are confident in the accuracy and validity of our findings. The polar surface area, lipophilicity, and water solubility was predicted using SwissADMET.37Conclusions
In conclusion, the effects of hydrophilic and hydrophobic molecules on the insulin binding process have been investigated through a multi-spectroscopic approach. We have synthesized two Schiff base molecules with hydrophilic and hydrophobic side chains. The findings of our investigation show that glucose (hydrophilic) binding protein insulin has also a sufficient affinity to bind with the hydrophobic molecules. The binding constant of hydrophobic and hydrophilic molecules was found to be 4.99 × 10⁴ M−1 and 6.64 × 10⁴ M−1, respectively, at 283 K. The binding of hydrophobic molecules at the hydrophobic pocket of insulin perturbs greatly the secondary structure of the monomeric insulin whereas the hydrophilic molecule causes small alterations in the secondary structural contents on binding with insulin. Thus, stability of insulin is diminished in the presence of hydrophobic molecules.Conflicts of interest
The authors declare no competing financial interest.Acknowledgements
Financial support of Indian Council of Medical Research (ICMR), Govt. of India, is greatly acknowledged. Shahnaz Begum is the recipient of ICMR-SRF fellowship. Financial support of University Grants Commission UGC-CAS-II and DST-PURSE-II (Govt. of India) Program of Department of Chemistry, Jadavpur University, Kolkata are also acknowledged. Dr Mohd Afzal extends his appreciation to Researchers Supporting Project Number (RSPD2023R979), King Saud University, Riyadh, Saudi Arabia, for financial assistance.References
- S. C. Bagley and R. B. Altman, Protein Sci., 2008, 4, 622–635 CrossRef.
- V. H. Nguyen and B.-J. Lee, Int. J. Nanomed., 2017, 12, 3137–3151 CrossRef CAS.
- R. Sinha and S. K. Khare, Front. Microbiol., 2014, 5, 165 Search PubMed.
- H.-X. Zhou and X. Pang, Chem. Rev., 2018, 118, 1691–1741 CrossRef CAS.
- L. Mabonga and A. P. Kappo, Biophys. Rev., 2019, 11, 559–581 CrossRef CAS.
- D. K. Ghosh and A. Ranjan, Protein Sci., 2020, 29, 1559–1568 CrossRef CAS.
- L. M. Stevers, E. Sijbesma, M. Botta, C. MacKintosh, T. Obsil, I. Landrieu, Y. Cau, A. J. Wilson, A. Karawajczyk, J. Eickhoff, J. Davis, M. Hann, G. O'Mahony, R. G. Doveston, L. Brunsveld and C. Ottmann, J. Med. Chem., 2018, 61, 3755–3778 CrossRef CAS.
- V. Corradi, B. I. Sejdiu, H. Mesa-Galloso, H. Abdizadeh, S. Y. Noskov, S. J. Marrink and D. P. Tieleman, Chem. Rev., 2019, 119, 5775–5848 CrossRef CAS.
- E. Hallacli, C. Kayatekin, S. Nazeen, X. H. Wang, Z. Sheinkopf, S. Sathyakumar, S. Sarkar, X. Jiang, X. Dong, R. Di Maio, W. Wang, M. T. Keeney, D. Felsky, J. Sandoe, A. Vahdatshoar, N. D. Udeshi, D. R. Mani, S. A. Carr, S. Lindquist, P. L. De Jager, D. P. Bartel, C. L. Myers, J. T. Greenamyre, M. B. Feany, S. R. Sunyaev, C. Y. Chung and V. Khurana, Cell, 2022, 185, 2035–2056 CrossRef CAS.
- G. Wilcox, Clin. Biochem. Rev., 2005, 26, 19–39 Search PubMed.
- M. S. Rahman, K. S. Hossain, S. Das, S. Kundu, E. O. Adegoke, M. A. Rahman, M. A. Hannan, M. J. Uddin and M.-G. Pang, Int. J. Mol. Sci., 2021, 22, 6403 CrossRef CAS.
- B. M. Y. Cheung and C. Li, Curr. Atheroscler. Rep., 2012, 14, 160–166 CrossRef CAS.
- W. Fan, Cardiovasc. Endocrinol., 2017, 6, 8–16 CrossRef.
- R. Chen, B. Ovbiagele and W. Feng, Am. J. Med. Sci., 2016, 351, 380–386 CrossRef.
- E. Giovannucci, D. M. Harlan, M. C. Archer, R. M. Bergenstal, S. M. Gapstur, L. A. Habel, M. Pollak, J. G. Regensteiner and D. Yee, Diabetes Care, 2010, 33, 1674–1685 CrossRef.
- I. Martín-Timón, World J. Diabetes, 2014, 5, 444 CrossRef.
- T. N. Vinther, M. Norrman, U. Ribel, K. Huus, M. Schlein, D. B. Steensgaard, T. Å. Pedersen, I. Pettersson, S. Ludvigsen, T. Kjeldsen, K. J. Jensen and F. Hubálek, Protein Sci., 2013, 22, 296–305 CrossRef CAS.
- N. Nagel, M. A. Graewert, M. Gao, W. Heyse, C. M. Jeffries, D. Svergun and H. Berchtold, Biophys. Chem., 2019, 253, 106226 CrossRef CAS.
- C. L. Maikawa, A. A. A. Smith, L. Zou, C. M. Meis, J. L. Mann, M. J. Webber and E. A. Appel, Adv. Ther., 2020, 3, 1900094 CrossRef.
- A. D. G. Lawson, M. MacCoss and J. P. Heer, J. Med. Chem., 2018, 61, 4283–4289 CrossRef CAS.
- R. R. Thangudu, S. H. Bryant, A. R. Panchenko and T. Madej, J. Mol. Biol., 2012, 415, 443–453 CrossRef CAS.
- S. Chaturvedi, P. P. Hazari, A. Kaul, Anju and A. K. Mishra, ACS Omega, 2020, 5, 26297–26306 CrossRef CAS.
- S. Zhong, J.-H. Jeong, Z. Chen, Z. Chen and J.-L. Luo, Transl. Oncol., 2020, 13, 57–69 CrossRef.
- H. Schiff, Ann. Chem. Pharm., 1864, 131, 118–119 CrossRef.
- M. G. Humphrey, T. Schwich, P. J. West, M. P. Cifuentes and M. Samoc, in Comprehensive Inorganic Chemistry II, Elsevier, 2013, pp. 781–835 Search PubMed.
- C. J. Burns, M. P. Neu, H. Boukhalfa, K. E. Gutowski, N. J. Bridges and R. D. Rogers, in Comprehensive Coordination Chemistry II, Elsevier, 2003, pp. 189–345 Search PubMed.
- W. Wang, R. Narain and H. Zeng, in Polymer Science and Nanotechnology, Elsevier, 2020, pp. 203–244 Search PubMed.
- Y. Dong and W. Wang, in Wound Healing Biomaterials, Elsevier, 2016, pp. 289–307 Search PubMed.
- H. Liu, S. Ding, Q. Lu, Y. Jian, G. Wei and Z. Yuan, ACS Omega, 2022, 7, 7585–7594 CrossRef CAS.
- P. Patel, K. Parmar and M. Das, Int. J. Biol. Macromol., 2018, 108, 225–239 CrossRef CAS.
- P. Alam, A. Z. Beg, M. K. Siddiqi, S. K. Chaturvedi, R. K. Rajpoot, M. R. Ajmal, M. Zaman, A. S. Abdelhameed and R. H. Khan, Arch. Biochem. Biophys., 2017, 621, 54–62 CrossRef CAS.
- A. Das, Y. M. Gangarde, V. Tomar, O. Shinde, T. Upadhyay, S. Alam, S. Ghosh, V. Chaudhary and I. Saraogi, Mol. Pharm., 2020, 17, 1827–1834 CrossRef CAS.
- S. Das and D. Bhattacharyya, J. Cell. Biochem., 2017, 118, 4881–4896 CrossRef CAS.
- N. Sepay, P. C. Saha, Z. Shahzadi, A. Chakraborty and U. C. Halder, Phys. Chem. Chem. Phys., 2021, 23, 7261–7270 RSC.
- N. Sepay, N. Sepay, A. Al Hoque, R. Mondal, U. C. Halder and M. Muddassir, Struct. Chem., 2020, 31, 1831–1840 CrossRef CAS.
- N. Sepay, S. Chakrabarti, M. Afzal, A. Alarifi and D. Mal, RSC Adv., 2022, 12, 24178–24186 RSC.
- A. Daina, O. Michielin and V. Zoete, Sci. Rep., 2017, 7, 42717 CrossRef.
Footnote |
| † Electronic supplementary information (ESI) available. See DOI: https://doi.org/10.1039/d3ra06647a |
| This journal is © The Royal Society of Chemistry 2023 |

