 Open Access Article
Calcined chicken eggshell-derived biomimetic nano-hydroxyapatite as a local drug-delivery aid for doxycycline hyclate: characterization, bio-activity, cytotoxicity, antibacterial activity and in vitro release study
Mashrafi Bin Mobarak a,
M. Nahidul Islamb,
Fariha Chowdhuryc,
Md. Najem Uddin
 d,
Md. Sahadat Hossain
 a,
Monika Mahmud
 a,
Umme Sarmeen Akhtara,
Nazmul Islam Tanvird,
A. F. M. Mustafizur Rahmanb and
Samina Ahmed
 *ad
*ad
aInstitute of Glass and Ceramic Research and Testing (IGCRT), Bangladesh Council of Scientific and Industrial Research (BCSIR), Dhaka-1205, Bangladesh. E-mail: shanta_samina@yahoo.com
bDepartment of Applied Chemistry and Chemical Engineering, University of Dhaka, Dhaka-1000, Bangladesh
cBiomedical and Toxicological Research Institute (BTRI), Bangladesh Council of Scientific and Industrial Research (BCSIR), Dhaka-1205, Bangladesh
dBCSIR Laboratories Dhaka, Bangladesh Council of Scientific and Industrial Research (BCSIR), Dhaka-1205, Bangladesh
First published on 12th December 2023
Abstract
The integration of bioactive substances with antibiotics has been extensively pursued for the treatment of osteomyelitis. These materials, also known as biomaterials, can serve both as bone replacements and targeted drug delivery systems for antibiotics. In this study, biomimetic nano-hydroxyapatite (nHAp) was synthesized via the coprecipitation technique where waste chicken eggshell (WCE) was employed as the source of Ca. Heat treatment was performed at four different temperatures (100 °C, 300 °C, 600 °C and 900 °C). Subsequently, the samples were characterized using XRD, FTIR spectroscopy, Raman spectroscopy, FESEM, EDX, XPS, DLS hydrodynamic size and zeta potential analysis. Also, their biomedical effectiveness was evaluated in terms of cytotoxicity, hemolysis, antibacterial performance, and bioactivity. Doxycycline hyclate (DOXh) was loaded in the synthesized nHAp samples, and subsequently its in vitro release was studied under stirring in simulated body fluid (SBF). The DOXh release kinetics was evaluated, and it was found that the first-order model was the best fitted kinetic model describing the release of DOXh from the nHAp samples, except for nHAp100, which was best described by the Korsmeyer–Peppas model. The nHAp synthesized utilizing WCE showed excellent potential for biomedical application and can be used as a drug delivery agent for antibiotics, such as DOXh.
1. Introduction
Bone defects, which are caused by various reasons, such as bone diseases, infections, and accidents, are also associated with further trauma given that their treatment is very costly with long treatment times and the torment from unsuccessful treatment results.1 Among the causes of bone defects, bone infection is greatly associated with various microorganisms, which, when raised to the level of inflammation (acute or chronic), causes osteomyelitis.2 The infectious microorganisms show hostility in various places of the bone, such as the marrow, cortex, and adjacent tissues that are known to be soft in nature. People of any age are susceptible to this disease, which can affect any type of bone. This results in a traumatic experience, and patients with diabetes face the worst-case scenarios. Among the microorganisms responsible for osteomyelitis, Staphylococcus aureus, Gram-positive bacteria, has been found to be the most common (approximately 75% of all cases), with its virulence affecting various extracellular and cell-associated factors.3–5 In this case, to fight osteomyelitis, a combination of operative debridement, bone defect filling, and antibiotic therapy is usually used.6,7 Generally, antibiotic therapy is comprised of intravenous and oral administration for a period of approximately 3 weeks each, but nowadays it is for longer periods in most cases.8–10 To ensure the necessary dosage of antibiotics at the infected sites, a high dosage is usually recommended given that the drugs have a very low efficiency of penetration from the blood stream to the targeted site.11,12The prolonged administration of antibiotics at high dosages results in systemic toxicity together with detrimental effects on organs, such as the liver and kidney, in addition to the upsurge in antibiotic and multidrug resistance.13 One of the crucial reasons for antibiotic resistance is the formation of a biofilm, which protects bacteria from antibiotics, and even makes them a thousand times more resistant than bacteria without a biofilm.14 Due to these reasons, patients must take an excessive amount of antibiotics to fight against bacteria, and thus researchers have devoted their efforts to looking for better alternatives.15
To date, although there have been significant revolutions in the fields of surgery and antibiotic treatment, the localized delivery of antibiotics is an approach widely accepted by researchers given that it offers solutions to problems such as systemic toxicity and excessive administration given that it increases the therapeutic concentration of the drug at the targeted site.2,8,11,15 Drug delivery systems for the localized delivery of drugs are designed with two types of carriers, i.e., biodegradable and non-biodegradable. Although non-biodegradable delivery systems have shown promising results, they are limited by the fact that the carrier needs to be changed or withdrawn, which is not the case for biodegradable local drug carriers.8,16 Biomaterials are the most preferred carriers when designing a biodegradable local drug delivery system and an amalgamation of biomaterial-antibiotic helps in treating osteomyelitis to a great extent.2,17
Hydroxyapatite (Ca10(PO4)6(OH)2) has been recognized as a gold standard biomaterial due to its similarity in structure and behavior to human bone.18–25 In addition, hydroxyapatite (HAp) possesses superb biocompatibility, osteoconductivity, bioactivity, non-toxicity, non-inflammatory properties, and excellent stability.26 HAp has already been investigated for the localized delivery of drugs such as ciprofloxacin,27 amoxicillin,15 vancomycin,29 and gentamicin.28,30 The loading of drugs is carried out either via a facile adsorption process or solid-state mixing, where the latter is responsible for uncontrolled release of the drug. In this case, the existence of positively charged calcium and negatively charged phosphorus sites in HAp facilitates the adsorption process.2,31 Also, the synthesis of nano-sized HAp carriers makes the drug delivery system even more desirable due to the resulting superior loading and adsorption and more controlled delivery.
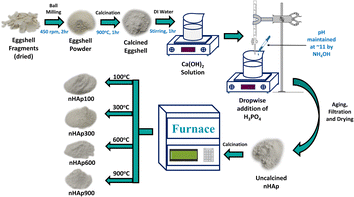
In our study, we synthesized nHAp using the coprecipitation method, employing chicken eggshells, a byproduct of poultry, as the source of calcium. To date, many studies have reported the superior workability of eggshell-derived nHAp compared to synthetic nHAp. The absence of certain minerals that constitute tooth apatite, inferior sinterability in terms of hardness and density, lower bioactivity, expensive raw materials, etc. are some of the shortcomings of synthetic nHAp, shifting the focus to the waste-derived synthesis of nHAp.32–34 nHAp was evaluated as a localized drug delivery carrier for DOXh, a potent broad-spectrum antibiotic effective against both Gram-positive and Gram-negative bacteria.35 DOXh is water-soluble and falls in the family of tetracyclines. Besides its widespread use in the treatment of skin infections such as chlamydia, cholera, and syphilis, DOXh has also found application in fighting osteomyelitis.5,36,37 Numerous studies have investigated the DOXh loading-release profile of synthetic HAp38 as well as scaffolds prepared by combining HAp with synthetic/natural polymer blends such as poly(lactide-co-glycolide),39 polycaprolactone/gelatin,40 alginate,41 collagen,42 and polylactic acid.43 However, none of these studies focused on the synthesis of bio-waste-derived HAp and the effect of calcination temperature on the loading and release of DOXh. The objective of this study was to analyse the adsorption of DOXh molecules on the surface of nHAp calcined at different temperatures, assess the drug release, investigate its impact on epithelial cells (cytotoxicity) and red blood cells (hemolysis), in vitro formation of an apatite layer and estimate its antibacterial properties. An alternative hypothesis is that the calcination temperature of nHAp has effect on the DOXh loading and release given that calcination results in changes in certain properties of HAp.44 Furthermore, the potential of bio-waste-derived nHAp to act as a local carrier of DOXh was evaluated, contributing to the scientific research in this field.
2. Materials and methods
2.1 Materials
WCE was collected from nearby cafeterias of the Dhaka University campus (23°43′32.0′′N 90°24′13.2′′E). ortho-Phosphoric acid (H3PO4) (Merck, Germany) was the P source and ammonia solution (NH4OH) was used for pH adjustment. The reagents used for the preparation of SBF solution are tabulated in Table 1. Doxycycline hyclate BP was generously donated by ACI Pharmaceuticals, Bangladesh. No further purification of these chemicals was done, and DI (de-ionized) water was used to prepare all solutions and experimentation.| Order | Reagent | Procurement | Purity (%) | M.W (g mol−1) | Amount as per47 (g) | Amount in this study (g) |
|---|---|---|---|---|---|---|
| 1 | NaCl | Merck | 99.5 | 58.44 | 6.547 | 6.545 |
| 2 | NaHCO3 | Merck | 99.5 | 84.01 | 2.268 | 2.268 |
| 3 | KCl | Merck | 99.5 | 74.55 | 0.373 | 0.373 |
| 4 | Na2HPO4 | Merck | 98 | 156.01 | 0.178 | 0.176 |
| 5 | MgCl2·6H2O | Merck | 99 | 203.30 | 0.305 | 0.305 |
| 6 | CaCl2·2H2O | Merck | 99.5 | 147.02 | 0.368 | 0.368 |
| 7 | Na2SO4 | Merck | 99 | 142.04 | 0.071 | 0.072 |
| 8 | (CH2OH)3CNH2 | Scharlau | 99.8 | 121.14 | 6.057 | 6.057 |
2.2 Methods
 | (1) |
 | (2) |
 | (3) |
 | (4) |
 | (5) |
 | (6) |
FTIR (IR Prestige-21, Shimadzu Corp. mounted with ATR) and Raman (HORIBA Macro-RAM™ with 785 nm wavelength laser) spectroscopic analysis was done to detect the functional groups present on the nHAp samples. The morphology and elemental analysis of the prepared samples were carried out by FESEM and EDX analysis, respectively (JEOL JSM-7610F). The DLS hydrodynamic size and surface charge of the synthesized samples were evaluated using a Malvern Zetasizer Ultra. The assessment of surface chemistry was conducted using an XPS instrument (Thermo Scientific K-Alpha).
![[thin space (1/6-em)]](https://www.rsc.org/images/entities/char_2009.gif) :
:![[thin space (1/6-em)]](https://www.rsc.org/images/entities/char_2009.gif) 1 ratio), 0.2% gentamycin, and 10% FBS (fetal bovine serum). The Vero cells (1.5 × 10⁴/100 μL) were seeded on a 96-well plate, and incubation was carried out for 24 h under 5% carbon dioxide at 37 °C. After incubation, 25 μL of the sample was added to each well, and the cytocompatibility assessment was done for 48 h under a trinocular microscope (Optika, Italy), and the number of cells was counted by an automated cell counter (hemocytometer). Duplicate wells were used for each sample, and a similar procedure was done for all the nHAp samples. The cell viability was calculated as follows:21
1 ratio), 0.2% gentamycin, and 10% FBS (fetal bovine serum). The Vero cells (1.5 × 10⁴/100 μL) were seeded on a 96-well plate, and incubation was carried out for 24 h under 5% carbon dioxide at 37 °C. After incubation, 25 μL of the sample was added to each well, and the cytocompatibility assessment was done for 48 h under a trinocular microscope (Optika, Italy), and the number of cells was counted by an automated cell counter (hemocytometer). Duplicate wells were used for each sample, and a similar procedure was done for all the nHAp samples. The cell viability was calculated as follows:21
 | (7) |
 | (8) |
 | (9) |
 | (10) |
 | (11) |
2.2.11 Ethical statement
All tests were conducted following the guidelines of “IGCRT.” The experiments received approval from the Ethics Committee at “BCSIR,” and informed consent was obtained from all human participants involved in the study (Ref: 1GCRT/R&D research/2022-2024/01; Date: 04.10.2022).3. Results and discussion
3.1 X-ray diffraction analysis
X-Ray powder diffractometry was employed to identify the phase and its purity and quantify the crystallographic parameters that play a vital role in the properties of hydroxyapatite.25 Fig. 2 presents the XRD patterns of the synthesized nHAp samples, depicting the formation of nHAp at different temperatures with undisrupted stability even at 900 °C. Compared with the ICDD database, JCPDS File No. #01-084-1998 was the closest match with nHAp100 and nHAp300.55 Alternatively, nHAp600 closely matched with JCPDS File No. #00-009-0432![[thin space (1/6-em)]](https://www.rsc.org/images/entities/char_2009.gif) 56 and nHAp900 had the closed match with JCPDS File No. #01-086-0740.57 The diffraction patterns of nHAp100, nHAp300 and nHAp600 showed broad contour in the 2θ diffraction angle range of 30° to 35°. The crystal planes observed in this range include (211), (300) and (202), while the (002), (310), (222), (213) and (004) planes were observed outside the contour. All these planes are characteristic for the HAp phase. In the case of nHAp900, sharper and well-defined peaks were observed. One isolated peak was observed at the diffraction angle of 11°, which corresponds to the (100) crystal plane of HAp. At the elevated temperature of 900 °C, no peaks of β-TCP (tri-calcium phosphate) were observed, confirming the mono-phasic nature of nHAp900. With an increase in temperature, more intense peaks with a lower peak width were observed, which was also reported in the literature.22,58
56 and nHAp900 had the closed match with JCPDS File No. #01-086-0740.57 The diffraction patterns of nHAp100, nHAp300 and nHAp600 showed broad contour in the 2θ diffraction angle range of 30° to 35°. The crystal planes observed in this range include (211), (300) and (202), while the (002), (310), (222), (213) and (004) planes were observed outside the contour. All these planes are characteristic for the HAp phase. In the case of nHAp900, sharper and well-defined peaks were observed. One isolated peak was observed at the diffraction angle of 11°, which corresponds to the (100) crystal plane of HAp. At the elevated temperature of 900 °C, no peaks of β-TCP (tri-calcium phosphate) were observed, confirming the mono-phasic nature of nHAp900. With an increase in temperature, more intense peaks with a lower peak width were observed, which was also reported in the literature.22,58
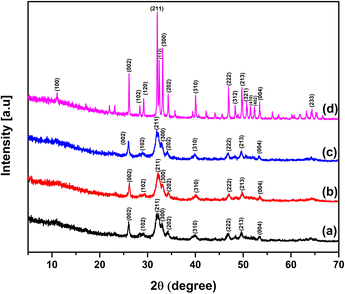 | ||
| Fig. 2 XRD patterns of prepared nHAp samples: (a) nHAp100, (b) nHAp300, (c) nHAp600 and (d) nHAp900. | ||
The quantitative analysis based on the XRD patterns (crystallite size, dislocation density, degree of crystallinity, micro-strain and specific surface area) is illustrated in Fig. 3 and the unit cell parameters are tabulated in Table 2.
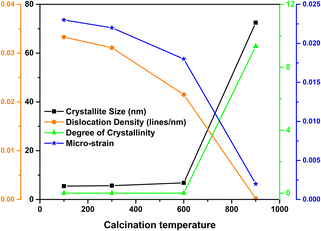 | ||
| Fig. 3 Relation between crystallite size, dislocation density, degree of crystallinity and micro-strain of nHAp with respect to calcination temperature. | ||
| Sample name | Lattice parameters (experimental) | Lattice parameters (standard) | JCPDS file no. |
|---|---|---|---|
| nHAp100 | a = b = 9.4099 Å and c = 6.8322 Å, V = 523.92 Å3 | a = b = 9.4166 Å and c = 6.8745 Å, V = 527.91 Å3 | #01-084-1998 |
| nHAp300 | a = b = 9.3633 Å and c = 6.8298 Å, V = 518.56 Å3 | a = b = 9.4166 Å and c = 6.8745 Å, V = 527.91 Å3 | #01-084-1998 |
| nHAp600 | a = b = 9.4091 Å and c = 6.8550 Å, V = 525.57 Å3 | a = b = 9.4180 Å and c = 6.8840 Å, V = 528.80 Å3 | #00-009-0432 |
| nHAp900 | a = b = 9.3815 Å and c = 6.8350 Å, V = 510.97 Å3 | a = b = 9.3520 Å and c = 6.8820 Å, V = 521.26 Å3 | #01-086-0740 |
As the calcination temperature increased, the crystallite size and the degree of crystallinity also increased. In contrast, the dislocation density and micro-strain of the nHAp samples decreased at elevated temperatures.
3.2 FTIR analysis
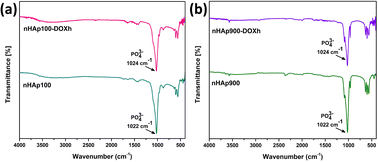
FTIR is a widely employed technique used to determine the functional groups present in unknown samples. To identify the functional groups in the prepared nHAp samples, their FTIR spectra were recorded, as shown in Fig. 4a. All the spectra show similar patterns except for some slight differences. The patterns are typical for HAP, where the presence of unwanted or unreacted groups was not detected. The characteristic apatite phase was confirmed by the well-defined bands in the range of 559 cm−1 to 1091 cm−1.59,60 The bands around ∼470 cm−1 correspond to the O–P–O symmetric bending modes (ν2), while the bands in the range of 557 cm−1 to 601 cm−1 correspond to the O–P–O asymmetric bending modes (ν4).21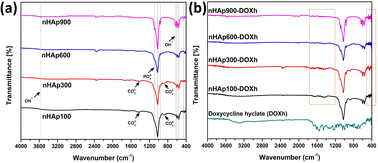 | ||
| Fig. 4 FTIR spectra of (a) nHAp samples (nHAp100, nHAp300, nHAp600 and nHAp900) and (b) doxycycline hyclate (DOXh) and DOXh-loaded nHAp samples. | ||
The structural OH− group of the prepared HAp samples was observed at 632–634 cm−1 and ∼3572 cm−1.61 The observed bands at 873 and 1421 cm−1 for HAp100 and 877 cm−1 and 1415 cm−1 for HAp300 are attributed to the CO32− group. In contrast, none of these peaks were detected for HAp600 and HAp900. The O–P–O symmetric (ν1) and asymmetric (ν3) stretching bands were detected at ∼960 cm−1 and ∼1024 cm−1, respectively. The absence of bands for adsorbed H2O indicates the appropriate storage and handling of the samples. The FTIR spectra of DOXh and the DOXh-loaded nHAp samples were also recorded (shown in Fig. 4b). The inclusion of DOXh in the nHAp samples was mainly confirmed by the appearance of new peaks at very low intensities in the range of 400–520 cm−1 and 1210–1770 cm−1.
3.3 Raman analysis
The Raman spectroscopic analysis of the synthesized nHAp samples was carried out to investigate the Raman shifts of the existing functional groups and confirm the presence of the apatite phase. The Raman spectra of the nHAp samples are presented in Fig. 5. Raman analysis is useful for materials such as HAp to describe their crystallinity with respect to different reaction conditions including pH, reaction time, calcination temperature, and Ca/P ratio.62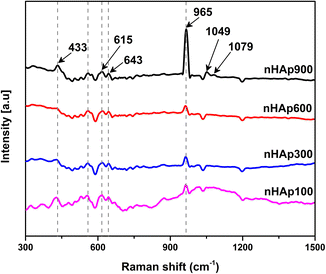 | ||
| Fig. 5 Raman spectroscopic analysis of prepared nHAp samples calcined at 100 °C, 300 °C, 600 °C and 900 °C. | ||
Consistent with the XRD analysis, it was evident that the calcination temperature significantly influenced the crystallinity of the synthesized nHAp samples. The formation of a crystalline phase at 900 °C was well evident in the Raman spectrum of nHAp900, which has the highest Raman intensity peak among the samples at 965 cm−1. Inversely, nHAp100, nHAp300, and nHAp600 have an amorphous phase with a low, intense peak at around 965 cm−1, which is consistent with the XRD spectra. The peak at ∼965 cm−1 corresponds to the ν1 stretching of P–O, which is also defined as the symmetric stretching of the PO43− group.63 The other Raman shifts observed correspond to: (i) ν2 symmetrical bending (O–P–O) in the range of 429 to 433 cm−1, (ii) ν3 asymmetric P–O stretching at 1049 to 1079 cm−1 (only observed for nHAp900) and (iii) ν4 anti-symmetrical bending at 555 to 643 cm−1 for all the nHAp samples.64–67
3.4 FESEM and EDX study
FESEM was used to perform the morphological investigation of the produced nHAp samples. Fig. 6a, d, g, and j present the FESEM images of nHAp100, nHAp300, nHAp600, and nHAp900, respectively. According to the images, the particles of nHAp100 exist in agglomerated form, and their shape includes a long cylindrical rod, which is irregularly structured.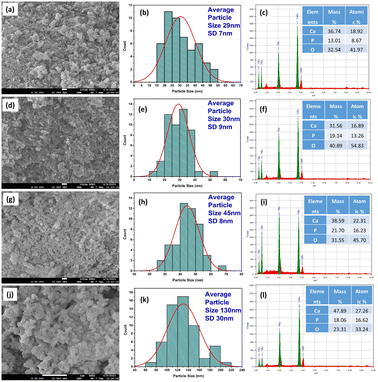 | ||
| Fig. 6 FESEM, particle size histogram and EDX spectra of nHAp100 (a, b and c), nHAp300 (d, e and f), nHAp600 (g, h and i) and nHAp900 (j, k and l), respectively. | ||
Alternatively, less agglomerated particles were observed for the nHAp300, nHAp600, and nHAp900 samples. As the calcination temperature increased, several phenomena occurred, including sintering and grain growth, elevated thermal energy and particle mobility, elimination of defects and dislocations, Ostwald ripening, and redistribution of atoms. These processes contributed to the reduction in agglomeration and increase in crystallite size. This observation is consistent with the findings reported in previous studies.68–70 In the case of calcination at 900 °C, smaller and more agglomerated particles sintered together and formed large agglomerates, causing the nHAp900 particles to be the largest among the samples.71 The particles of nHAp300 and nHAp600 were mostly cylindrical rod-shaped; however, shorter lengths with much wider particles were seen for nHAp600. Interestingly, the cylindrical rod shape was not seen for nHAp900; rather, rouletted, oval, and irregular flat plate shapes were observed. Thus, with an increase in the calcination temperature, the cylindrical rod shapes were transformed into a more rouletted plate shape. The particle size of the samples was measured based on these images, following our previously reported protocol.72 A minimum of 50 discrete particles with a clearly detectable boundary were considered for each measurement. The nano-structured form of the samples was confirmed by the particle size histograms, as shown in Fig. 6b, e, h, and k. With an increase in the calcination temperature, the particle size of the samples also increased, with nHAp100 having the lowest particle size and nHAp900 having the highest particle size. This is consistent with the crystallite size variation extrapolated from the XRD analysis.
The elemental analysis of the samples was done in terms of EDX, as shown in Fig. 6c, f, i and l. The elements present in the nHAp structure, i.e., Ca (Ka and Kb), P (Ka) and O (Ka) were confirmed together with their quantitative analysis. A peak for C (Ka) was detected, which originated from the carbon tape onto which the samples were placed. The Ca/P ratios of the nHAp samples based on EDX analysis are as follows: nHAp100 (2.18), nHAp300 (1.27), nHAp600 (1.37), and nHAp900 (1.64). The Ca/P ratio of nHAp900 is the closest to the theoretical Ca/P ratio of nHAp (1.67). This ratio was the highest for nHAp100, which then decreased with the calcination temperature, and eventually increased to 1.64 at 900 °C calcination. According to the work of Agbabiaka et al., the Ca/P ratio of waste poultry eggshell-derived HAp calcined at 800 °C, 900 °C and 1000 °C was found to be 0.55, 1.26 and 1.65, respectively. An increase in the calcination temperature caused the Ca/P ratio to be much closer to 1.67 which was due to the presence of other phases, such as monetite and calcium hydrogen phosphate hydrate, limiting the achievement of the anticipated stoichiometry ratio.73 Opposite results were seen in the work by Sanosh et al., where the Ca/P ratio of sol–gel-prepared synthetic nHAp was evaluated with respect to calcination temperature from 65 °C to 800 °C. Based on the results, the Ca/P ratio of nHAp calcined at 65 °C was very near to 1.67 but increased with an increase in the calcination temperature. The formation of minor amounts of CaO at temperatures of 700 °C and above caused this deviation in the Ca/P ratio from the theoretical value, which was also reported in other studies.74 In our study, the deviation in the Ca/P ratio may be due to several factors given that the amount of eggshell was taken based on the assumption of 97% Ca present in the eggshell. Besides, at 900 °C, nHAp became more crystalline and uniformly structured, which resulted in a Ca/P ratio closer to 1.67.
3.5 DLS hydrodynamic size and surface charge
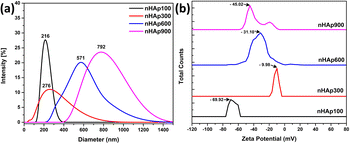
The hydrodynamic size and surface charge (zeta potential) of the synthesized nHAp samples were measured using a DLS particle size analyzer, as shown in Fig. 7. Before the analysis, the samples were sonicated with DI water at their natural pH to prevent particle agglomeration. The obtained hydrodynamic size of the samples followed the order of nHAp900 (792 nm) > nHAp600 (571 nm) > nHAp300 (276 nm) > nHAp100 (216 nm), which is consistent with the findings through FESEM image-based particle size measurements.Zeta potential plays a crucial role in determining particle stability in solution, which is influenced by factors such as soluble electrical conductivity, ion concentration, and solvent pH. The zeta potential value is closely related to both the suspension stability and the surface characteristics of particles, making it a significant contributor to overall particle stability in solution. Finding the surface charge of the nanoparticles to be employed as a drug carrier is essential for drug delivery applications.75,76 Thus, the surface functionality and stability of the synthesized nHAp samples were evaluated in terms of zeta potential. The obtained results suggest that the nHAp100 particles possess excellent stability (−69.92 mV), the nHAp900 particles exhibit good stability (−45.02 mV), the nHAp600 particles demonstrate moderate stability (−31.10 mV), and the nHAp300 particles show incipient stability (−9.98 mV).77
3.6 In vitro studies
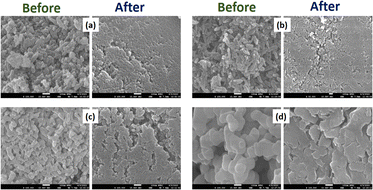
Herein, the bio-activity of the prepared HAp samples was evaluated by FESEM imaging analysis based on their immersion in SBF solution for 21 days. Taking a closer look at the FESEM images, as shown in Fig. 8, the formation of an apatite layer on the powdered nHAp samples was evident. The discrete particles of all the samples were found to be covered after 21 days of immersion in SBF solution, which is due to the attachment of apatite to the nHAp particles. The deposition of an apatite layer on the nHAp particles is due to the interaction of the positive Ca and negative P sites in nHAp with the negative PO43− and positive Ca2+ charged sites in SBF. The combination of the opposite charged sites induced the nucleation of apatite, and the continuation of this resulted in the super-saturation of the discrete nHAp particles by the apatite layer.2,78–80
| Sample ID | Survival of cells | Remarks |
|---|---|---|
| Control (−ve) (solvent) | 100% | All the samples showed no signs of cytotoxicity |
| Control (+ve) (solvent) | 100% | |
| nHAp100 | >95% | |
| nHAp300 | >95% | |
| nHAp600 | >95% | |
| nHAp900 | >95% |
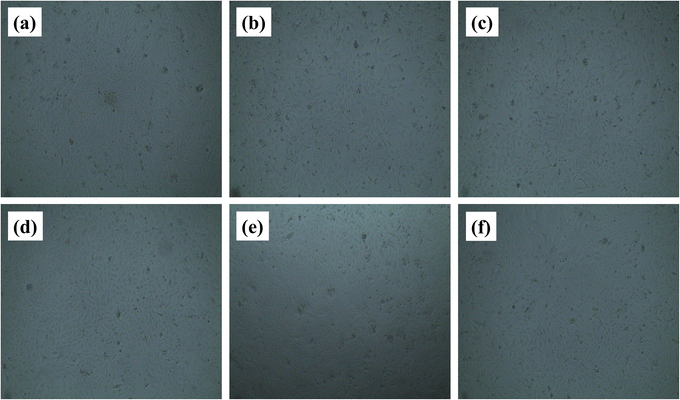
According to the results, all the nHAp samples showed no signs of cytotoxicity, and their cell viability was more than 95%. Based on ISO 10993-5: 2009, a material is termed cytotoxic if it has cell viability of less than 70%.81 Thus, according to this definition, the synthesized nHAp samples are very cytocompatible with a cell viability not less than 95%.
 | ||
| Fig. 10 Anti-bacterial activity of the prepared nHAp samples against: (a) E. coli and (b) S. aureus and (c) comparison based on zone of inhibition. | ||
Compared to the standard kanamycin (30 μg), the nHAp samples (400 μg mL−1) exhibited significant antibacterial efficacy against both Gram −ve (E. coli) and Gram +ve bacteria (S. aureus). The highest activity against E. coli and S. aureus was shown by HAp300 (14 nm) and HAp600 (14 nm), respectively. The antibacterial activity of kanamycin and HAp600 was the same for Gram-positive bacteria. A deeper look into the results revealed that the Gram-negative bacteria were slightly more susceptible to the HAp samples. Similar phenomena were also reported by Ragab et al.84
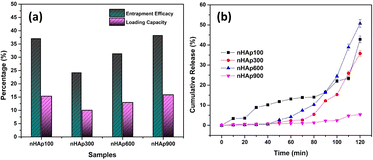 | ||
| Fig. 12 (a) DOXh loading study of the nHAp samples in terms of entrapment efficacy and loading capacity and (b) in vitro cumulative release% of DOXh from nHAp samples (pH = 7.4 at 37 °C). | ||
The highest EE (38.24%) was found for nHAp900, which was slightly higher than that of nHAp100 (37.01%), followed by nHAp600 and nHAp300. A similar pattern was observed for the LC of the samples. With an increase in the calcination temperature from 300 °C to 900 °C, a gradual increase in EE and LC was obtained except for nHAp100.
Fig. 12b presents the in vitro DOXh release in SBF at 37 °C with respect to time. The release was measured at intervals of 10 min up to 120 min under constant stirring. A similar release pattern was observed for nHAp300, nHAp600 and nHAp900, where almost the same amount of release was observed up to 40 min. In contrast, nHAp100 showed a higher initial release than the other samples until nHAp600 surpassed it after 70 min. Overall, a higher release was found for nHAp600, followed by nHAp100 and nHAp300. Although HAp900 showed the highest EE and LC, its cumulative release percentage was the lowest among the nHAp samples. Within 120 min, nHAp900 showed only 5.40% release, whereas nHAp600 showed 50.68% release. Interestingly, no initial burst release of DOXh was observed for any of the nHAp samples, although nHAp100 showed a slightly higher release, which does not depict burst release. This may be due to the fact that our loading protocol involved continuous stirring of the powdered nHAp sample and the drug solution, followed by multiple washings of the drug-loaded nHAp with DI and acetone, which eliminated the possibility of any slack binding of the drug molecules. Based on the observations, increased calcination temperatures lowered the release except for nHAp600. Thus, to achieve sustained release, nHAp900 will be the most suitable, having the highest loading and lowest release percentage.
3.6.6.1 Zero-order kinetic model. The zero-order kinetic model represents the drug delivery system, where the release of drugs is constant and does not depend on concentration. This relation is exploited to describe the drug release of several pharmaceutical systems, such as transdermal, matrix tablet, and osmotic systems.89 The simplest form of this model is represented as follows:
| Ct = Co + Kot | (12) |
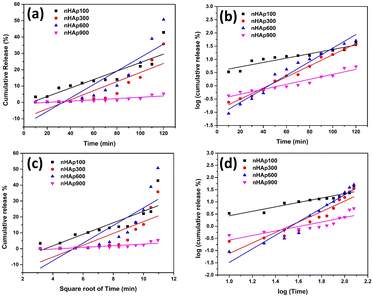 | ||
| Fig. 13 In vitro DOXh release kinetics from nHAp samples: (a) zero-order model, (b) first-order model, (c) Higuchi model and (d) Korsmeyer–Peppas model. | ||
| Sample | Zero-order model | First-order model | Higuchi model | Korsmeyer-Peppas model | |||||
|---|---|---|---|---|---|---|---|---|---|
| Ko | R2 | K1 | R2 | KH | R2 | KKP | n | R2 | |
| HAp100 | 0.2599 | 0.7578 | 0.01895369 | 0.8774 | 3.6156 | 0.6789 | 0.6529 | 0.9087 | 0.8878 |
| HAp300 | 0.2782 | 0.7112 | 0.04833997 | 0.9889 | 3.7084 | 0.5761 | 0.0381 | 2.1524 | 0.8491 |
| HAp600 | 0.4125 | 0.7628 | 0.0591871 | 0.9627 | 5.5417 | 0.6305 | 0.0140 | 2.7813 | 0.9316 |
| HAp900 | 0.0393 | 0.7078 | 0.02171729 | 0.9253 | 0.5272 | 0.5826 | 0.2244 | 0.9282 | 0.7228 |
3.6.6.2 First-order kinetic model. Drug delivery systems in which the adsorption and/or elimination of drugs are associated and the rate of release is dependent on the concentration are better explained by this model. The most primitive form of the first-order kinetic equation can be found in the report by Noyes et al.91 and the first application of this kinetics used in drug dissolution was found in the work of Gibaldi et al.92 Typically the release of water-soluble drugs from porous materials is well described by this kinetic model,89 and its simplified form equation can be expressed as follows:
 | (13) |
This equation can also be expressed as
 | (14) |
3.6.6.3 Higuchi kinetic model. Professor Takeru Higuchi introduced a mathematical equation that characterizes the release of drugs from matrix systems, specifically addressing the release of both water-soluble and poorly soluble drugs from semi-solid and solid matrix systems.93,94 The simplified Higuchi model, which relies on Fickian diffusion principles, elucidates drug release kinetics by establishing a linear correlation between the cumulative drug release and the square root of time.2 The equation is as follows:
| C = KH × t1/2 | (15) |
3.6.6.4 Korsmeyer-Peppas kinetic model. To elucidate both Fickian and non-Fickian drug release from either swelling or non-swelling polymeric systems, Korsmeyer and Peppas introduced a pragmatic formula as depicted below:95
| C = KKP × tn | (16) |
The kinetic parameters obtained from the model equations are represented in Table 4.
The best fitted model was chosen according to the highest correlation coefficient (R2) value. According to the data obtained, the first-order model is the best-fitted kinetic model that describes the DOXh release from the nHAp samples, except nHAp100, which was best described by the Korsmeyer–Peppas model. The value of n for DOXh release from nHAp100 and nHAp900 was 0.5 < n< 1, which depicts non- Fickian diffusion (non-swellable matrix diffusion). Alternatively, for nHAp300 and nHAp600, the value of n is greater than 1, which indicates super case II transport (relaxation/erosion drug release mechanism).88
3.7 XPS and FTIR analysis for drug loading mechanism
To comprehend the adsorption mechanism of DOXh on nHAp, XPS and FTIR analysis were carried out. nHAp100 and nHAp900, which showed the highest and closest loading percentage, were considered for this analysis. Similarly, after DOXh loading, the nHAp100-DOXh and nHAp900-DOXh samples were also considered, respectively. Fig. 14 represents the FTIR spectra before and after DOXh loading of nHAp100 and nHAp900. In both cases, the predominant absorption band, which is due to the presence of the PO43− group, shifted towards the higher wavenumber region. This suggests the formation of hydrogen bonds between the nHAp and DOXh molecules.A shift in the binding energy (BE) after DOXh loading was observed during the XPS analysis. Fig. 15 represents the XPS core level spectra of the major elements of nHAp100 and nHAp900 and the corresponding DOXh-loaded samples.
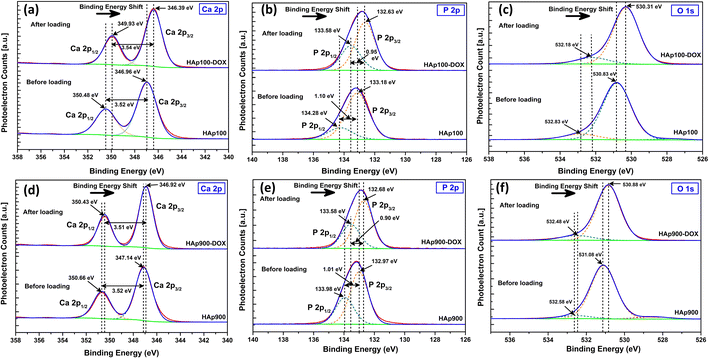 | ||
| Fig. 15 XPS core level spectra of Ca 2p, P 2p and O 1s before and after DOXh loading on (a–c) nHAp100 and (d–f) nHAp900, respectively. | ||
The deconvoluted core level spectra of Ca 2p for nHAp100 shows (Fig. 15a) a doublet separation of 3.52 eV (position of Ca 2p1/2 and Ca 2p3/2 at 350.48 eV and 346.96 eV, respectively).50 In the case of nHAp100-DOXh, a shift in the BE was observed, where Ca 2p1/2 and Ca 2p3/2 were observed at 349.93 eV and 346.39 eV with a doublet separation of 3.54 eV, respectively. In the case of nHAp900, Ca 2p1/2 and Ca 2p3/2 were observed at 350.66 eV and 347.14 eV (Fig. 15d) with a doublet separation of 3.52 eV, whereas after DOXh loading, the peaks of Ca 2p1/2 and Ca 2p3/2 shifted to 350.43 eV and 346.92 eV with a doublet separation of 3.51 eV, respectively. In both cases, the BE shifted to a lower BE.
In the case of the P 2p XPS peak, both nHAp100 and nHAp100-DOXh showed spin–orbit splitting into P 2p1/2 and P 2p3/2 with a doublet separation of 1.10 eV and 0.95 eV, respectively (Fig. 15b). In the case of nHAp900 and nHAp900-DOXh, this doublet separation was 1.01 eV and 0.90 eV, respectively (Fig. 15e). Both nHAp100 and nHAp900 showed a shift in BE after DOXh loading. In the O 1s core level spectra of nHAp100 and nHAp900 and the corresponding DOXh-loaded samples (Fig. 15c and f, respectively), a shift in the BE was also evident.
This shift in the BE towards a lower energy for all the peaks after DOXh loading depicts the chemical interaction of the Ca2+, PO43− and OH− sites of nHAp with DOXh, which led to the adsorption of DOXh on nHAp.96
4. Conclusion
The present study investigated how DOXh is loaded in and released from nHAp that underwent calcination at four different temperatures. The synthesis of nHAp involved the utilization of WCE through the wet chemical precipitation method. With an increase in calcination temperature, a variation in the crystallographic parameters and loading and release was observed. The DOXh loading decreased as the calcination temperature of nHAp increased from 100 °C to 300 °C but increased for nHAp600, reaching its peak value for nHAp900. A shift in the characteristic peaks after DOXh loading was observed by FTIR and XPS analysis, which depicted the chemical interaction of the nHAp carriers and DOXh. In the case of the release of DOXh, elevated calcination temperatures led to a decrease in its release, except in the case of nHAp600. Thus, to achieve sustained release, nHAp900 appears to be the most appropriate candidate due to its combination of the highest loading and lowest release percentage. Furthermore, the WCE-derived nHAp carriers were cytocompatible, hemocompatible, bioactive, and most importantly bactericidal against both Gram-negative (E. coli) and Gram-positive (S. aureus) bacteria.Author contributions
M. B. M. conceived the idea, formal analysis, wrote and finalized the manuscript; M. N. I. collected the raw materials and carried out the synthesis; F. C. carried out FESEM, EDX and bioactivity study; M. N. U. carried out hemolysis and antibacterial analysis; M. S. H. carried out XRD; M. M. carried out DLS and zeta potential analysis; U.S.A. carried out XPS analysis; N. H. T. carried out Raman analysis; A. F. M. M. R. resources; S. A. supervised the entire work. The results were jointly examined, and the manuscript was a product of teamwork that included all authors. Each author has reviewed and approved the final published version of the manuscript.Conflicts of interest
There are no conflicts to declare.Acknowledgements
We acknowledge the support from Bangladesh Council of Scientific and Industrial Research (BCSIR) through R&D project (ref. no. 39.02.0000.011.14.134.2021/900; Date: 30.12.2021). We would like to extend our gratitude to IGCRT, Dhaka Lab, BTRI, CARF and CARS.Notes and references
- J.-Q. Liu, M. Li, S. Yin, X. Chen, M. Li, Y. Pan, Y. Peng, J. Sun and A. Kumar, J. Mater. Chem. B, 2022, 10, 5105–5128 RSC.
- G. S. Kumar, R. Govindan and E. K. Girija, J. Mater. Chem. B, 2014, 2, 5052–5060 RSC.
- D. P. Lew and F. A. Waldvogel, Lancet, 2004, 364, 369–379 CrossRef CAS PubMed.
- I. G. Sia and E. F. Berbari, Best Pract. Res. Clin. Rheumatol., 2006, 20, 1065–1081 CrossRef PubMed.
- N. Kavanagh, E. J. Ryan, A. Widaa, G. Sexton, J. Fennell, S. O'Rourke, K. C. Cahill, C. J. Kearney, F. J. O'Brien and S. W. Kerrigan, Clin. Microbiol. Rev., 2018, 31, 000844 CrossRef PubMed.
- C. Zhong, Y. Wu, H. Lin and R. Liu, Composites, Part B, 2022, 110428 Search PubMed.
- A. L. L. Lima, P. R. Oliveira, V. C. Carvalho, S. Cimerman and E. Savio, Braz. J. Infect. Dis., 2014, 18, 526–534 CrossRef PubMed.
- S. K. Nandi, P. Mukherjee, S. Roy, B. Kundu, D. K. De and D. Basu, Mater. Sci. Eng. C, 2009, 29, 2478–2485 CrossRef CAS.
- M. Hasegawa, A. Sudo, V. S. Komlev, S. M. Barinov and A. Uchida, J. Biomed. Mater. Res. B Appl. Biomater., 2004, 70, 332–339 CrossRef PubMed.
- H. Alvarez, C. Castro, L. Moujir, A. Perera, A. Delgado, I. Soriano, C. Evora and E. Sanchez, J. Biomed. Mater. Res. B Appl. Biomater., 2008, 85, 93–104 CrossRef CAS PubMed.
- V. Mouriño and A. R. Boccaccini, J. R. Soc. Interface, 2010, 7, 209–227 CrossRef PubMed.
- J. S. Price, A. F. Tencer, D. M. Arm and G. A. Bohach, J. Biomed. Mater. Res., 1996, 30, 281–286 CrossRef CAS.
- Z. Ruszczak and W. Friess, Adv. Drug Deliv. Rev., 2003, 55, 1679–1698 CrossRef CAS PubMed.
- C. R. Arciola, D. Campoccia and L. Montanaro, Nat. Rev. Microbiol., 2018, 16, 397–409 CrossRef CAS PubMed.
- N. H. Alotaibi, M. U. Munir, N. K. Alruwaili, K. S. Alharbi, A. Ihsan, A. S. Almurshedi, I. U. Khan, S. N. A. Bukhari, M. Rehman and N. Ahmad, Pharmaceutics, 2022, 14, 975 CrossRef CAS PubMed.
- İ. Gürsel, F. Korkusuz, F. Türesin, N. G. Alaeddinoǧlu and V. Hasırcı, Biomaterials, 2000, 22, 73–80 CrossRef PubMed.
- L. Fan, J. Zhang and A. Wang, J. Mater. Chem. B, 2013, 1, 6261–6270 RSC.
- S. Sultana, M. S. Hossain, M. Mahmud, M. B. Mobarak, M. H. Kabir, N. Sharmin and S. Ahmed, RSC Adv., 2021, 11, 3686–3694 RSC.
- S. Lara-Ochoa, W. Ortega-Lara and C. E. Guerrero-Beltrán, Pharmaceutics, 2021, 13, 1642 CrossRef CAS PubMed.
- M. B. Mobarak, M. S. Hossain, Z. Yeasmin, M. Mahmud, M. M. Rahman, S. Sultana, S. M. Masum and S. Ahmed, J. Mol. Struct., 2022, 1252, 132142 CrossRef.
- M. S. Hossain, M. A. A. Shaikh, S. A. Jahan, M. Mahmud, M. B. Mobarak, M. S. Rahaman, M. N. Uddin and S. Ahmed, RSC Adv., 2023, 13, 9654–9664 RSC.
- M. S. Hossain, M. Mahmud, S. Sultana, M. Bin Mobarak, M. S. Islam and S. Ahmed, R. Soc. Open Sci., 2021, 8, 210684 CrossRef PubMed.
- M. Hossain, M. Mahmud, M. B. Mobarak and S. Ahmed, Chem. Pap., 2021, 1–13 Search PubMed.
- M. Hossain, M. Mahmud, M. B. Mobarak, S. Sultana, M. Shaikh, A. Ali and S. Ahmed, Chem. Pap., 2022, 1–7 Search PubMed.
- M. S. Hossain, M. M. Hasan, M. Mahmud, M. B. Mobarak and S. Ahmed, Chem. Pap., 2023, 77, 463–471 CrossRef CAS.
- O. P. Oni, Y. Hu, S. Tang, H. Yan, H. Zeng, H. Wang, L. Ma, C. Yang and J. Ran, Mater. Chem. Front., 2023, 7, 9–43 RSC.
- G. Devanand Venkatasubbu, S. Ramasamy, V. Ramakrishnan and J. Kumar, 3 Biotech, 2011, 1, 173–186 CrossRef CAS PubMed.
- X.-J. Ji, L. Gao, J.-C. Liu, J. Wang, Q. Cheng, J.-P. Li, S.-Q. Li, K.-Q. Zhi, R.-C. Zeng and Z.-L. Wang, Colloids Surf. B Biointerfaces, 2019, 179, 429–436 CrossRef CAS PubMed.
- U. Joosten, A. Joist, G. Gosheger, U. Liljenqvist, B. Brandt and C. von Eiff, Biomaterials, 2005, 26, 5251–5258 CrossRef CAS PubMed.
- S. Tang, B. Tian, Q.-F. Ke, Z.-A. Zhu and Y.-P. Guo, RSC Adv., 2014, 4, 41500–41509 RSC.
- F. Hilbrig and R. Freitag, Biotechnol. J., 2012, 7, 90–102 CrossRef CAS PubMed.
- K. Baskar, B. Saravana Karthikeyan, I. Gurucharan, S. Mahalaxmi, G. Rajkumar, V. Dhivya and A. Kishen, Int. Endod. J., 2022, 55, 89–102 CrossRef PubMed.
- S. A. Rani, K. Rajkumar, B. S. Karthikeyan, S. Mahalaxmi, G. Rajkumar and V. Dhivya, J. Mech. Behav. Biomed. Mater., 2023, 141, 105748 CrossRef PubMed.
- S. Kumar, G. M. Kumar, K. Shahapurkar, V. Tirth, A. Algahtani, T. Al-Mughanam, A. H. Alghtani and H. A. Murthy, J. Mech. Behav. Biomed. Mater., 2023, 105963 CrossRef PubMed.
- A. L. Angelette, L. L. Rando, R. D. Wadhwa, A. A. Barras, B. M. Delacroix, N. C. Talbot, S. Ahmadzadeh, S. Shekoohi, E. M. Cornett and A. M. Kaye, Adv. Ther., 2023, 40, 1366–1378 CrossRef CAS PubMed.
- A. R. Zelmer, R. Nelson, K. Richter and G. J. Atkins, Bone Res., 2022, 10, 53 CrossRef CAS PubMed.
- B. Spellberg and B. A. Lipsky, Clin. Infect. Dis., 2012, 54, 393–407 CrossRef PubMed.
- L. Ding, P. Zhang, X. Wang and S. Kasugai, Clin. Implant Dent. Rel. Res., 2019, 21, 154–159 CrossRef PubMed.
- X. Wang, H. Xu, Y. Zhao, S. Wang, H. Abe, M. Naito, Y. Liu and G. Wang, Mater. Sci. Eng. B, 2012, 177, 367–372 CrossRef CAS.
- R. Ramírez-Agudelo, K. Scheuermann, A. Gala-García, A. P. F. Monteiro, A. D. Pinzón-García, M. E. Cortés and R. D. Sinisterra, Mater. Sci. Eng. C, 2018, 83, 25–34 CrossRef PubMed.
- C. Soriano-Souza, H. Valiense, E. Mavropoulos, V. Martinez-Zelaya, A. M. Costa, A. T. Alves, M. Longuinho, R. Resende, C. Mourão, J. Granjeiro, M. H. Rocha-Leao, A. Rossi and M. Calasans-Maia, J. Biomed. Mater. Res., 2020, 108, 1351–1362 CrossRef CAS PubMed.
- H. Semyari, M. Salehi, F. Taleghani, A. Ehterami, F. Bastami, T. Jalayer, H. Semyari, M. Hamed Nabavi and H. Semyari, J. Biomater. Appl., 2018, 33, 501–513 CrossRef CAS PubMed.
- V. Andrei, N. I. Fiț, I. Matei, R. Barabás, L. A. Bizo, O. Cadar, B. A. Boșca, N.-I. Farkas, L. Marincaș and D.-M. Muntean, Materials, 2022, 15, 6225 CrossRef CAS PubMed.
- M. Trzaskowska, V. Vivcharenko and A. Przekora, Int. J. Mol. Sci., 2023, 24, 5083 CrossRef CAS PubMed.
- M. B. Mobarak, M. S. Hossain, Z. Yeasmin, M. Mahmud, M. M. Rahman, S. Sultana, S. M. Masum and S. Ahmed, J. Mol. Struct., 2022, 1252, 132142 CrossRef.
- S. D. Lala, E. Barua, P. Deb and A. B. Deoghare, Mater. Today Commun., 2021, 27, 102443 CrossRef.
- A. C. Tas, Biomaterials, 2000, 21, 1429–1438 CrossRef CAS PubMed.
- T. Kokubo, H. Kushitani, S. Sakka, T. Kitsugi and T. Yamamuro, J. Biomed. Mater. Res., 1990, 24, 721–734 CrossRef CAS PubMed.
- P. Li, C. Ohtsuki, T. Kokubo, K. Nakanishi, N. Soga, T. Nakamura and T. Yamamuro, J. Am. Ceram. Soc., 1992, 75, 2094–2097 CrossRef CAS.
- M. B. Mobarak, N. S. Pinky, F. Chowdhury, M. S. Hossain, M. Mahmud, M. S. Quddus, S. A. Jahan and S. Ahmed, J. Saudi Chem. Soc., 2023, 101690 CrossRef.
- C. Perez, Acta Biol. Med. Exp., 1990, 15, 113–115 Search PubMed.
- V. P. Padmanabhan, S. N. TSN, S. Sagadevan, M. E. Hoque and R. Kulandaivelu, New J. Chem., 2019, 43, 18484–18494 RSC.
- R. Yang, R. Wang, S. Abbaspoor, M. Rajan, A. T. Jalil, M. M. Saleh and W. Wang, Arab. J. Chem., 2023, 16, 104799 CrossRef CAS.
- D. Dasgupta and A. Patel, Mater. Adv., 2022, 3, 8220–8228 RSC.
- S. M. Londoño-Restrepo, R. Jeronimo-Cruz, B. M. Millán-Malo, E. M. Rivera-Muñoz and M. E. Rodriguez-García, Sci. Rep., 2019, 9, 1–12 CrossRef PubMed.
- J. H. G. Rocha, A. F. Lemos, S. Kannan, S. Agathopoulos and J. M. F. Ferreira, J. Mater. Chem., 2005, 15, 5007–5011 RSC.
- J. Zhan, Y.-H. Tseng, J. C. Chan and C.-Y. Mou, Adv. Funct. Mater., 2005, 15, 2005–2010 CrossRef CAS.
- I. Mobasherpour, M. S. Heshajin, A. Kazemzadeh and M. Zakeri, J. Alloys Compd., 2007, 430, 330–333 CrossRef CAS.
- G. Xu, I. A. Aksay and J. T. Groves, J. Am. Chem. Soc., 2001, 123, 2196–2203 CrossRef CAS PubMed.
- E. Garskaite, K.-A. Gross, S.-W. Yang, T. C.-K. Yang, J.-C. Yang and A. Kareiva, CrystEngComm, 2014, 16, 3950–3959 RSC.
- W. Wijesinghe, M. Mantilaka, E. V. A. Premalal, H. Herath, S. Mahalingam, M. Edirisinghe, R. Rajapakse and R. M. G. Rajapakse, Mater. Sci. Eng. C, 2014, 42, 83–90 CrossRef CAS PubMed.
- G. Montes-Hernandez and F. Renard, J. Phys. Chem. C, 2020, 124, 15302–15311 CrossRef CAS.
- U. Anjaneyulu, D. K. Pattanayak and U. Vijayalakshmi, Mater. Manuf. Processes, 2016, 31, 206–216 CrossRef CAS.
- J. A. Stammeier, B. Purgstaller, D. Hippler, V. Mavromatis and M. Dietzel, MethodsX, 2018, 5, 1241–1250 CrossRef PubMed.
- J. Xue, A. Farris, Y. Wang, W. Yeh, C. Romany, J. K. Guest, W. L. Grayson, A. S. Hall and T. P. Weihs, Coatings, 2020, 10, 715 CrossRef CAS.
- A. Gupta, A. Prasad, N. Mulchandani, M. Shah, M. Ravi Sankar, S. Kumar and V. Katiyar, ACS Omega, 2017, 2, 4039–4052 CrossRef CAS PubMed.
- V. P. Padmanabhan, R. Kulandaivelu, D. S. Panneer, S. Vivekananthan, S. Sagadevan and J. A. Lett, Mater. Res. Innov., 2020, 24(3), 171–178 CrossRef CAS.
- V. Rodríguez-Lugo, T. V. K. Karthik, D. Mendoza-Anaya, E. Rubio-Rosas, L. S. Villaseñor Cerón, M. I. Reyes-Valderrama and E. Salinas-Rodríguez, R. Soc. Open Sci., 2018, 5, 180962 CrossRef PubMed.
- Y. C. Teh, C. Y. Tan, S. Ramesh, J. Purbolaksono, Y. M. Tan, H. Chandran, W. D. Teng and B. K. Yap, Ceramics, 2014, 58, 320–325 CAS.
- C. Kothapalli, M. Wei, A. Vasiliev and M. T. Shaw, Acta Mater., 2004, 52, 5655–5663 CrossRef CAS.
- I. R. Gibson, S. Ke, S. M. Best and W. Bonfield, J. Mater. Sci.: Mater. Med., 2001, 12, 163–171 CrossRef CAS PubMed.
- M. B. Mobarak, M. S. Hossain, F. Chowdhury and S. Ahmed, Arab. J. Chem., 2022, 15, 104117 CrossRef.
- O. G. Agbabiaka, I. O. Oladele, A. D. Akinwekomi, A. A. Adediran, A. O. Balogun, O. G. Olasunkanm and T. M. A. Olayanju, Sci. African, 2020, 8, e00452 Search PubMed.
- K. P. Sanosh, M.-C. Chu, A. Balakrishnan, T. N. Kim and S.-J. Cho, Bull. Mater. Sci., 2009, 32, 465–470 CrossRef CAS.
- S. Safi, F. Karimzadeh and S. Labbaf, Mater. Sci. Eng. C, 2018, 92, 712–719 CrossRef CAS PubMed.
- G. Verma, K. C. Barick, N. G. Shetake, B. N. Pandey and P. A. Hassan, RSC Adv., 2016, 6, 77968–77976 RSC.
- J. M. Alsharef, M. R. Taha and T. A. Khan, J. Teknol., 2017, 79, 69–81 Search PubMed.
- S.-L. Bee, Y. Bustami, A. Ul-Hamid, K. Lim and Z. A. Abdul Hamid, J. Mater. Sci.: Mater. Med., 2021, 32, 106 CrossRef CAS PubMed.
- S. L. Aktuğ, S. Durdu, E. Yalçın, K. Çavuşoğlu and M. Usta, Mater. Sci. Eng. C, 2017, 71, 1020–1027 CrossRef PubMed.
- E. A. Ofudje, A. I. Adeogun, M. A. Idowu and S. O. Kareem, Heliyon, 2019, 5, e01716 CrossRef PubMed.
- I. O. for Standardization, 2009.
- G. S. Kumar, S. Rajendran, S. Karthi, R. Govindan, E. K. Girija, G. Karunakaran and D. Kuznetsov, MRS Commun., 2017, 7, 183–188 CrossRef CAS.
- S. Lamkhao, M. Phaya, C. Jansakun, N. Chandet, K. Thongkorn, G. Rujijanagul, P. Bangrak and C. Randorn, Sci. Rep., 2019, 9, 4015 CrossRef PubMed.
- H. S. Ragab, F. A. Ibrahim, F. Abdallah, A. A. Al-Ghamdi, F. El-Tantawy, N. Radwan and F. Yakuphanoglu, IOSR J. Pharm. Biol. Sci., 2014, 9, 77–85 Search PubMed.
- V. Sarath Chandra, G. Baskar, R. V. Suganthi, K. Elayaraja, M. I. Ahymah Joshy, W. Sofi Beaula, R. Mythili, G. Venkatraman and S. Narayana Kalkura, ACS Appl. Mater. Interfaces, 2012, 4, 1200–1210 CrossRef CAS PubMed.
- S. R. Chowdhury, A. Mishra, B. Pradhan and D. Saha, Wear, 2004, 256, 1026–1036 CrossRef CAS.
- A. Sasireka, R. Rajendran, P. Priya and V. Raj, ChemistrySelect, 2019, 4, 1166–1175 CrossRef CAS.
- M. P. Paarakh, P. A. Jose, C. M. Setty and G. V. Peterchristoper, Int. J. Pharm. Res. Technol., 2018, 8, 12–20 CrossRef.
- S. Dash, P. N. Murthy, L. Nath and P. Chowdhury, Acta Pol. Pharm., 2010, 67, 217–223 CAS.
- K. Huanbutta and T. Sangnim, J. Drug Delivery Sci. Technol., 2019, 52, 831–837 CrossRef CAS.
- A. A. Noyes and W. R. Whitney, J. Am. Chem. Soc., 1897, 19, 930–934 CrossRef.
- M. Gibaldi and S. Feldman, J. Pharmaceut. Sci., 1967, 56, 1238–1242 CrossRef CAS PubMed.
- T. Higuchi, J. Pharmaceut. Sci., 1963, 52, 1145–1149 CrossRef CAS PubMed.
- T. Higuchi, J. Pharmaceut. Sci., 1961, 50, 874–875 CrossRef CAS PubMed.
- R. W. Korsmeyer, R. Gurny, E. Doelker, P. Buri and N. A. Peppas, Int. J. Pharm., 1983, 15, 25–35 CrossRef CAS.
- H. Bensalah, S. A. Younssi, M. Ouammou, A. Gurlo and M. F. Bekheet, J. Environ. Chem. Eng., 2020, 8, 103807 CrossRef CAS.
| This journal is © The Royal Society of Chemistry 2023 |

