 Open Access Article
Mixed valence copper oxide composites derived from metal–organic frameworks for efficient visible light fuel denitrification†
Jian Lia,
Renkun Huang *abc,
Lu Chen
 bc,
Yuzhou Xia
 bc,
Guiyang Yan
 bc and
Ruwen Liang
 *bc
*bc
aState Key Laboratory of Photocatalysis on Energy and Environment, Fuzhou University, Fuzhou 350002, China
bProvince University Key Laboratory of Green Energy and Environment Catalysis, Ningde Normal University, Ningde 352100, China
cFujian Provincial Key Laboratory of Featured Materials in Biochemical Industry, Ningde Normal University, Ningde 352100, China. E-mail: t1432@ndnu.edu.cn; Tel: +86-15860671891
First published on 14th December 2023
Abstract
The construction of heterojunctions has been used to optimize photocatalyst fuel denitrification. In this work, HKUST-1(Cu) was used as a sacrificial template to synthesize a composite material CuxO (CuO/Cu2O) that retains the original MOF framework for photocatalytic fuel denitrification by calcination at different temperatures. By adjusting the temperature, the content of CuO/Cu2O can be changed to control the performance and structure of CuxO-T effectively. The results show that CuxO-300 has the best photocatalytic performance, and its denitrification rate reaches 81% after 4 hours of visible light (≥420 nm) irradiation. Through the experimental analysis of pyridine's infrared and XPS spectra, we found that calcination produces CuxO-T mixed-valence metal oxide, which can create more exposed Lewis acid sites in the HKUST-1(Cu) framework. This leads to improved pyridine adsorption capabilities. The mixed-valence metal oxide forms a type II semiconductor heterojunction, which accelerates carrier separation and promotes photocatalytic activity for pyridine denitrification.
Introduction
Fossil fuels are the most critical and valuable energy source in the world. Human development and environmental change are closely related to their use.1,2 A large number of nitrogen-containing compounds (NCCs), such as pyridine and pyrrole, are produced in the use of fuels (gasoline and diesel).3–5 Combustion will lead to NOx emissions, pollute the environment, and seriously affect human health through the respiratory tract.6 Therefore, research on removing NCCs from crude gasoline fuel has become a global hotspot.7,8 Currently, the classical technology used in industry to remove nitrogen species from fuels is hydrodenitrogenation (HDN). However, this method requires high temperature and pressure conditions, which increase the cost.9 This has shifted people's attention towards photocatalytic one-pot removal of NCCs, a more environmentally friendly technology.10 The search for better gasoline fuel denitrification photocatalysts is a top priority in fuel purification research.Currently, researchers aim to use Bi-based or Co-based materials for photocatalytic removal of NCCs.11–14 However, these materials still have low catalytic efficiency and unstable chemical properties. Several studies indicate that adding Cu enhances the material's pyridine adsorption and promotes photocatalytic reaction. Lu et al. introduced Cu to enhance the photocatalytic denitrification ability of a CuCo-ZIF bimetallic material.15 Pure copper oxide (CuO) and cuprous oxide (Cu2O) are promising catalysts due to their p-type semiconductor properties and narrow band gap (1.2 eV and 2 eV, respectively).16 However, the high recombination rate of photogenerated carriers and low photocatalytic activity of copper oxide limit its practical application.17,18 At the same time, the performance of a catalyst is affected by its morphology.19 Porous nanostructures with high specific surface area and excellent photogenerated carrier transport properties are considered to be critical components of photocatalytic materials.20–22
Metal–organic frameworks (MOFs) exhibit high specific surface area and ease of synthesis.23–25 The metal–organic framework can serve as a template for synthesizing porous metal oxides through self-sacrifice.26,27 The MOF derivatives prepared in this way not only improve the thermal/chemical stability of the original parent MOF but also retain the original fascinating structural characteristics of the parent MOF, such as large surface area, tunable structure, and surface permeability, which better enhance the photocatalytic performance of the material.28–30 Moreover, compared with traditional metal oxides, the porous structure of MOF-derived metal oxides has a larger number of active sites, which enhances their adsorption and catalytic ability.31–33 Cu-based MOFs were used as templates to synthesize CuO/Cu2O with the original framework. Bagheri et al. discovered that by transforming Cu-based MOFs into CuO, they could efficiently promote the conversion of 4-nitrophenol to 4-aminophenol while retaining some of the crystal structure of HKUST-1 (Quasi-MOF).34 The construction of heterojunctions can accelerate the electron transfer of materials and improve the catalytic performance.35,36 Currently, most studies on producing metal oxide nanoparticles through Cu-MOF pyrolysis focus on their application in gas adsorption and organic conversion.37,38 However, there are limited reports on using CuO/Cu2O nanoparticles, which retain the original octahedral MOF framework, for photocatalytic fuel denitrification.
In this paper, copper-based MOF (HKUST-1) with high adsorption was selected as the ideal pre-sacrifice for the preparation of mixed valence metal oxide CuxO (CuO/Cu2O), and the photocatalytic denitrification performance of CuxO generated under different temperature gradients was investigated. The results showed that CuxO-T with HKUST-1(Cu) octahedral framework showed more vital visible light activity for denitrification of typical NCCs (such as pyridine), and CuxO-300 exhibited the best degradation rate of 81% for pyridine. Finally, the possible photocatalytic reaction mechanism and the action form of active sites were discussed. This work demonstrates the excellent performance of Cu-based catalysts for removing NCCs. It confirms the feasibility of improving photocatalytic activity by calcination retaining the original MOF structure to expose its active sites and form mixed-valence metal oxides.
Experimental
Reagents and chemicals
1,3,5-Benzene tricarboxylic acid (H3BTC, 98%) was supplied by Aladdin Reagent Co., Ltd (Shanghai, China). Copper(II) nitrate trihydrate (Cu(NO3)2·3H2O, 99 wt%), sodium hydroxide (NaOH, 97 wt%), N,N-dimethylformamide (DMF, 99.5 wt%), anhydrous ethanol (EtOH, 99.5 wt%), pyridine (99.5 wt%), and octane (99.5 wt%) were purchased by Sinopharm Chemical Reagent Co., Ltd (Shanghai, China). All chemical reagents are of analytical grade and used as received.Preparation of HKUST-1 (Cu)
HKUST-1(Cu) catalyst was prepared by solvothermal method. Firstly, 2.00 g Cu (NO3)2·3H2O (8.29 mmol) and 1.00 g 1,3,5-benzene tricarboxylic acid (4.76 mmol) were weighed and dissolved in 24 mL 1![[thin space (1/6-em)]](https://www.rsc.org/images/entities/char_2009.gif) :
:![[thin space (1/6-em)]](https://www.rsc.org/images/entities/char_2009.gif) 1
1![[thin space (1/6-em)]](https://www.rsc.org/images/entities/char_2009.gif) :
:![[thin space (1/6-em)]](https://www.rsc.org/images/entities/char_2009.gif) 1 (volume ratio) deionized water/DMF/EtOH mixed solvent, respectively. Then the above solution was mixed and continued to stir until a uniform blue mixed solution was obtained. The above-mixed solution was transferred to a 100 mL hydrothermal reactor with polytetrafluoroethylene lining and reacted at 85 °C for 20 h. After the reaction, it was naturally cooled to room temperature and filtered. Finally, the product was washed several times with ethanol and then placed in a vacuum drying oven at 60 °C for 24 h to obtain the catalyst HKUST-1(Cu).
1 (volume ratio) deionized water/DMF/EtOH mixed solvent, respectively. Then the above solution was mixed and continued to stir until a uniform blue mixed solution was obtained. The above-mixed solution was transferred to a 100 mL hydrothermal reactor with polytetrafluoroethylene lining and reacted at 85 °C for 20 h. After the reaction, it was naturally cooled to room temperature and filtered. Finally, the product was washed several times with ethanol and then placed in a vacuum drying oven at 60 °C for 24 h to obtain the catalyst HKUST-1(Cu).
Preparation of mixed-valence CuxO
HKUST-1(Cu) was used as a pre-sacrificial body, and a suitable sample was weighed and placed in a ceramic crucible and a muffle furnace. Firstly, the temperature was heated to 300 °C at a heating rate of 5 °C min−1, and then the temperature was increased to 350 °C, 400 °C, and 500 °C at a rate of 2 °C min−1. When the specified temperature was reached, the sample was kept in a muffle furnace for two hours (Fig. S1†). Then it was taken out after cooling to room temperature to obtain black powder CuxO-T (CuxO-300, CuxO-350, CuxO-400, CuxO-500 according to the calcination temperature T). In addition, flake CuO nanomaterials were prepared by hydrothermal method for comparison.Characterization
X-ray diffraction (XRD) patterns were obtained using a Bruker D8 Advance X-ray powder diffractometer. Fourier transform infrared reflectance (FT-IR) spectra were measured using a Shimadzu infrared spectrophotometer. TESCAN MIRA4 field emission scanning electron microscope (SEM) and Tecnai G2 F20 S-TWIN (FEI) transmission electron microscope (TEM) were used to analyze the morphology of the prepared samples. The pieces ' X-ray photoelectron spectroscopy (XPS) profiles were obtained using a Thermo Fisher K-Alpha instrument equipped with a monochromatic Al Lα X-ray source. UV-Vis diffuse reflectance spectroscopy (DRS) of the samples was performed using a Shimadzu UV-2700 UV-Vis-IR spectrophotometer in the 250–800 nm wavelength range. Photocurrent measurement using BAS Epsilon workstation. Electrochemical impedance spectroscopy (EIS) experiments using a precision PARC workstation.Photocatalytic activity measurements
First, 70 mg of pyridine was dissolved in 1.0 L of n-octane to prepare 100 μg g−1 of simulated gasoline fuel containing NCCs. Then, 50 mg of photocatalyst and 50 mL of pyridine/n-octane solution (100 μg g−1) were added to the quartz reactor. The suspension was stirred in the dark for two hours to ensure adsorption–desorption equilibrium. After that, the suspension was irradiated with a 300 W xenon lamp (PLS-SXE 300) equipped with an ultraviolet cut-off filter to cut off light with a less than 420 nm wavelength. During the selected time interval, the equipartition of the suspension was removed and centrifuged. The Varian Cary 60 spectrometer was used to monitor the remaining pyridine concentration in the supernatant. The maximum absorbance measured at different reaction times was converted to the denitrification ratio of pyridine. The expression is denitrification ratio of pyridine = (C0 − Ct)/C0 × 100%.Results and discussion
Characterization of the prepared samples
The XRD spectra of HKUST-1(Cu) and CuxO-T composites are shown in Fig. 1. The position of each diffraction peak in HKUST-1(Cu) agrees with the situation reported in the literature.39,40 With the increase in calcination temperature, the XRD peak intensity of HKUST-1(Cu) gradually decreased, indicating that the skeleton collapsed. At a temperature of 250 °C, both HKUST-1(Cu) and CuxO still exhibit XRD diffraction peaks. At 300 °C, only CuO (PDF # 80-1917) and Cu2O (PDF # 65-3288) diffraction peaks are visible, while those of HKUST-1(Cu) disappear. At 300 °C, 350 °C, and 400 °C, the XRD local amplification spectrum of CuxO-T composites reveals the presence of the characteristic Cu2O peak at 36.5°.41 However, at 500 °C, the Cu2O peak disappears entirely, which suggests that Cu2O undergoes a conversion to CuO at high temperatures (Fig. 1(b)). Thermogravimetric analysis was conducted on HKUST-1(Cu) in Fig. 1(c). The compound decomposes gradually with increasing temperature, causing the initial loss of free/bound water molecules. Tricarboxylic acid deteriorated significantly at 300 °C, leading to substantial weight loss. At last, the TGA curve leveled off around 350 °C. To protect the MOF template structure and remove organic ligands, HKUST-1(Cu) was converted to CuxO at 300 °C. Choose a temperature between 350-600 °C for the second step to convert CuxO into CuO and determine the maximum temperature that destroys the MOF structure. | ||
| Fig. 1 (a) X-ray diffraction pattern; (b) enlarged XRD patterns in the 2θ range from 32 to 42°; (c) Thermogravimetric analysis curve of HKUST-1 in air atmosphere. | ||
Fig. S2(a)† shows the typical FT-IR spectra of HKUST-1(Cu) and CuxO-T composites. The peaks at 1645 and 1445 cm−1, indicated –O–C–O– bond. Meanwhile, the absorption peak at 1368 cm−1 is associated with the stretching mode of C–O. The bending vibration peak of the C–H bond at 940 cm−1. The bands locate at 721 and 488 cm−1 may be related to the bending mode and stretching mode of Cu–O, respectively. The band at around 721 cm−1 confirms the coordination of Cu2+ and –COOH.42 With the increase in calcination temperature, the disappearance of characteristic peaks from each functional group confirmed ligand decomposition of HKUST-1(Cu). This is in agreement with the XRD results, confirming successful pyrolysis and sample preparation.
The samples' surface area and pore structure were measured by N2 desorption–adsorption. With the rise in calcination temperature, the BET-specific surface area and pore volume of CuxO-T samples decreased significantly due to the decomposition of organic ligands in the framework (Fig. S2(b) and Table S1†). The BET-specific surface area of CuxO-300 is about 17.68 m2 g−1, and the pore volume is about 0.154 cm3 g−1. Compared to CuxO at other temperatures, CuxO-300 has a larger specific surface area. This means that more active sites can be provided to improve catalytic performance.
The SEM images of HKUST-1(Cu) and CuxO-T composites are shown in Fig. 2. The crystal size of HKUST-1(Cu) is 5–7 μm, with a typical octahedral structure and a very smooth surface (Fig. 2(a)).43 Fig. 2(b) and (c) shows the sheet-like nanostructures of CuO as a control. As shown in Fig. 2(d), the morphology of the sample (CuxO-250) obtained at the lowest calcination temperature is similar to that of HKUST-1(Cu). Still, the surface begins to be gradually decorated by CuxO particles, and the morphology becomes unsmooth, attributed to the pyrolysis of MOF in the air. As the calcination temperature increases (CuxO-300) (Fig. 2(e) and (f)), CuxO particles gradually form, creating a rough surface with a thick dot shape while still maintaining an octahedral structure. Fig. 2(g) and (h) shows that increasing the calcination temperature leads to higher crystallization rates, larger particle sizes, and uniform distribution in CuxO-350 and CuxO-400 samples. However, when the temperature rises to 500 °C, the morphology and structure of CuxO-500 (Fig. 2(i)) are destroyed, CuxO is pyrolyzed, the particles fall off, and direct rapid heating is not conducive to maintaining the porous structure of MOF.
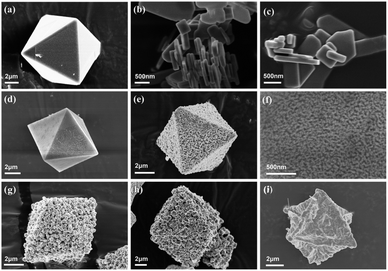 | ||
| Fig. 2 (a) SEM images of HKUST-1(Cu), (b and c) flake CuO, (d) CuxO-250, (e and f) CuxO-300, (g) CuxO-350, (h) CuxO-400 and (i) CuxO-500. | ||
Additionally, energy dispersive spectroscopy (EDS) spectrum was used to explore the elemental composition of the material. Random regions of CuxO-250, CuxO-300 and CuxO-500 are selected for detection, respectively (Fig. S3(a)–(c)†). Obtain CuxO-250, CuxO-300 and CuxO-500 corresponding EDS spectrum (Fig. S3(d)–(f)†). From the EDS spectrum of CuxO-250 several well-defined peaks were evident related to C, Cu and O, but in CuxO-300 and CuxO-500, the carbon content is drastically reduced. Trace carbon to maintain the original framework. Changes in the ratio of Cu to O at different temperatures are also indirectly evidenced by changes in Cu+/Cu2+ content.
TEM images of as-prepared HKUST-1 sample reveal regular octahedron morphology having smooth surface (Fig. S4†). The TEM images in Fig. 3(a) show the octahedral shape of CuxO-300 particles, preserved even after pyrolysis, with scattered edges visible. In Fig. 3(b), high-resolution TEM images of CuxO-300 are presented. The images show lattice fringes with a spacing of 0.30 nm and 0.25 nm, corresponding to the (110) lattice plane of Cu2O and the (002) lattice plane of CuO, respectively.44,45 It has been confirmed that the synthesis of CuxO-300 was successful.
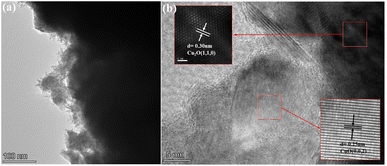 | ||
| Fig. 3 (a) Transmission electron microscope (TEM) of CuxO-300 and (b) high-resolution TEM of CuxO-300. | ||
The elemental composition and valence state of CuxO-T were determined by XPS, and the oxidation state of Cu element on the surface of CuxO-T composites was studied by high-resolution XPS (Fig. 4). The spectrum mainly shows the proportion of different valence Cu elements at different temperatures CuxO, and semi-quantitative analysis is carried out. The two characteristic peaks at 952.5 and 932.8 eV correspond to the binding energies of Cu+ 2p1/2 and 2p3/2 electrons, while the two characteristic peaks at 953.8 and 933.8 eV correspond to the binding energies of Cu2+ 2p1/2 and 2p3/2, respectively.46,47 In addition, satellite peaks with 2p1/2 and 2p3/2 peaks were also observed, corresponding to the electronic oscillation,48 indicating the presence of Cu2+ and the coexistence of Cu2O and CuO on CuxO-T. It can be found that in CuxO-T, the ratio of Cu+/Cu2+ gradually decreases with the increase in temperature, and the ratio of CuxO-300 is the highest at other temperatures, while CuxO-500 is the lowest.
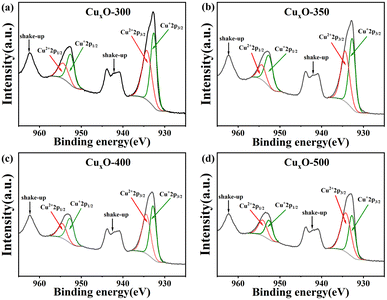 | ||
| Fig. 4 (a) CuxO-300, (b) CuxO-350, (c) CuxO-400, and (d) CuxO-500 Cu 2p high-resolution XPS spectra. | ||
Photocatalytic performance
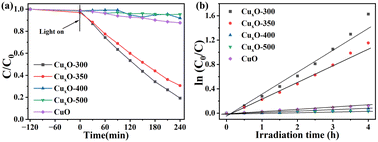
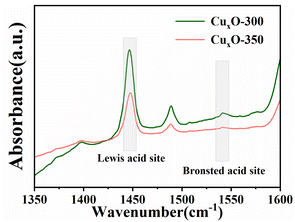
The photoactivity of CuxO-T for NCCs (such as pyridine) denitrification was evaluated by visible light (λ ≥ 420 nm). As shown in Fig. 5, the dark reaction indicates that pyridine denitrification almost does not occur under dark conditions. Under light irradiation, CuxO-300 exhibited higher photocatalytic activity within 240 min compared with flaky CuO (∼15%). Fig. 5(a) corresponds to pyridine denitrification efficiency between CuxO-T and CuO. Among the four samples prepared by the two-step calcination method, the CuxO-300 sample has the highest photocatalytic activity (∼81%). The kinetic data of the pyridine denitrification reaction are shown in Fig. 5(b). The rate constants of CuxO-300, CuxO-350, CuxO-400, CuxO-500, and flaky CuO were calculated to be 0.345, 0.235, 0.015, 0.010, and 0.025 h−1, respectively. The quantitative analysis data show that the photocatalytic activity of CuxO-300 is about 12.8 times higher than that of flaky CuO synthesized by the hydrothermal method. The high photoactivity of CuxO-300 can be attributed to (i) CuxO-300 has a relatively high specific surface area based on maintaining the original MOF structure, which is conducive to the adsorption of pyridine molecules on the surface of CuxO;49 (ii) the formation of tiny CuxO particles in this unique octahedral structure exposes more active sites of unsaturated valence metal centers, and the distance between the carrier and the surface active site is shorter; (iii) CuxO small particles have superior optical properties, and the transport distance between carriers is shorter, which is conducive to the separation of carriers. However, too high a temperature to generate larger CuxO particles destroys the MOF structure, causes more CuO to cover the active sites of Cu2O, increases the particle spacing, and hinders the carrier's reaction with pyridine molecules. In summary, the CuxO-300 composite material is beneficial in improving its photocatalytic denitrification ability for pyridine (Table S2†).In order to determine the active sites of the materials, we performed acidity tests on the pyridine-FTIR spectra of the better-performing samples. As shown in Fig. 6, the pyridine-FTIR spectra of CuxO-300 and CuxO-350 showed a sharp peak at 1441 cm−1, indicating the presence of Lewis acid center, and a sharp peak at 1530 cm−1 indicating the presence of Brønsted acid center.11 The mixture of acids in CuxO-300 and CuxO-350 was dominated by Lewis acid. Furthermore, pyridine can readily bind to the central metal Lewis acid in CuxO-300 and CuxO-350 due to its Lewis base properties. The exposed Cu+/Cu2+ metal active center can be a Lewis acid to absorb the basic pyridine through coordination. This suggests that CuxO-T exhibits a high affinity towards pyridine. In addition, CuxO-300 has a significantly higher concentration of Lewis and Brønsted acid sites than CuxO-350 approximately 2.02 times more. As a result, CuxO-300 is more effective in adsorbing pyridine, thanks to its excellent content of metal-centered acid sites. This enhances the transfer and separation of photogenerated carriers. The superior photocatalysis of CuxO-300 is due to this reason.
The reusability and stability of the CuxO-T photocatalyst were studied. As shown in Fig. S3(a) and (b),† the photocatalytic activity of CuxO-300 is still high after four reaction cycles, indicating good catalytic stability. The crystal structure of the photocatalyst used remained unchanged compared to the fresh photocatalyst, as seen from the XRD analysis.
Photocatalytic mechanism
Photoelectrochemical experiments were carried out further to explain carrier transfer and separation efficiency. Fig. 7(a) displays the transient photocurrent response curve, which reveals that CuxO-300 exhibits the highest photocurrent intensity when exposed to light. This indicates that CuxO-300 has a longer lifetime of photogenerated electron–hole pairs than other synthesized materials, resulting in more effective separation and transfer of photogenerated carriers.42 To better understand the excellent carrier transport properties of CuxO-300, we drew the EIS Nyquist diagram (Fig. 7(b)), whose arc radius reflects the solid interface delamination and surface charge transfer resistance.50 The radius of CuxO-300 is the smallest, indicating that CuxO-300 can minimize the interface charge transfer resistance and increase the carrier charge transfer ratio. In summary, CuxO-300 with more mixed valence unsaturated active sites can reduce the recombination rate of photogenerated carriers and accelerate separation and transfer.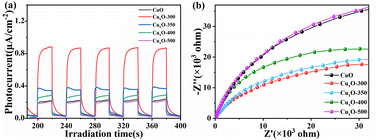 | ||
| Fig. 7 (a) Transient photocurrent response curve and (b) electrochemical impedance spectroscopy analysis. | ||
Synthesised materials were studied for absorption spectra by employing UV-Visible Diffuse reflectance spectra that is illustrated in Fig. S6.† However, the overall black color of the synthetic material makes it difficult to determine its optical properties by DRS. XPS valence band (VB-XPS) was able to identify the valence band (VB) maximum of CuO and Cu2O (Fig. S7(a) and (b)†). According to the VB-XPS plots of CuxO, the VB maximum of CuO and Cu2O was calculated to be 2.05 eV and 1.46 eV. The contact potential difference between the sample and the XPS analyzer was used to compute the VB potential of the normal hydrogen electrode (EVB-NHE, vs. NHE, pH = 6.8) using the following calculation: EVB-NHE = ϕ + EVB-XPS − 4.44, where ϕ was the electron work function (4.55 eV) of the XPS analyzer, and EVB-XPS was the VB measured from the VB-XPS plots.14 Therefore, the EVB-NHE value of CuO and Cu2O was calculated to be 2.16 and 1.57 eV. As shown in Fig. S7(c) and (d),† Mott–Schottky plots were used to estimate the flat band potential (Efb).51 The Efb value is determined from the corresponding intercepts of the linear plot region with the potential axis of Cu2O and CuO being 1.37 and 1.95 eV vs. Ag/AgCl at pH = 6.8, equivalent to 1.57 and 2.16 eV vs. the normal hydrogen electrode (NHE) at pH = 6.8. Furthermore, the Mott–Schottky plots of Cu2O and CuO exhibited negative slopes, indicating that Cu2O and CuO is an p-type semiconductor.
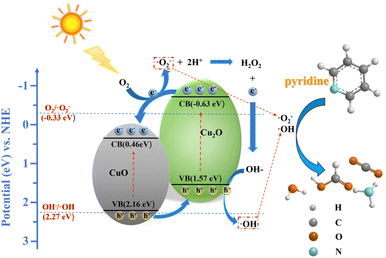
The most reliable and direct method is ESR to study the photocatalytic mechanism of CuxO-300 composite fuel denitrification. ESR analysis used DMPO as a trapping agent to determine the formation of ˙OH radicals and ˙O2− radicals in solution under visible light irradiation. As shown in Fig. 8(a), in the presence of CuxO-300, the 6-line signal can be observed under illumination. As the illumination time increases, the DMPO-˙O2− gradually increases, indicating that ˙O2− is the primary active substance in the reaction process. However, after 10 min of illumination, the signal of DMPO-˙OH was still relatively weak, which meant that ˙OH was not the primary active substance of the reaction (Fig. 8(c)). This is because the valence band (VB) maximum of Cu2O (1.57 eV vs. NHE) and CuO (2.16 eV vs. NHE) is lower than that of E(H2O/OH) (2.27 eV vs. NHE),52,53 while the conduction band (CB) minimum of Cu2O (−0.63 eV vs. NHE) is higher than that of E(O2/˙O2−) (−0.33 eV vs. NHE).33 Therefore, the generation of ˙OH radicals may be more likely due to the combination of ˙O2− and H+ to form ˙OH. The TEMPO molecule can be considered a hole probe because hole oxidation can gradually quench its free radicals. As shown in Fig. 8(b), the ESR signal of TEMPO is weakened, confirming the generation of photogenerated holes. The above measurement results show that CuxO-300 can provide abundant active species under visible light irradiation. Based on the above results, the transport of electron–hole pairs in CuxO-300 may follow the type II mechanism.
CuxO-300 is composed of CuO/Cu2O nanoparticles, forming a type II semiconductor heterojunction to accelerate the separation of carriers. Based on the above experimental results, a possible fuel denitrification mechanism was proposed (Fig. 9). Under visible light irradiation, both CuO and Cu2O can generate hole–electron pairs, and the electrons of both migrate from the VB maximum to the CB minimum. At the same time, because the conduction band potential of Cu2O is more significant (−0.63 eV vs. NHE) and the VB maximum is smaller (1.57 eV vs. NHE), the electrons of Cu2O migrate to the CB minimum of CuO through the heterojunction. The holes (h+) of CuO are beneficial to transfer to the VB maximum of Cu2O in energy. The e− can capture the dissolved O2 accumulated in the CB minimum of CuO to form the main active substance ˙O2− (e− + O2 → ˙O2−), which is involved in the photocatalytic degradation of pyridine. At the same time, since the VB maximum of Cu2O (1.57 eV vs. NHE) and CuO (2.16 eV vs. NHE) are lower than E(H2O/OH) (2.27 eV vs. NHE), ˙OH cannot be generated under visible light irradiation, and ˙O2− radicals are required to further react with H+ and holes to generate ˙OH radicals. The active substances ˙O2− and ˙OH are involved in the degradation of pyridine.54 In fuel denitrification, pyridine is combined with ˙O2− and ˙OH to form cyclic and ring-opening intermediates, eventually oxidizing into small molecules. On the one hand, the improvement of photocatalytic performance of CuxO-300 is attributed to forming a type II semiconductor heterojunction, which constructs a fast electron transport channel and promotes the separation of carriers. On the other hand, the Cu+/Cu2+ metal center formed based on the MOF framework as a Lewis acid site can better adsorb pyridine through coordination and promote photocatalytic reactions.
Conclusions
In summary, the CuxO-T composite was prepared with HKUST-1(Cu) as the pre-sacrifice, and then the activity of the prepared photocatalyst was investigated. Under visible light (≥420 nm) irradiation, the photocatalytic activity of CuxO-300 composites still maintaining the original HKUST-1(Cu) framework was significantly improved (∼81%, 4 h). Based on the experimental results, it can be concluded that the significant performance improvement was primarily due to the presence of abundant Lewis acid active sites, which Cu+/Cu2+ formed through CuxO-300 in the octahedral structure. Additionally, mixed-valence metal oxide heterojunction formation enhances its visible light absorption performance and facilitates the separation of photogenerated carriers. This study is expected to provide a reference for preparing porous metal oxides at different temperatures and a basis for rapidly adjusting the surface structure of fuel denitrification photocatalysts.Author contributions
Conceptualization: R. H. and R. L.; investigation: J. L., R. H.; L. C., Y. X. and G. Y.; writing—review and editing: J. L. All authors have read and agreed to the published version of the manuscript.Conflicts of interest
The authors declare no conflict of interest.Acknowledgements
This work was financially supported by program for National Natural Science Foundation of China (22372085), Innovative Research Team in Science and Technology in Fujian Province University, Natural Science Foundation of Fujian Province (2023H6023, 2023J011067), Research Project of Ningde Normal University (No. 2023ZX02, 2022FZ18).References
- B. N. Bhadra and S. H. Jhung, Chem. Eng. J., 2020, 398, 125590 CrossRef CAS.
- X. D. Lang, Q. W. Li, Y. C. Xu, M. M. Ji, G. Yan and S. H. Guo, Bioresour. Technol., 2019, 290, 121719 CrossRef CAS PubMed.
- L. Wang, D. X. Xie, Y. Y. Ma, M. Sun, N. Mominou, W. J. Jiang, S. F. Chen and C. Y. Jing, Fuel Process. Technol., 2021, 216, 106802 CrossRef CAS.
- S. Albersberger, J. Hein, M. W. Schreiber, S. Guerra, J. Y. Han, O. Y. Gutierrez and J. A. Lercher, Catal. Today, 2017, 297, 344–355 CrossRef CAS.
- R. D. Deese, R. E. Morris, A. E. Metz, K. M. Myers, K. Johnson and T. N. Loegel, Energy Fuels, 2019, 33, 6659–6669 CrossRef CAS.
- N. E. Paucar, P. Kiggins, B. Blad, K. De Jesus, F. Afrin, S. Pashikanti and K. Sharma, Environ. Chem. Lett., 2021, 19, 1205–1228 CrossRef CAS.
- H. Y. Yao, Y. A. Ren, X. Q. Deng and C. H. Wei, J. Hazard. Mater., 2011, 186, 1136–1140 CrossRef CAS PubMed.
- Y. M. Zhang, L. Chang, N. Yan, Y. X. Tang, R. Liu and B. E. Rittmann, Environ. Sci. Technol., 2014, 48, 649–655 CrossRef CAS PubMed.
- H. Y. Yao, G. Wang, C. C. Zuo, C. S. Li, E. Q. Wang and S. J. Zhang, Green Chem., 2017, 19, 1692–1700 RSC.
- L. P. Zheng, G. Y. Yan, Y. Y. Huang, X. X. Wang, J. L. Long, L. Li and T. Y. Xu, Int. J. Hydrogen Energy, 2014, 39, 13401–13407 CrossRef CAS.
- S. H. Wang, Z. J. He, L. Wu, D. L. Wang, R. R. Si, X. Y. Liu and R. W. Liang, Dalton Trans., 2023, 52, 3517–3525 RSC.
- T. Chen, Z. J. Zhu, F. Chen, C. Hu and H. W. Huang, Appl. Surf. Sci., 2023, 616, 156467 CrossRef CAS.
- W. N. Hu, M. M. Jiang, R. W. Liang, R. K. Huang, Y. Z. Xia, Z. Y. Liang and G. Y. Yan, Dalton Trans., 2021, 50, 2596–2605 RSC.
- D. L. Wang, E. R. Zhan, S. H. Wang, X. Y. Liu, G. Y. Yan, L. Chen and X. X. Wang, Molecules, 2023, 28, 282 CrossRef CAS.
- Y. Lu, H. B. Pan, J. F. Lai, Y. Z. Xia, L. Chen, R. W. Liang, G. Y. Yan and R. K. Huang, RSC Adv., 2022, 12, 12702–12709 RSC.
- M. A. Badillo-Avila, R. Castanedo-Perez, G. Torres-Delgado, J. Marquez-Marin and O. Zelaya-Angel, Mater. Sci. Semicond. Process., 2018, 74, 203–209 CrossRef CAS.
- X. Cheng, Y. Liu, L. Zheng, F. Tan, C. Luo, B. Xu, J. Xu, X. Zhu, D. Wu and H. Liang, J. Colloid Interface Sci., 2022, 626, 1028–1039 CrossRef CAS PubMed.
- M. Jin, X. Ban, J. Gao, J. Chen, D. K. Hensley, H. C. Ho, R. J. Percoco, C. M. Ritzi and Y. Yue, Inorg. Chem., 2019, 58, 8332–8338 CrossRef CAS PubMed.
- H. C. Huang, W. G. Zhang, H. X. Wang, A. L. Wei, J. Wang and Y. M. Liu, Int. J. Hydrogen Energy, 2023, 48, 25366–25378 CrossRef CAS.
- M. Lan, G. L. Fan, L. Yang and F. Li, RSC Adv., 2015, 5, 5725–5734 RSC.
- H. X. Duo, X. F. Lu, X. B. Nie, L. C. Wang, S. Wang, X. J. Liang and Y. Guo, J. Chromatogr. A, 2020, 1626, 461328 CrossRef CAS PubMed.
- P. Yu, Y. Han, D. Han, X. Liu, Y. Liang, Z. Li, S. Zhu and S. Wu, J. Hazard. Mater., 2020, 390, 122126 CrossRef CAS PubMed.
- Y. Chen, D. Yang, X. Xin, Z. S. Yang, Y. C. Gao, Y. H. Shi, Z. F. Zhao, K. An, W. J. Wang, J. D. Tan and Z. Y. Jiang, J. Mater. Chem. A, 2022, 10, 9717–9725 RSC.
- L. Zhang and J. Q. Zhang, Front. Energy, 2019, 13, 221–250 CrossRef.
- J. D. Xiao, L. L. Han, J. Luo, S. H. Yu and H. L. Jiang, Angew. Chem., Int. Ed., 2018, 57, 1103–1107 CrossRef CAS PubMed.
- R. W. Liang, Z. Y. Liang, F. Chen, D. H. Xie, Y. L. Wu, X. X. Wang, G. Y. Yan and L. Wu, Chin. J. Catal., 2020, 41, 188–199 CrossRef CAS.
- W. X. Zhou, Y. J. Tang, X. Y. Zhang, S. T. Zhang, H. G. Xue and H. Pang, Coord. Chem. Rev., 2023, 477, 214949 CrossRef CAS.
- P. Behera, A. Ray, S. P. Tripathy, L. Acharya, S. Subudhi and K. Parida, J. Photochem. Photobiol., A, 2023, 436, 114415 CrossRef CAS.
- A. Ray, S. Subudhi, S. P. Tripathy, L. Acharya and K. Parida, Adv. Mater. Interfaces, 2022, 9, 2201440 CrossRef CAS.
- D. X. Yan, J. Y. Xin, Q. Zhao, K. Gao, X. M. Lu, G. Y. Wang and S. J. Zhang, Catal. Sci. Technol., 2018, 8, 164–175 RSC.
- J. Panda, S. P. Tripathy, S. Dash, A. Ray, P. Behera, S. Subudhi and K. Parida, Nanoscale, 2023, 15, 7640–7675 RSC.
- P. Behera, S. Subudhi, S. P. Tripathy and K. Parida, Coord. Chem. Rev., 2022, 456, 214392 CrossRef CAS.
- S. Subudhi, G. Swain, S. P. Tripathy and K. Parida, Inorg. Chem., 2020, 59, 9824–9837 CrossRef CAS PubMed.
- M. Bagheri, A. Melillo, B. Ferrer, M. Y. Masoomi and H. Garcia, ACS Appl. Mater. Interfaces, 2022, 14, 978–989 CrossRef CAS PubMed.
- Y. F. Zhu, Y. F. Liu, Q. Ai, G. H. Gao, L. Yuan, Q. Y. Fang, X. Y. Tian, X. Zhang, E. Egap, P. M. Ajayan and J. Lou, ACS Mater. Lett., 2022, 4, 464–471 CrossRef CAS.
- Q. Zheng, J. Wang, X. Li, Y. Bai, Y. P. Li, J. C. Wang, Y. Y. Shi, X. Y. Jiang and Z. Q. Li, ACS Mater. Lett., 2022, 4, 1638–1645 CrossRef CAS.
- X. Zhao, Y. Tan, F. Wu, H. Niu, Z. Tang, Y. Cai and J. P. Giesy, Sci. Total Environ., 2016, 571, 380–387 CrossRef CAS PubMed.
- H. T. Li, L. J. Ban, Z. Z. Niu, X. Huang, P. F. Meng, X. D. Han, Y. Zhang, H. X. Zhang and Y. X. Zhao, Nanomaterials, 2019, 9, 1301 CrossRef CAS PubMed.
- B. Di Credico, M. Redaelli, M. Bellardita, M. Calamante, C. Cepek, E. Cobani, M. D'Arienzo, C. Evangelisti, M. Marelli, M. Moret, L. Palmisano and R. Scotti, Catalysts, 2018, 8, 353 CrossRef.
- S. Mosleh, M. R. Rahimi, M. Ghaedi, K. Dashtian and S. Hajati, RSC Adv., 2016, 6, 17204–17214 RSC.
- Y. Wu, Y. Q. Li, H. Li, H. Guo, Q. Yang and X. M. Li, Sep. Purif. Technol., 2022, 303, 122106 CrossRef CAS.
- Z. D. Wang, Y. Zang, Z. J. Liu, P. Peng, R. Wang and S. Q. Zang, Appl. Catal., B, 2021, 288, 119941 CrossRef CAS.
- C. Prestipino, L. Regli, J. G. Vitillo, F. Bonino, A. Damin, C. Lamberti, A. Zecchina, P. L. Solari, K. O. Kongshaug and S. Bordiga, Chem. Mater., 2006, 18, 1337–1346 CrossRef CAS.
- Y. Xiong, L. Che, Z. Fu and P. Ma, Adv. Powder Technol., 2018, 29, 1331–1338 CrossRef CAS.
- Y. Y. Song, B. Dong, S. W. Wang, Z. R. Wang, M. J. Zhang, P. Tian, G. C. Wang and Z. Zhao, ACS Omega, 2020, 5, 6260–6269 CrossRef CAS PubMed.
- C. K. Tsai, C. H. Huang, J. J. Horng, H. L. Ong and R. A. Doong, Nanomaterials, 2023, 13, 282 CrossRef CAS PubMed.
- Q. Meng, W. Liu, J. Jiang and X. Zhang, Ceram. Int., 2021, 47, 19402–19413 CrossRef CAS.
- Y. Zhu, D. Y. Li, S. Y. Zuo, Z. Y. Guan, S. Ding, D. S. Xia and X. H. Li, J. Environ. Chem. Eng., 2021, 9, 106781 CrossRef CAS.
- N. H. Khdary, W. S. Alkhuraiji, T. S. Sakthivel, D. N. Khdary, M. A. Salam, S. Alshihri, S. I. Al-Mayman and S. Seal, Catalysts, 2020, 10, 872 CrossRef CAS.
- S. P. Tripathy, S. Subudhi, A. Ray, P. Behera, A. Bhaumik and K. Parida, Langmuir, 2022, 38, 1766–1780 CrossRef CAS PubMed.
- S. Subudhi, S. P. Tripathy and K. Parida, Inorg. Chem. Front., 2021, 8, 1619–1636 RSC.
- D. Tahir and S. Tougaard, J. Phys.: Condens. Matter, 2012, 24, 175002 CrossRef PubMed.
- S. Mosleh, M. R. Rahimi, M. Ghaedi, K. Dashtian and S. Hajati, Ultrason. Sonochem., 2018, 40, 601–610 CrossRef CAS PubMed.
- R. Liang, S. Wang, Y. Lu, G. Yan, Z. He, Y. Xia, Z. Liang and L. Wu, Molecules, 2021, 26, 7566 CrossRef CAS PubMed.
Footnote |
| † Electronic supplementary information (ESI) available. See DOI: https://doi.org/10.1039/d3ra07532j |
| This journal is © The Royal Society of Chemistry 2023 |

