 Open Access Article
Effect of calcium ion concentration on the ORR performance of Pd/C catalysts†
Lin jun Tonga,
Xiaojuan Lina,
Jian wen Caia,
Wen Fub and
Xiaoting Deng *c
*c
aFoShan Poly Technic, Foshan, 528000, China
bGuangdong Hydrogen Engine New Material Co., Ltd, Foshan, 528000, China
cCollege of Food and Chemical Engineering, Shaoyang University, Shaoyang 422000, China. E-mail: Xiaotingdeng@126.com
First published on 14th December 2023
Abstract
Noble metal electrocatalysts prepared by microbial methods have attracted extensive attention because of their environmental protection and easy preparation. However, the preparation of electrocatalysts by microbial methods has problems such as large nanoparticles size and low loading rate. In this study, the porous gel co-embedded with Shewanella and alginate is prepared as the adsorption matrix to further enhance its mass transfer and adsorption efficiency. The effect of calcium ion concentration on catalyst performance is explored by optimizing the CaCl2 concentration to expose more adsorption sites. The results show that when the Ca2+ concentration is 0.025 mmol L−1, the prepared catalyst has the smallest size and the highest Pd loading, and exhibits the best electrochemical activity and stability. This provides a new idea for the preparation of electrocatalysts by microbial methods.
1. Introduction
Proton exchange membrane fuel cells are widely studied due to their advantages of fast start-up and zero emissions. The development of commercial Pt-based catalysts is severely restricted due to the low reserves of Pt.1 As a main group element of Pt, Pd has similar chemical properties to Pt.2 Therefore, Pd-based catalysts have also been widely studied. At present, the main methods for the synthesis of electrocatalysts include physical, chemical and biological methods. Among the many synthesis methods, microbial synthesis has received widespread attention.3The microbial synthesis method is a method of in situ, clean and mild synthesis of nano-metals by utilizing the good adsorption and reducing power of microorganisms on metals. The research on microbial synthesis of nanomaterials can be traced back to the use of Candida glabrata to synthesize intracellular CdSe nanomaterials in 1989,4 and the biosynthesis of Fusarium oxysporum was used in 2001 Ag nanoparticles, the first successful proof-of-concept biosynthetic technology.5 During the microbial synthesis of nanomaterials, there are a wide range of factors affecting the performance of nanomaterials, mainly including microbial characteristics (such as the type of microorganism, age of microbial inoculation and type of growth medium) and process conditions (such as pH value and temperature), and process kinetics of interactions between metal ion precursors and reducing agents, adsorption kinetics of stabilizers and nanoparticles.6
Shewanella is a Gram-negative and anaerobic bacterium.7 It is a typical dissimilatory metal-reducing bacteria. It is widely distributed in various natural and artificial environments. More than 50 species have been isolated and identified. Shewanella possesses a complex multi-set branched-chain electron transport system that facilitates the reduction of different terminal electron acceptors, which includes inner membrane-localized dehydrogenases, methaqualone, and various cytochromes. At present, in terms of reducing metals, it has been confirmed that Shewanella can reduce Fe(III), Mn(IV), Cr(VI), Np(V), Tc(VII), Pu(IV), V(V), Se(IV), Te(IV), Au(III), Ag(I), Pd(II) and Cu(II), etc.7–9
However, traditional microbial reduction easily leads to the agglomeration of nanoparticles and low metal utilization.11 Microbe embedding filling refers to blending microorganisms with sodium alginate, and then cross-linking to prepare a gel, so as to improve the performance of the composite gel and effectively reduce the size of nanoparticles. A number of studies have shown that the material modified by embedding and filling can have both the advantages of gel and filling material.12 On the one hand, it avoids the problems of easy loss and difficult recycling of fine filling materials. On the other hand, the blended filling enhances its adsorption performance and environmental adaptability.
In this study, Shewanella oneidensis MR-1, calcium alginate and calcium carbonate were used as the composite adsorption matrix, and by reducing the concentration of calcium alginate in the adsorption matrix, fully exposing its carboxyl, hydroxyl and other oxygen-containing functional groups, so as to further improve the palladium loading of calcium alginate–calcium carbonate porous composite carbon matrix catalysts.
2. Experimental part
2.1 Chemicals
The bacterial seeds of Shewanella oneidensis MR-1 (99%) were purchased from American Type Culture Collection. Sodium tetrachloropalladate (Na2PdCl4), calcium chloride (CaCl2), sodium alginate, disodium hydrogen phosphate (Na2HPO4), calcium carbonate (CaCO3), and Nafion (5 wt%) were purchased from Sinopharm Chemical Reagent Co., Ltd. All the reagents and solvents were used without further purification. Commercial 10% Pd/C was obtained from Johnson Matthey Company. DI water (18.2 MΩ × cm) was produced in our laboratory.2.2 Synthesis of catalysts
The concentration of CaCl2 is 0.05 mmol L−1, 0.025 mmol L−1 and 0.0125 mmol L−1, respectively. And the composite gel adsorption matrix were labeled as GAM0.05, GAM0.025 and GAM0.0125 correspondingly.
The three samples completed by adsorption were freeze-dried in a vacuum overnight. After drying, the sample is placed in a tube furnace and annealed at 800 °C for 3 h in argon atmosphere at a heating rate of 3 °C min−1. Then a reduction process was conducted at 200 °C in H2 atmosphere for 2 h, the palladium carbon catalyst product was obtained. The samples obtained were named as Pd/C0.05, Pd/C0.025 and Pd/C0.0125, respectively. The inductively coupled plasma (ICP) results show that the Pt content in Pd/C0.05, Pd/C0.025 and Pd/C0.0125 is 9.56%, 10.38%, and 7.64%. In addition, the N contents in Pd/C0.05, Pd/C0.025 and Pd/C0.0125 are 5.0%, 5.2% and 4.9% respectively.
2.3 Physicochemical and electrochemical characterization
The physicochemical and electrochemical characterization details are presented in the ESI.†3. Results and discussion
3.1 Structural characterization
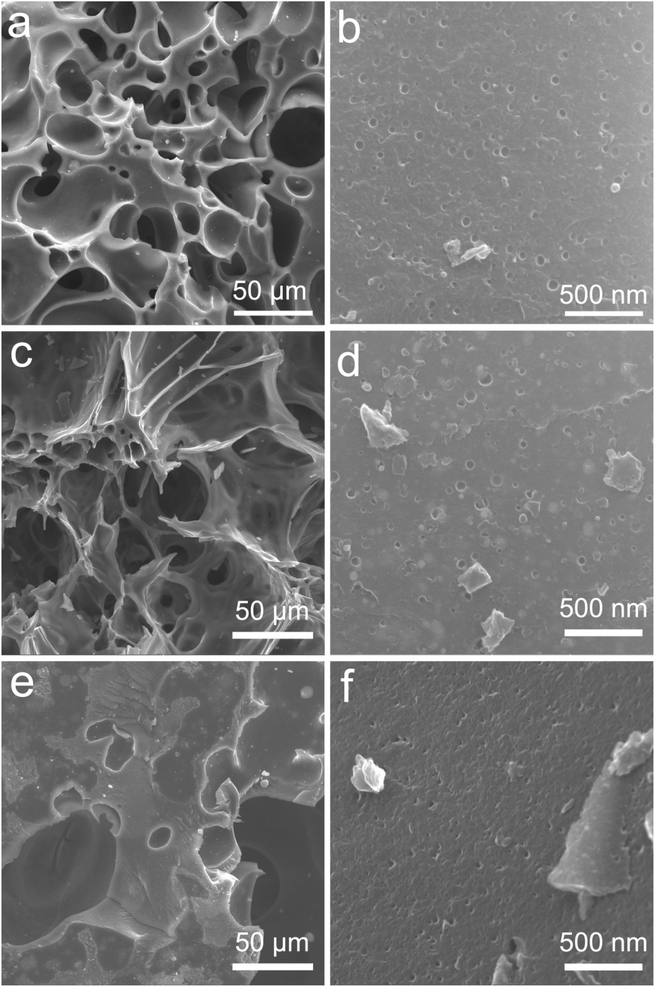
Fig. 1 shows the SEM images of Pd/C0.05, Pd/C0.025 and Pd/C0.0125. All the prepared catalysts have a porous structure, and there are many pits with uniform size distribution on the surface of the material, which is beneficial to the loading of Pd nanoparticles. By comparing the morphology images of Pd/C0.05 and Pd/C0.025, it was found that with the Ca2+ concentration decreases, the gel cross-linking degree decreases, and the pores of the carbon carrier in Pd/C0.025 become larger. However, when the concentration of Ca2+ is further reduced, the pore-forming effect of CaCO3 is not obvious because the gel cross-linking is too low and weak. In addition, in order to further determine the specific surface area of the catalyst, the BET test was conducted on the catalyst. As shown in Fig. S1,† the specific surface areas of Pd/C0.05, Pd/C0.025 and Pd/C0.0125 were 40.95 m2 g−1, 44.56 m2 g−1 and 13.05 m2 g−1.The morphology and particle size of as-prepared catalyst are shown in Fig. 2. The size distribution of Pd nanoparticles was obtained by randomly measuring the sizes of 150 nanoparticles from the SEM images. It is particularly noticeable that the average particle size of Pd/C0.05 and Pd/C0.025 was significantly smaller than that of Pd/C0.0125, and the average particle size was 8.34 nm, 7.84 nm and 16.21 nm, respectively. The conditions of the as-prepared catalysts are the same except for the concentration of CaCl2, so it can be concluded that the degree of crosslinking of CaCl2 has a great influence on the distribution of metals. When the Ca2+ concentration is 0.0125 mM, the PdNPs formed are the largest, because the formed gel has weak coagulation and fixation ability, and calcium alginate cannot fix microorganisms in a limited space, so the cells will contact and agglomeration of palladium ions occurs during the reduction. However, when the Ca2+ concentration is 0.025 mM and 0.05 mM, the particle size distribution of PdNPs is relatively small, both of which are about 8 nm, indicating that the higher Ca2+ concentration range will not affect the size of palladium particles. Therefore, the size of nano-palladium will not be affected within a certain range of cross-linking degree, but too low cross-linking will affect the immobilization effect of the gel on microorganisms. The metal particles of the prepared palladium carbon catalyst become larger. The spacing of the lattice fringe shown in Fig. 2(b), (e) and (h) was 0.224 nm, corresponding to the (111) plane of Pd face centered cubic.13
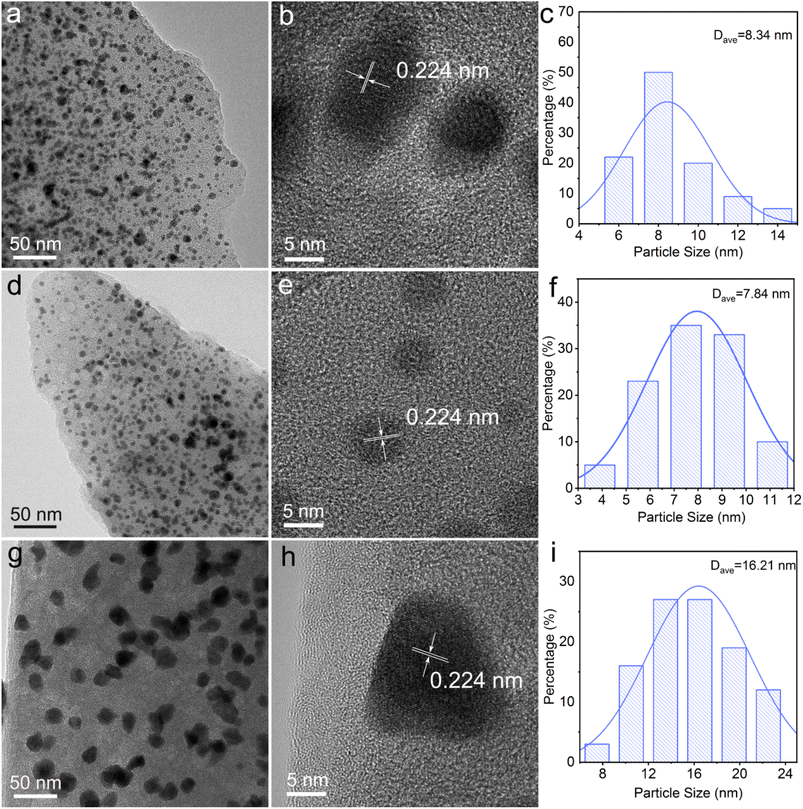 | ||
| Fig. 2 TEM images and Pd size distribution of the (a–c) Pd/C0.05, (d–f) Pd/C0.025 and (g–i) Pd/C0.0125. | ||
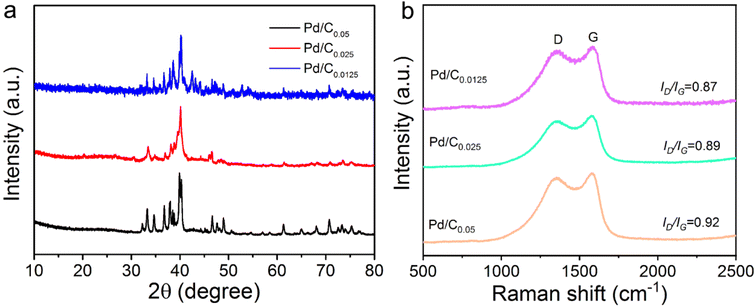
Fig. 3a illustrates the XRD patterns of Pd/C0.05, Pd/C0.025 and Pd/C0.0125. The XRD curve has a obvious diffraction peak at 40.2° and 46.62°, corresponding to the (111) and (220) crystal face of Pd, respectively.8 In this study, the amount of Ca2+ was changed, but there was no significant difference in the crystal structure, which indicated that Ca2+ had little effect on the Pd crystal.
The Raman results of Pd/C catalysts prepared with different concentrations of Ca2+ are shown in Fig. 3b. The ID/IG ratios of Pd/C0.05, Pd/C0.025 and Pd/C0.0125 are 0.92, 0.89 and 0.87 respectively. This result shows that with the decrease of Ca2+ concentration, the ID/IG ratio shows a downward trend. It can be further concluded that the degree of graphitization increases with the decrease of Ca2+ concentration.
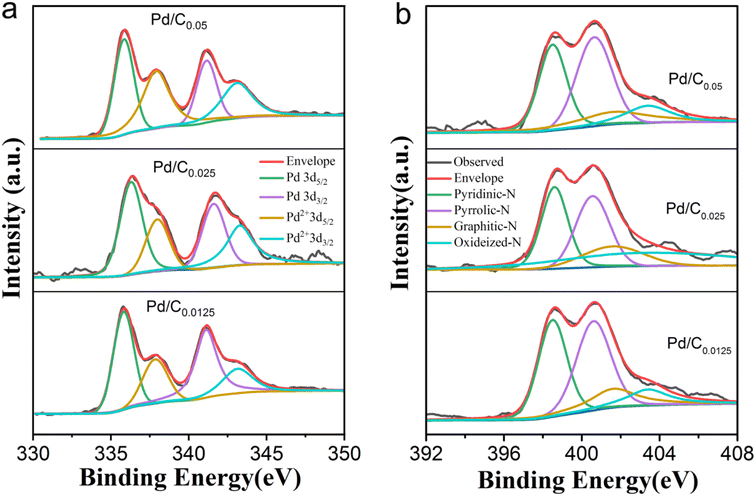
To investigate the electronic structure of Pd in as-prepared catalyst were characterized by XPS measurements. Each Pd 3d XPS spectrum of Pd/C0.05, Pd/C0.025 and Pd/C0.0125 were decomposed into Pd0 peak and Pd2+ peak according to the binding energy. As shown in Fig. 4a and Table 1, the content of Pd(0) decreases with the decrease of Ca2+ concentration, indicating that the degree of cross-linking of Ca2+ has an effect on the palladium reduction process. This may be due to the porous structure of the carbon matrix. The porous structure has a more efficient mass transfer channel and an increased contact area of H2, so the reduction rate of the phase is slightly improved. Generally, different kinds of nitrogen play different functions. For example, graphitic nitrogen has weak electron donating ability and contributes less to the ORR, but it can improve the conductivity of the carbon matrix. The lone pair of electrons in pyridine nitrogen endows it with electron-donating ability, which can effectively provide Lewis base sites, and the ORR performance of carbon catalysts with high pyridine nitrogen doping is better. In addition, pyrrole nitrogen is extremely unstable and prone to various transformations. In our previous research, we found that different carbon substrates will affect the nitrogen species of the catalyst, and alginate is more likely to generate pyridinic nitrogen. As shown in Fig. 4b and Table 1, since all samples in the three groups of samples use calcium alginate composite carbon matrix, the proportion of pyridine nitrogen in the obtained samples is large (about 38%), which promotes the better performance of the catalyst. In addition, the graphitic N content increases with decreasing Ca2+ concentration, which corresponds to the increase in graphitization degree with decreasing Ca2+ concentration.
| Sample | Pd(0) | Pd(II) | Pyridinic-N | Pyrrolic-N | Graphitic N | Oxidized-N |
|---|---|---|---|---|---|---|
| Pd/C0.05 | 60.32% | 39.68% | 39.88% | 38.72% | 17.75% | 3.65% |
| Pd/C0.025 | 58.45% | 41.55% | 38.72% | 36.45% | 20.08% | 4.75% |
| Pd/C0.0125 | 47.85% | 52.15% | 37.43% | 36.41% | 21.76% | 4.40% |
3.2 Electrocatalytic activity for ORR
The LSV curve and electron transfer number are shown in Fig. 5, and the calculation results of the electrochemical activity index are shown in Table 2. Limiting current density and half-wave potential are important indicators for judging catalyst activity, and it is generally believed that the larger of the value, the better the electrochemical catalytic effect.14 With the concentration of Ca2+ from 0.05 mM to 0.025 mM, the values of these two index parameters are all increasing, indicating that reducing the Ca2+ concentration is beneficial to the catalytic reaction. When the concentration was too low (0.0125 mM), the half-wave potential of Pd/C0.0125 (0.905 V) were significantly lower than those of Pd/C0.05 (0.929 V), Pd/C0.025 (0.952 V).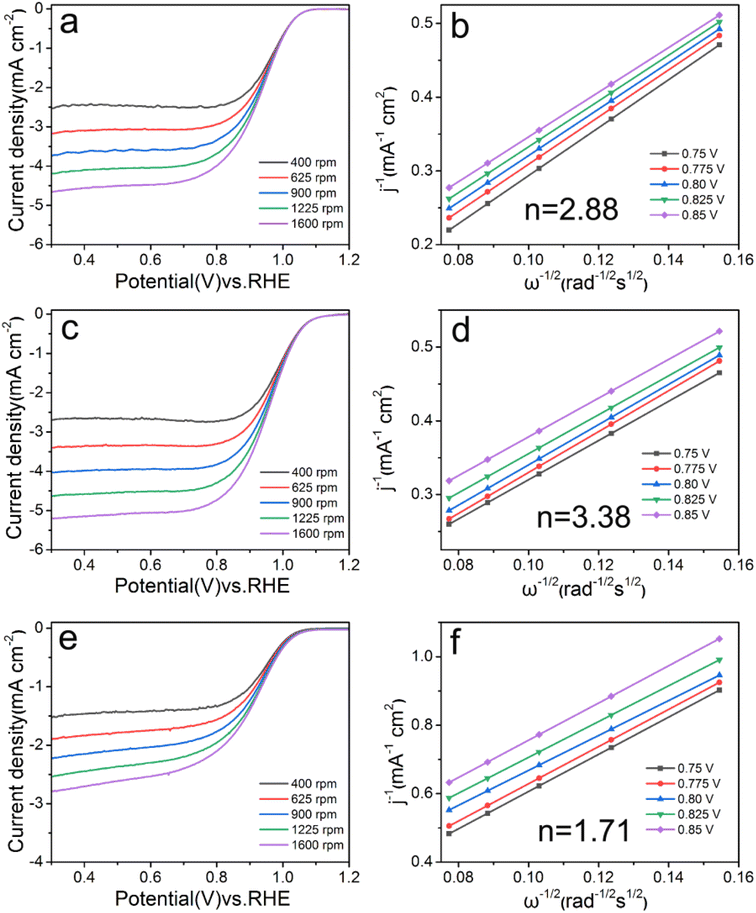 | ||
| Fig. 5 LSV and Koutecky–Levich plots of (a and b) Pd/C0.05, (c and d) Pd/C0.025 and (e and f) Pd/C0.0125 at 0.75–0.85 V, respectively. | ||
| Sample | E1/2 (V) | ECSA (m2 g−1) | MA (A mg−1) | SA (A m−2) | Pd (wt%) |
|---|---|---|---|---|---|
| Pd/C0.05 | 0.929 | 26.35 | 0.22 | 0.84 | 9.56 |
| Pd/C0.025 | 0.952 | 47.05 | 0.37 | 0.79 | 10.38 |
| Pd/C0.0125 | 0.905 | 34.29 | 0.10 | 0.29 | 7.64 |
| Commercial Pd/C | 0.786 | 26.97 | 0.08 | 0.31 | 9.89 |
As shown in Fig. 5 and S2,† Pd/C0.05, Pd/C0.025, Pd/C0.0125 and Pd/C were calculated by the Koutecky–Levich equation at 0.75 V, 0.775 V, 0.80 V, 0.825 V and 0.85 V, the corresponding average electron transfer numbers are 2.88, 3.38, 1.71 and 2.26, respectively. With the decrease of calcium ion concentration, the number of electron transfer first increased and then decreased. The Pd/C0.025 catalyst follows the four-electron reaction pathways and the two-electron reaction pathways occurring simultaneously, while the Pd/C0.0125 follows the two-electron reaction pathway. This indicates that the Ca2+ concentration of 0.025 mM is the most suitable for the catalytic reaction.
The CV test results of different catalyst samples are shown in Fig. 6. It can be seen that the catalysts with the Ca2+ concentration of 0.05 mM and 0.025 mM have obvious oxygen reduction peaks, but the oxygen reduction peak is not obvious when the Ca2+ concentration is reduced to 0.0125 mM. It can be seen from the figure that the oxygen reduction peak sites of Pd/C0.05, Pd/C0.025, Pd/C0.0125 and Pd/C appeared respectively at 0.914 V, 0.977 V, 0.698 V and 0.843 V. The more positive the peak potential, the easier it is for O2 to be reduced and the better the catalyst effect. Combined with the previous data, it can be seen that the oxygen reduction peak site is gradually shifting positively after reducing the Ca2+ concentration, implying that the catalyst can exert better electrochemical performance. However, it is worth noting that the oxygen reduction peak of Pd/C0.0125 becomes indistinct and the current density is extremely small. It shows that reducing the concentration of calcium in an appropriate concentration range can improve the performance of the catalyst, but too low concentration will make the catalytic effect worse.
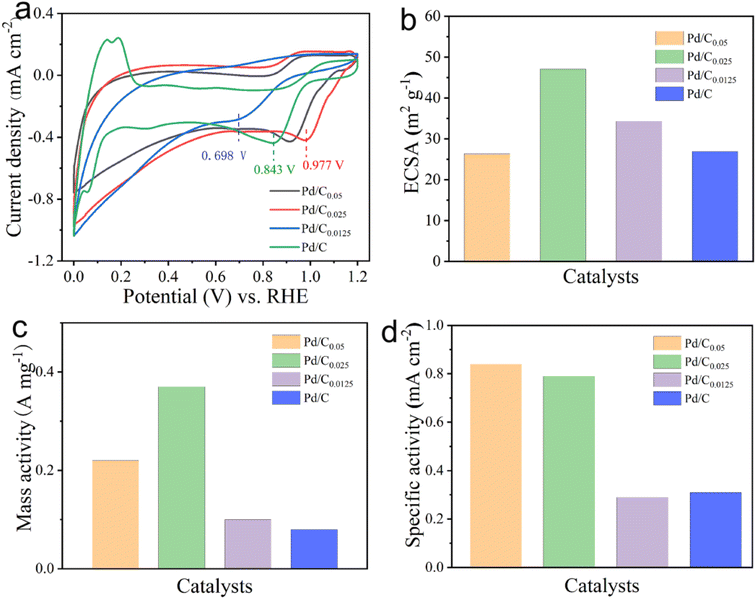 | ||
| Fig. 6 (a) CV, (b) ECSA (c) MA and (d) SA of Pd/C0.05, Pd/C0.025 and Pd/C0.0125 in 0.1 M KOH solution with potential scanning rate of 10 mV s−1 respectively. | ||
The electrochemical surface area (ECSA) is an important indicator for evaluating the active sites of catalysts. As shown in Fig. 6b, The calculated ECSAs are 26.35, 47.05, 34.29 and 26.97 m2 g−1 for Pd/C0.05, Pd/C0.025, Pd/C0.0125 and Pd/C, respectively. Obviously, calcium ion concentration has certain influence on ECSA. This result suggests that more active sites exist in Pd/C0.025, which can be attributed primarily to the size of Pd NPs and Pd load.
In addition, MA and SA are important indicators for evaluating catalyst performance. The kinetic current density (jk), mass activity (MA) and specific activities (SA) can be calculated by the following equation:
| 1/j = 1/jk + 1/jd |
| MA = jk/Pdload |
| SA = MA/ECSA15 |
As shown in Fig. 6(c) and (d), the MA of Pd/C0.025 is 0.37 A mg−1, which was 3.7 times higher than that of Pd/C0.0125 (0.10 A mg−1). The SA of Pd/C0.05, Pd/C0.025 and Pd/C0.0125 is 0.84 mA cm−2, 0.79 mA cm−2 and 0.29 mA cm−2, respectively. Above all, Pd/C0.0125 has the best oxygen reduction performance. This is due to the small and uniform particle distribution of Pd/C0.0125.
Accelerated stability testing was used to evaluate the stability performance of the catalyst. Comparing the LSV curves before and after ADT (Fig. 7), it is found that E1/2 negatively shifted by 25 mV and 35 mV for Pd/C0.05 and Pd/C0.0125, respectively, whereas that of Pd/C0.025 only decreased 18 mV. These results confirmed that Pd/C0.025 have excellent stability for ORR in alkaline media.
 | ||
| Fig. 7 LSV curves of (a) Pd/C0.05, (b) Pd/C0.025 and (c) Pd/C0.0125 before and after 5000 potential cycles. | ||
4. Conclusion
In this study, calcium alginate and Shewanella oneidensis MR-1 were used as the composite matrix, and CaCO3 was used as the pore-forming agent to prepare a porous composite Pd/C catalyst. The influence of different concentration of calcium alginate on the performance of the catalyst was explored. The research results show that the average particle size of Pd catalysts with CaCl2 concentration of 0.05 mM, 0.025 mM and 0.0125 mM are 8.34 nm, 7.84 nm and 16.21 nm respectively. This is due to the weak fixation ability of the gel formed by low cross-linking (0.0125 mM), and alginate cannot fix microorganisms in a limited space, so the cells will contact and agglomerate palladium during the reduction process. Electrochemical results show that in the appropriate concentration range, the performance of the catalyst further increases with the decrease of Ca2+ concentration, and the optimum concentration is 0.025 mM. However, when the cross-linking is too low (Pd/C0.0125), the catalytic effect is even worse. This may be due to the larger palladium particles formed under this condition, and the better performance of Pd/C0.025 is due to the increase in palladium loading (10.38%).Conflicts of interest
There are no conflicts to declare.Acknowledgements
This paper was supported by funding from Guangdong Province Vocational College Hydrogen Energy Vehicle Industry Education Integration Innovation Platform (2021CJPT024) and Foshan Science and Technology Innovation Project (1920001004360).References
- Y. Mo, S. Feng, T. Yu, J. Chen, G. Qian, L. Luo and S. Yin, Surface unsaturated WOx activating PtNi alloy nanowires for oxygen reduction reaction, J. Colloid Interface Sci., 2022, 607, 1928–1935 CrossRef CAS PubMed.
- S. Feng, J. Lu, L. Luo, G. Qian, J. Chen, H. S. Abbo, S. J. J. Titinchi and S. Yin, Enhancement of oxygen reduction activity and stability via introducing acid-resistant refractory Mo and regulating the near-surface Pt content, J. Energy Chem., 2020, 51, 246–252 CrossRef.
- S. Zhang, S. Liu, J. Huang, H. Zhou, X. Liu, P. Tan, H. Chen, Y. Liang and J. Pan, Microbial synthesis of N, P co-doped carbon supported PtCu catalysts for oxygen reduction reaction, J. Energy Chem., 2023, 84, 486–495 CrossRef CAS.
- C. T. Dameron, R. N. Reese, R. K. Mehra, A. R. Kortan, P. J. Carroll, M. L. Steigerwald, L. E. Brus, D. R. Winge and C. T. Dameron, et al., Biosynthesis of cadmium sulphide quantum semiconductor crystallites, Nature, 1989, 338, 596–597 CrossRef CAS.
- P. Mukherjee, A. Ahmad, D. Mandal, S. Senapati, S. R. Sainkar, M. I. Khan, R. Parishcha, P. V. Ajaykumar, M. Alam, R. Kumar and M. Sastry, Fungus-Mediated Synthesis of Silver Nanoparticles and Their Immobilization in the Mycelial Matrix: A Novel Biological Approach to Nanoparticle Synthesis, Nano Lett., 2001, 1, 515–519 CrossRef CAS.
- S. A. Dahoumane, M. Mechouet, K. Wijesekera, C. D. M. Filipe, C. Sicard, D. A. Bazylinski and C. Jeffryes, Algae-mediated biosynthesis of inorganic nanomaterials as a promising route in nanobiotechnology – a review, Green Chem., 2017, 19, 552–587 RSC.
- J. Yang, P. Ju, X. Dong, J. Duan, H. Xiao, X. Tang, X. Zhai and B. Hou, Green synthesis of functional metallic nanoparticles by dissimilatory metal-reducing bacteria “Shewanella”: a comprehensive review, J. Mater. Sci. Technol., 2023, 158, 63–76 CrossRef.
- S. Zhang, H. Zhou, H. Liao, P. Tan, W. Tian and J. Pan, Microbial synthesis of efficient palladium electrocatalyst with high loadings for oxygen reduction reaction in acidic medium, J. Colloid Interface Sci., 2022, 611, 161–171 CrossRef CAS PubMed.
- Q. Lv, B. Zhang, X. Xing, Y. Zhao, R. Cai, W. Wang and Q. Gu, Biosynthesis of copper nanoparticles using Shewanella loihica PV-4 with antibacterial activity: novel approach and mechanisms investigation, J. Hazard. Mater., 2018, 347, 141–149 CrossRef CAS PubMed.
- Q. Li, S. Zhang, W. Xuan, H. Zhou, W. Tian, X. Deng, J. Huang, Z. Xie, F. Liu, X. Liu and Y. Liang, Microbial synthesis of highly dispersed nano-Pd electrocatalyst for oxygen reduction reaction, Int. J. Hydrogen Energy, 2021, 46, 26886–26896 CrossRef CAS.
- L. Zhang, X. Huang, G. Fu and Z. Zhang, Aerobic electrotrophic denitrification coupled with biologically induced phosphate precipitation for nitrogen and phosphorus removal from high-salinity wastewater: Performance, mechanism, and microbial community, Bioresour. Technol., 2023, 372, 128696 CrossRef CAS PubMed.
- H. Li, S. Dai, Y. Wu, Q. Dong, H. Zhu, A. Hu, J.-P. Chou and T.-Y. Chen, Ir-trimer anchored on the Co-supported Pd nanocrystals opens the ultra-efficient channel on oxygen reduction reaction, Appl. Surf. Sci., 2023, 622, 156857 CrossRef CAS.
- X. Wu, C. Ni, J. Man, X. Shen, S. Cui and X. Chen, A strategy to promote the ORR electrocatalytic activity by the novel engineering bunched three-dimensional Pd-Cu alloy aerogel, Chem. Eng. J., 2023, 454, 140293 CrossRef CAS.
- X. Wang, L. Guo, Z. Xie, X. Peng, X. Yu, X. Yang, Z. Lu, X. Zhang and L. Li, Coordination environment engineering of graphene-supported single/dual-Pd-site catalysts improves the electrocatalytic ORR activity, Appl. Surf. Sci., 2022, 606, 154749 CrossRef CAS.
Footnote |
| † Electronic supplementary information (ESI) available. See DOI: https://doi.org/10.1039/d3ra07553b |
| This journal is © The Royal Society of Chemistry 2023 |

