 Open Access Article
Creative Commons Attribution 3.0 Unported Licence
Correction: Highly active spherical amorphous MoS2: facile synthesis and application in photocatalytic degradation of rose bengal dye and hydrogenation of nitroarenes
Namrata Sahaa,
Arpita Sarkara,
Abhisek Brata Ghosha,
Amit Kumar Duttaa,
Gopala Ram Bhadub,
Parimal Paul*b and
Bibhutosh Adhikary*a
aDepartment of Chemistry, Indian Institute of Engineering Science and Technology, Shibpur, Howrah 711 103, India. E-mail: bibhutoshadhikary@yahoo.in; Fax: +91-33-2668-2916; Tel: +91-33-2668-4561-64 ext. 512
bDepartment of Analytical Science, Central Salt and Marine Chemicals Research Institute, Gijubhai, Badheka Marg, Bhavnagar 364002, Gujarat, India
First published on 31st May 2023
Abstract
Correction for ‘Highly active spherical amorphous MoS2: facile synthesis and application in photocatalytic degradation of rose bengal dye and hydrogenation of nitroarenes’ by Namrata Saha et al., RSC Adv., 2015, 5, 88848–88856, https://doi.org/10.1039/C5RA19442C.
In the original manuscript, the authors regret an error in the calculation of the band gap values. The band gap values were not read at y = 0, which is a requirement when using the Tauc method.
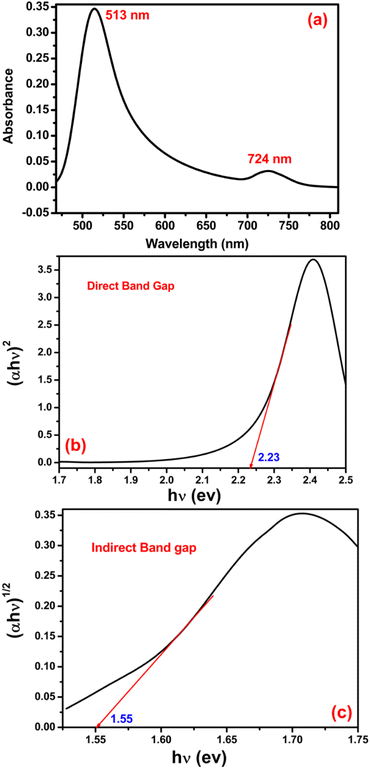
As such, the authors have provided a new dataset and an updated Fig. 3. Section 3.2 in the original manuscript has been updated accordingly and is included below, and an updated Fig. 3 has been provided.
3.2. Optical properties
The typical optical property of amorphous MoS2 was investigated by the UV-vis spectroscopic technique and is shown in Fig. 3(a). The room temperature absorption spectrum was recorded by dispersing the sample in toluene. In solution, the first prominent absorption peak is at 513 nm wavelength, which is attributed to transitions involving the direct band gap, and the second absorption shoulder was seen at 724 nm, which corresponds to the indirect band gap of the MoS2 amorphous sphere. The presence of both direct and indirect bandgaps simultaneously in the same material was also reported1 earlier. Generally, the Tauc plot is used to determine the bandgap of semiconductor materials using the Tauc relation [(αhν)1/n = A(hν − Eg)], where, hν is the incident photon energy, ‘A’ is a constant and ‘n’ is the exponent, the value of which is determined by the type of electronic transition causing the absorption and can take the value ½ or 2 depending upon whether the transition is direct or indirect. The direct bandgap of MoS2 amorphous sphere is 2.23 eV (Fig. 3(b)), suggesting that MoS2 amorphous sphere is a direct bandgap material. Moreover, Fig. 3(c) shows that MoS2 amorphous sphere also contains a significant amount of indirect bandgap (1.55 eV) structure, as the TM plot for the indirect bandgap also presents linear sections in that photon energy range.
The presence of both direct and indirect bandgaps simultaneously in the same particles with a smaller indirect bandgap than direct bandgap causes the better use as an efficient catalyst for catalytic reactions under solar light irradiation, provided enough phonons (lattice vibrations) are available to assist the indirect electron transition from the valence band (VB) to the conduction band (CB).
The N2 adsorption–desorption isotherms analysis (Fig. S2†) provides further detailed information about the specific surface area of the catalyst. The specific surface area of this sample was calculated to be 32.63 m2 g−1 by the BET equation. The large surface area of MoS2 amorphous sphere is expected to accelerate the photocatalytic reaction by providing more active sites and promoting the separation efficiency of photocarriers.
The scientific conclusions remain unaffected by these changes.
The Royal Society of Chemistry apologises for these errors and any consequent inconvenience to authors and readers.
References
- S. Deka, A. Genovese, Y. Zhang, K. Miszta, G. Bertoni, R. Krahne, C. Giannini and L. Manna, J. Am. Chem. Soc., 2010, 132, 8912–8914 Search PubMed.
| This journal is © The Royal Society of Chemistry 2023 |

