Cellulose hydrogenolysis to alcohol and ketone products using Co@C catalysts in the phosphoric acid aqueous solution†
Haosheng
Xin
abcd,
Haiyong
Wang
 abc,
Xiaohong
Hu
abc,
Xiuzheng
Zhuang
abc,
Long
Yan
*abc,
Chenguang
Wang
abc,
Xiaohong
Hu
abc,
Xiuzheng
Zhuang
abc,
Long
Yan
*abc,
Chenguang
Wang
 abc,
Longlong
Ma
e and
Qiying
Liu
 *abc
*abc
aGuangzhou Institute of Energy Conversion, Chinese Academy of Sciences, Guangzhou 510640, P. R. China. E-mail: liuqy@ms.giec.ac.cn; Fax: +86 20 8705 7673; Tel: +86 20 3702 9839
bCAS Key Laboratory of Renewable Energy, Guangzhou 510640, P. R. China
cGuangdong Provincial Key Laboratory of New and Renewable Energy Research and Development, Guangzhou 510640, P. R. China
dUniversity of Chinese Academy of Sciences, Beijing 100049, P. R. China
eKey Laboratory of Energy Thermal Conversion and Control of Ministry of Education, School of Energy and Environment, Southeast University, Nanjing 210096, China
First published on 21st September 2022
Abstract
Cellulose hydrolysis and further conversion to diketones and alcohols was performed with graphene layer encapsulated cobalt catalysts (Co@C) in phosphoric acid aqueous solution. A total of 60.5% yield of the products mainly including ethanol, 2,5-hexanedione (2,5-HD) and diols could be achieved in 0.06 M H3PO4 solution. A series of characterization methods such as XRD, XPS, TEM, TG-MS, BET, ICP, H2-TPD, NH3-TPD, and Raman were carried out to explore the catalyst formation mechanism and reaction activity. The results of the analysis indicated that the calcination temperature had a deep influence on the structure formation of the Co@C catalysts, thus leading to differences in the reaction activity. While the calcination temperature was determined at 700 °C, the Co@C catalyst meets with the requirements of optimal reaction activity, appropriate particle size, suitable surface area, and pore size. Besides, it was found that H3PO4 is not only favorable in cellulose hydrolysis but also cooperates with the Co@C catalyst in the hydrogenolysis of C–O bond and C–C bonds for the formation of products. This work provides a possible way for renewable cellulose conversion to diketone and alcohols over encapsulated non-noble metal catalyst combined with phosphoric acid aqueous solution.
Introduction
Searching for alternative fuels and value-added chemical products derived from renewable lignocellulosic biomass has motivated the great interest of researchers.1–4 Cellulose, the most abundant lignocellulosic polysaccharide made of D-glucose units, is considered as an ideal feedstock for the sustainable production of oxygen-containing fuels and chemicals due to the abundant hydroxyl groups.5–9 However, the rigid structure of β-1,4-glycosidic bonds between the D-glucose units and numerous hydrogen bonds between the molecular chains make the conversion of cellulose difficult.10,11 Therefore, breaking the intrinsic structure and achieving its furfure conversion remains a great challenge.Generally, crystalline cellulose is insoluble in water at ambient-temperature, but at a high temperature, water would elicit more H+ that is conducive to the hydrolysis of cellulose.12 High value-added chemicals such as ketones, keto-alcohols, and alcohols can be obtained over metal catalysts at a high temperature. Typically, cellulose can be converted to ethylene glycol (EG) efficiently over Ni–W2C/AC at 245 °C via the retro-aldol reaction of glucose.13 Moreover, Wang et al. reported the application of Ni–WOx/C bimetal catalyst in cellulose aqueous-phase conversion to C3–C4 ketol-alcohols, and optimal results were achieved at 240 °C.5 Liu et al. synthesized Sn–Co/SiO2 and Ni–Sn/SiO2 catalysts for the production of acetol directly from cellulose,14,15 which was carried out at a higher temperature of 250 °C. In fact, higher reaction temperature implies that the requirements for the reactor equipment will be more stringent, thereby increasing production costs and experimental risks. On the other hand, homogeneous mineral acids including hydrochloric acid (HCl), sulfuric acid (H2SO4), and phosphoric acid (H3PO4) were typically applied in the exploration of cellulose depolymerization because of the full accessibility to the substrate.16–19 These abovementioned homogeneous acids can disrupt the hard hydrogen bond network, which is usually carried out at a lower temperature and lead to the formation of amorphous cellulose. Further, the formed amorphous cellulose can be hydrolyzed to oligosaccharides or glucose units more easily than the crystalline cellulose.20 In particular, the solubilization mechanism of crystalline cellulose in H3PO4 revealed the formation of direct bonding between dissolved cellulose and H3PO4,21 which shows superior efficiency in cellulose hydrolysis to glucose units than other homogeneous mineral acids. Besides, H3PO4 is also thought to be desirable due to its minor volatility and nontoxicity, especially at a low concentration and has been regarded as an economic method of cellulose degradation.22,23 A recent study by our group has also confirmed that there is an interaction between P–OHs in H3PO4 and hydroxyl groups in glucose so that the C–C and C–O bonds of glucose could be cleaved selectively in the presence of metal catalysts, further facilitating the formation of the target products.24 Therefore, based on the above description, low-concentration H3PO4 aqueous solution was a feasible means for the efficient conversion of cellulose.
Although homogeneous acids have made remarkable achievements in depolymerizing cellulose as described above, the further hydrogenolysis or hydrogenation of cellulose after hydrolysis is difficult in the absence of any metal catalyst. Therefore, various metal catalysts have been used in the study of chemical production after cellulose hydrolysis. The catalyst Ru/CNT has been confirmed to be able to obtain 40% hexitols from cellulose treated with phosphoric acid.25 The efficient production of EG over Pd–W/AC and Ru/WO3 catalysts can be realized via the retro-aldol reaction of glucose.26,27 The hydrogenolysis of EG to ethanol was investigated over the Mo–Pt–WOx catalyst.28 For decades, non-noble metal catalysts were explored in the production of various chemicals due to the high price of noble metal catalysts. For example, 68% yield of sorbitol was achieved from cellulose in H3PO4–H2O solution over the NiCuAlFe catalyst.29 EG, acetol, and 1-hydroxy-2-butanone can also be obtained over metal Ni, Mo, Co, and Sn species catalysts.5,7,15,30 However, for direct cellulose conversion, which always simultaneously suffers from acid corrosion and harsh reaction conditions, the loss of activity and/or selectivity is the main drawback of non-noble catalysts.31,32 Therefore, improving such ubiquitous nature to maintain structural integrity and hydrothermal stability of the catalysts is imperative.
Noticeably, encapsulation technologies employed to prevent catalyst deactivation have generated much attention in recent years. After encapsulation, catalyst activity, selectivity, and/or stability can be improved by preventing the catalyst from leaching, poisoning, and sintering.33,34 A series of encapsulated catalysts was synthesized and applied in various areas of research, such as water oxidation, water splitting, and reduction of oxygen.35–39 Earlier, typical encapsulated-catalyst Fe4@CNT was synthesized, in which iron nanoparticles were isolated in the compartments of capped carbon nanotubes and completely separated from the external reaction environment.40 The carbon layer not only serves as the “armor” for protecting the iron nanoparticles from a corrosive acidic medium in acidic electrochemical oxygen reduction reaction (ORR), but also allows electron transfer from iron nanoparticles to the layer surface that acts in the reaction. Moreover, the encapsulated Fe3O4@C–SO3H catalyst using urea as the carbon resource was investigated in cellulose hydrolysis to glucose, and the catalyst shows good stability according to the characterization of the catalyst before and after the reaction.39 Hence, encapsulation could effectively protect the metal catalyst from deactivation and endow the catalyst with high catalytic activity, which has the potential to be applied in cellulose conversion in H3PO4 aqueous solution.
In this work, the encapsulated Co@C catalysts were synthesized and applied for the efficient conversion of cellulose combined with phosphoric acid in aqueous solution. High-value chemicals can be obtained directly from cellulose, such as ethanol, 2,5-HD, and diols with adjacent hydroxyl groups at C1 and C2 positions. The experimental results indicated that the formed graphene layers can firm protect the metal core from corrosion under high temperature hydrothermal and acidic conditions. The Co@C catalyst is able to maintain a stable structure and catalytic performance after multiple cycles, which provided the possibility for the production of value-added chemicals from renewable cellulosic biomass over non-noble metal encapsulated catalysts.
Experimental section
Materials
The chemical cellulose was purchased from Sigma-Aldrich Co., Ltd, CAS number: 9004-34-6, the crystallinity of cellulose is 60.15% (Fig. S1†), and the average particle size is 65.3 μm (Fig. S2†). Citric acid (C6H8O7·H2O), 2,5-hexanedione (AR, 98%), 1,2-hexanediol (AR, 98%), 1,2-propanediol (GC, 99.5%), 1,2-butanediol (AR, 98%), 5-methylfurfural (AR, 98%), 2-hydroxymethyl-5-methylfuran (AR, 98%), and 2-hydroxymethyl-5-methyltetrahydrofuran (AR, 98%) were purchased from Shanghai Macklin Biochemical Co., Ltd. H2SO4 (GR, 98%), H3PO4 (AR, 85%), HCl (AR, 37%), and ethanol (AR, 99.7%) were purchased from Sinopharm Chemical Reagent CO., Ltd. Co(NO3)2·6H2O (AR, 99%). Possible intermediates D-sorbitol (AR, 98%), D-glucose (AR, 99%), D-fructose (AR, 99%), ethylene glycol (AR, 98%), 5-hydroxymethyfurfural (GC, 95%), and 2,5-dimethylfuran (AR, 99%) were purchased from Aladdin Co., Ltd., All the reagents were used without further purification.Catalyst preparation
16.5 g Co(NO3)2·6H2O and 10.0 g citric acid (C6H8O7) were dissolved in 20 mL ethanol aqueous solution and the dull-red solution was stirred at 70 °C to form a gelatinous compound, followed by drying at 120 °C overnight. The obtained fluffy solid was denoted as Co–CA. Then, Co–CA was calcined to a desired temperature for 3 h under N2 flow (40 mL min−1, purity ≥ 99.999%). The catalyst obtained was denoted as Co@C-T, where T represents the calcination temperature. After that, the sample was treated with 1.0 M H2SO4 aqueous solution at 70 °C for 24 h to remove the unencapsulated Co particles and completely washed with deionized water till pH 7. Finally, the sample was dried at −48 °C overnight in a vacuum using a freeze dryer.Catalyst characterization
The SEM images were obtained on an analytical SEM S-4800 Cryo-SEM (Hitachi, Japan).X-ray diffraction (XRD) instrument (PANalytical Company, Almelo, The Netherlands) with Cu Kα (λ = 0.154 nm) radiation was used to analyze the catalyst at 40 kV and 40 mA in the 2θ range from 5° to 80°. The samples were directly used for measurement without any pretreatment.
The structure of the catalysts was determined using transmission electron microscopy (TEM-2100, JEOL Ltd., Tokyo, Japan) at an accelerating voltage of 200 kV. The samples were dispersed in ethanol after grinding and ultrasonication for 20 min before the test.
The chemical state of the elements on the catalyst was determined by XPS (Thermo Fisher Scientific Escalab 250 Xi photoelectron spectrometer) with Al Kα (1486.6 eV). The binding energy of the element was corrected by C1s at 284.8 eV. Raman spectroscopy (LabRAM HR800, 0.7 mW, HORIBA JOBIN YVON, France) was performed with a 532 nm excitation laser. The samples were directly used for measurement without any treatment.
The NH3-TPD profile was carried out by a chemical adsorption instrument (micromeritics Auto ChemII2920). The detailed operation is as follows. The sample was firstly reduced in H2/He atmosphere (30 mL min−1) at 400 °C for 1 h. Then, the sample was cooled to 100 °C in He flow for 2 h. The saturation status was obtained after NH3 was absorbed for 0.5 h, followed by removing the physically adsorbed NH3 at 100 °C under He flow. Finally, absorbed NH3 was removed by He flow, and the NH3 effluent was monitored by the thermal conductivity detector (TCD) signal. The quantification of the acid amount was determined by a loop of 250 μL for calibration.
The BET surface area and pore size distribution measurements of fresh and used Co@C catalyst were performed on a SI-MP-10 analyzer. The catalyst was firstly pre-outgassed at 6.67 × 10⁻³ Pa for 10 h. The results were determined using adsorption/desorption of N2 at −196 °C. The pore size distribution was calculated using the Barrett–Joyner–Halenda (BJH) method.
The H2-TPD profile was obtained using a chemical adsorption instrument (micromeritics Auto ChemII2920). The sample was firstly reduced in H2/He atmosphere (30 mL min−1) at 400 °C for 1 h and then adsorbed H2 was removed by increasing the temperature to 450 °C in He flow. The saturation status obtained after H2 was absorbed for 0.5 h with temperature cooled down to 50 °C. Finally, absorbed H2 was removed by He flow, and the H2 effluent was monitored by the thermal conductivity detector (TCD) signal.
On-line TG-MS analysis during precursor pyrolysis was performed using an STA-omnistar GSD 320 O3 (Germany). The sample was loaded in the chamber and was heated from room temperature to 900 °C (10 °C min−1) under Ar flow (100 mL min−1).
The Co content in the Co@C sample was measured by ICP-AES measurement (PerkinElmer OPTIMA 8000, America). 50 mg Co@C sample was calcined at 700 °C to remove the carbon in from the air in a muffle furnace. Next, the solid residue was dissolved in a 5 mL mixing solution of HNO3 and HCl (V![[thin space (1/6-em)]](https://www.rsc.org/images/entities/char_2009.gif) :
:![[thin space (1/6-em)]](https://www.rsc.org/images/entities/char_2009.gif) V = 1
V = 1![[thin space (1/6-em)]](https://www.rsc.org/images/entities/char_2009.gif) :
:![[thin space (1/6-em)]](https://www.rsc.org/images/entities/char_2009.gif) 3) at 70 °C for 12 h. Finally, the solution was transferred into a 50 mL volumetric flask used for measurement.
3) at 70 °C for 12 h. Finally, the solution was transferred into a 50 mL volumetric flask used for measurement.
CHNS elemental analysis of Co@C catalysts was performed with a Vario EL cube (7020120113310451, Germany). The sample was first dried to remove H2O, and a certain amount (<50 mg) of the sample was wrapped in aluminum foil, the air was removed by squeezing, and finally disposed via combustion.
Catalytic performance
All experiments were performed in a 10 mL stainless steel autoclave (MS-10-C276, Anhui Kemi Machinery Technology Co., Ltd, Hefei, China). In a typical run, 0.1 g cellulose, 0.05 g catalyst, and 5 mL 0.06 M H3PO4 aqueous solution were introduced into the autoclave. The reactor was sealed and flushed with pure hydrogen 4 times and set pressure of 5.5 MPa. After that, the autoclave was heated to 210 °C within 30 min and maintained for 3 h with a stirring rate of 800 rpm. After the reaction, the autoclave was naturally cooled to room temperature.Gas chromatography–mass spectrometry (GC–MS, Thermo Fisher Scientific TRACE 1300ISQ) with an INNOWAX column (30 m × 0.32 mm, film thickness 1.0 μm) and a flame ionization detector (FID) were employed for the qualitative analysis of some liquid products. The cellulose conversion and products yield were calculated according to the eqn (1)–(3) below.
 | (1) |
 | (2) |
 | (3) |
Here, mcellulose is the weight of cellulose before reaction,  is the weight of cellulose after reaction, mr is the solid mixture after reaction, mcatalyst is the weight of catalyst used in the reaction, Pi is the molar mount of the product i, Ni is the carbon number of the product i, and M(C6H10O5) is the relative molecular mass of C6H10O5 as the constructed cellulose unit.
Gas product analysis
Gaseous products were collected by a sampling bag after the reaction. Quantitative analysis was performed by an Agilent 7890A gas chromatograph with a CP-Wax 58 (FFAP) capillary column (0.25 mm × 25 m) and flame ionization detector (FID)/thermal ionization detector (TCD). The molar amount of the product was calculated using eqn (4) below. | (4) |
Here, P is the pressure after the reactor cooled to room temperature, V is the volume of the reactor, VR is the volume of the reaction solution, Pi is the molar amount of the gas product i, vi is the volume percentage of product i, T is the room temperature, and R is the molar gas constant.
Results and discussion
Catalyst characterization
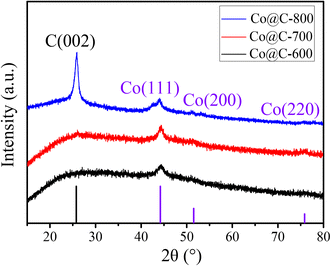
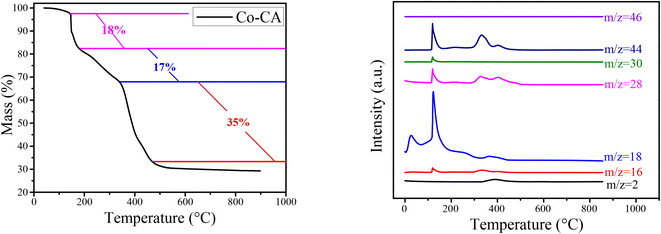
Fig. 1 shows the XRD patterns of the Co@C catalysts annealed at different temperatures in N2 flow from the Co–CA precursor. The main diffraction peaks of cobalt at 44.2°, 51.5°, and 75.8° correspond to the Co (111), Co (200), and Co (220) facets, respectively.15 The metallic Co peak at 44.2° demonstrated that there are reducing substances produced during the carbonization process of the Co–CA precursor, leading to the reduction of Co2+. We deduce that the carbon source citric acid is the main reducing substance for the reduction of Co2+, and other reducing gases released during the calcination process are auxiliary reducing agents. These gases were verified by TG-MS, as shown in Fig. 2. The result shows that the reducing gases including H2, CH4, CO, and NO were released below 500 °C, which is lower than the calcination temperature. At calcination temperatures of 600 °C and 700 °C, similar XRD diffraction peaks of Co were obtained, as exhibited in Fig. 1, and only different crystal planes of Co are presented. However, with the increase in the calcination temperature to 800 °C, the formed carbon structure was broken and resulted in a sharply increased intensity of the carbon diffraction peak at 25.5°.24,41TG-MS analysis of the Co–CA precursor was conducted at a heating rate of 10 °C min−1 under 100 mL min−1 N2 flow. The outlet gases from the decomposition was monitored by H2 (m/z = 2), CH4 (m/z = 16), H2O (m/z = 18), CO (m/z = 28), NO (m/z = 30), CO2/N2O (m/z = 44), and NO2 (m/z = 46). As shown in Fig. 2, three main weight losses of about 18%, 17%, and 35% were observed in the range of 180–190 °C, 200–360 °C, and 370–480 °C during the decomposition, respectively. Based on the MS measurements, the weight losses were ascribed to the release of NO and/or N2O decomposed from the NO3− residue, CH4, H2O, CO, and CO2 from the citric acid moiety in Co–CA, respectively. These released reducing gases assist in the reduction of Co2+ to Co.
TEM images of Co@C catalysts at different carbonization temperatures from 600 °C to 800 °C are presented in Fig. 3. The distance between two covering layers in b, d, and f was detected to be 0.334 nm, which is the interplanar spacing of graphene.24 This indicated the formation of a lamellar graphitic carbon layers. The metallic lattice spacing of Co was measured to be 0.203 nm, which belongs to the Co (111) plane.24 When the catalyst was calcined at 600 °C, the graphene layers and metallic lattice of the Co@C-600 catalyst can be observed obviously, as shown in Fig. 3b. A statistical distribution of particle size shows that most particles have about 5–8 nm size. As the calcination temperature increased to 700 °C, the well-defined structure of graphene layers and metallic lattice could also be viewed, as seen in Fig. 3d, which is similar to Fig. 3b. The measured particle size range of the Co@C-700 catalyst was mainly from 7 nm to 10 nm, slightly larger than that of the Co@C-600 catalyst. However, when the calcination temperature further increased to 800 °C, the statistical distribution result showed larger particle size, mainly from 8 nm to 11 nm, and thicker graphene layers. Furthermore, at a high calcination temperature of 800 °C, the metal lattice was observed was different to those calcined at a lower temperature due to the interpenetration of carbon and metal. Therefore, it can be seen that the calcination temperature has a deep influence on the structure formation of the Co@C catalysts.
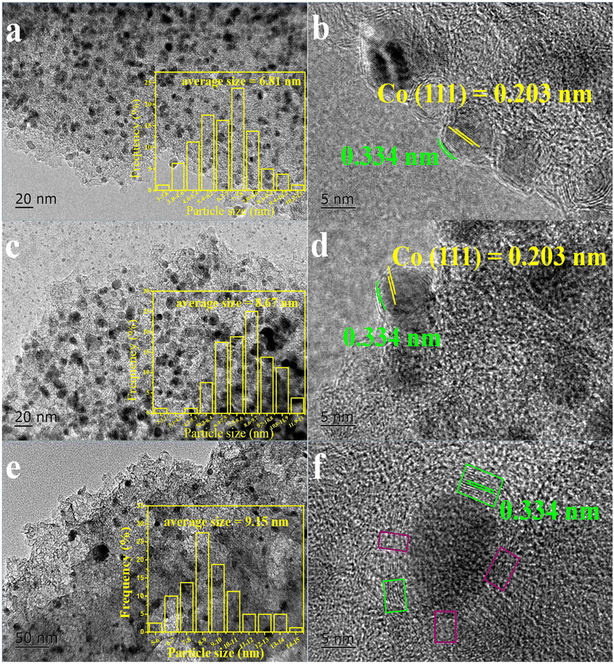 | ||
| Fig. 3 TEM images of Co@C catalysts at different calcination temperatures. a and b: Co@C-600, c and d: Co@C-700, e and f: Co@C-800. | ||
The Co content in the Co@C samples was also analyzed by the ICP-AES measurement, as shown in Table 1. 34.67% of metal Co content was detected in the Co@C-700 catalyst, which was more than that for the Co@C-600 (24.65%) and Co@C-800 catalysts (10.7%). As compared with the Co@C-700 catalyst, the hollow carbon spheres can be observed in Fig. 3b after pretreatment with H2SO4, indicating that the lower calcination temperature may lead to incompletely encapsulated metal particles; thus, nearly 10% of metal Co was lost after pickling. While the calcination temperature was increased to 800 °C, as shown in Fig. 3f, the integrity of the graphene layers would be destroyed (red flame), which leads to more Co loss after pickling.
| Entry | Sample | Co contenta (wt%) | S BET (m2 g−1) | Pvb (cm3 g−1) | Psb (nm) |
|---|---|---|---|---|---|
| a Determined by ICP-AES analysis. b The SBET was evaluated from the adsorption isotherm within the relative pressure range of 0.05 < P/P0 < 0.3. Pv and Ps distribution was obtained from the adsorption isotherm using the Barrett–Joyner–Halenda (BJH) method. c The Co@C-700 used catalyst was collected after 5 runs. | |||||
| 1 | Co@C-600 | 24.65 | 134.3 | 0.20 | 3.4 |
| 2 | Co@C-700 | 34.67 | 132.6 | 0.22 | 3.4 |
| 3 | Co@C-800 | 10.70 | 352.7 | 0.95 | 3.4 |
| 4c | Co@C-700 used | 30.04 | 121.4 | 0.20 | 3.4 |
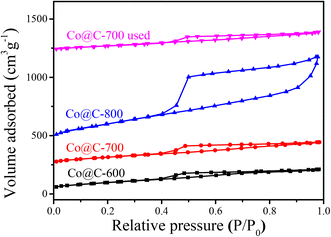
The nitrogen adsorption–desorption isotherm (Fig. 4) of different Co@C catalysts were measured to determine the physicochemical properties. The samples exhibit a typical type IV isotherm, which is one of the main characteristics of mesoporous materials.42 The surface areas were calculated using the Brunauer–Emmett–Teller (BET) method, while the pore volume and pore size distribution were evaluated from the isotherm base in the Barrett–Joyner–Halenda (BJH) method; the results are summarized in Table 1. The catalyst treated at 800 °C has a distinctly larger surface area (352.7 m2 g−1) than those at the lower carbonization temperatures of 600 °C and 700 °C (134.3 m2 g−1 and 132.6 m2 g−1, respectively), indicating that the higher calcination temperature may cause the destruction of the graphene layers, resulting in a discrepancy in the pore structure, accompanied by a larger surface area and pore volume (0.947 cm3 g−1).43
On the one hand, the pores in the outer layer of the formed graphene can allow the reaction matrix with a smaller particle size to pass through, thereby promoting the corresponding reaction. On the other hand, the outer graphene layers of the catalysts can also effectively protect the metal core from the harsh reaction conditions such as acidic corrosion and high hydrothermal temperature damage to the catalyst.34
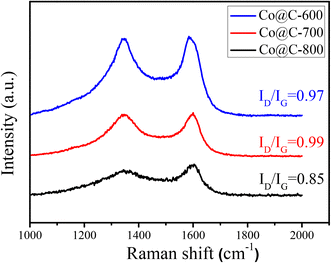
Fig. 5 shows the Raman spectra and corresponding intensity ratios of the D band (1347 cm−1) and G band (1583 cm−1) of the Co@C catalysts.44 The presence of the G band also indicates the formation of graphitic carbon in the calcination process, which can also verify the carbon species, as observed in the TEM images (Fig. 3). When the calcination temperature was 600 °C and 700 °C, the ID/IG ratios of about 1 for the disordered carbon and graphitic carbon show no obvious difference. Diversely, the ID/IG ratio dropped to 0.85, while the calcination temperature was increased to 800 °C, indicating that high calcination temperature is conducive to the formation of graphitic carbon. However, excessively high temperature would destroy the completeness of the graphene carbon layers that encapsulate the metal cobalt, which is consistent with the results obtained from the TEM images in Fig. 3f.
The H2-TPD and NH3-TPD profiles of the Co@C catalyst samples at different carbonization temperatures are shown in Fig. S3 and S4.† We can learn that the H2 desorption peaks of the Co@C catalyst samples are at a temperature below 250 °C in Fig. S3,† indicating that the catalyst has a good ability to activate H2 molecules into H atoms and could be desorbed from the catalyst surface easily.24 This also proved that the outer graphene layers can play the role of a good medium in the process of activating the external hydrogen by the metal core. This makes it possible for the application of Co@C catalysts in the subsequent hydrogenolysis reactions after cellulose hydrolysis at a low temperature. The NH3-TPD profiles in Fig. S4† show the variation tendency of weak acid contents. The peak area of weak acid at about 200 °C decreases gradually from 0.034 mmol g−1 to 0.019 mmol g−1 with the increase in the calcination temperature from 600 °C to 800 °C (Table S1†). Combined with the TG-MS analysis of the Co–CA precursor in Fig. 2 and the XPS spectra of the Co@C catalyst in Fig. 6 and Table 2, we can infer that the acidic sites of the Co@C catalyst may mainly come from the acidic groups remaining on the sample surface after the carbonization of citric acid and CoOx part in Co@C catalysts.
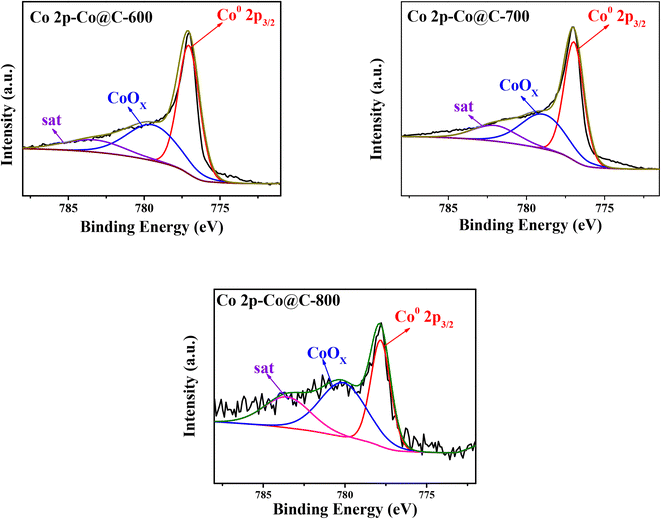
The chemical state of Co, O, and C elements in Co@C catalysts was analyzed by XPS measurements (Fig. 6, S5 and S6†). In Fig. 6, the peaks show the binding energy at 777.8 eV, indicating that partial Co2+ was reduced to Co0 in the process of catalytic carbonization.43 The existence of C–OH, C![[double bond, length as m-dash]](https://www.rsc.org/images/entities/char_e001.gif) O, and –COOH groups was confirmed in the C1s spectra (Fig. S6†) and O1s spectra (Fig. S5†). Likewise, the signal of π–π* at 292.6 eV in the C1s spectra (Fig. S6†) also proved that the cobalt particles were encapsulated by the graphene layers, which is consistent with the TEM and Raman results. Also, the atomic ratio of Co and CoOx on the catalyst surface is summarized in Table 2. The results showed that most of the Co2+ was reduced to zero-valent state during the catalyst preparation process. The reason why the Co@C-800 catalyst possesses more CoOx than Co@C-600 and Co@C-700 catalysts is because the compact graphene layers of the metal core outer layer was destroyed at a higher calcination temperature so that it is easier to be oxidized.
O, and –COOH groups was confirmed in the C1s spectra (Fig. S6†) and O1s spectra (Fig. S5†). Likewise, the signal of π–π* at 292.6 eV in the C1s spectra (Fig. S6†) also proved that the cobalt particles were encapsulated by the graphene layers, which is consistent with the TEM and Raman results. Also, the atomic ratio of Co and CoOx on the catalyst surface is summarized in Table 2. The results showed that most of the Co2+ was reduced to zero-valent state during the catalyst preparation process. The reason why the Co@C-800 catalyst possesses more CoOx than Co@C-600 and Co@C-700 catalysts is because the compact graphene layers of the metal core outer layer was destroyed at a higher calcination temperature so that it is easier to be oxidized.
The CHNS elemental analysis of Co@C catalysts was carried out in two parallel tests and is displayed in Table S3.† As the results show, the C content increases slightly from about 21% to 22.5%, while the calcinations temperature increased to 700 °C, and a sharp increase to about 60% was seen as the temperature increased to 800 °C, which also indicates that calcination has a great influence on the elemental content of the catalyst. Meanwhile, this result also reflects the TEM images (Fig. 3) and ICP data (Table 1).
Catalytic performance
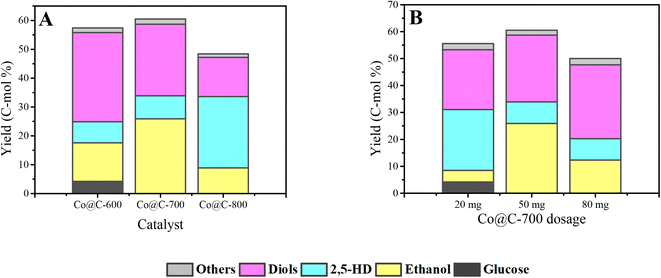
The Co@C catalysts obtained at calcination temperatures from 600 °C to 800 °C were applied in the conversion of cellulose combined with phosphoric acid aqueous solution. At the beginning, the Co@C catalysts and catalyst dosages were screened mainly based on the yield of ethanol, 2,5-HD, and diol products.Fig. 7A displays the catalytic ability of the Co@C catalyst samples that carbonized at different temperatures. The total yield of ethanol, 2,5-HD, and diols first slightly increased from 57.4% to 60.5% and then decreased to 48.4%. The Co@C-700 catalyst showed a better performance than the Co@C-600 and Co@C-800 catalysts. When the catalyst was carbonized at a lower calcination temperature of 600 °C, the main product was diols. When the temperature was increased to 700 °C, the yield of the diols decreased, and the ethanol yield increased significantly (from 13.4% to 25.9%). For Co@C annealed at 800 °C, the yields of glycols and ethanol both showed a downward trend, and the yield of 2,5-HD was visibly improved. These changes indicated that the selectivity of the products can be adjusted by adjusting the carbonization temperature of the catalyst precursor.
In Fig. 7B, with 20 mg Co@C-700 added, the main products were diols and 2,5-HD, and only 4.3% yield of ethanol was obtained. When the dosage of the catalyst was increased to 50 mg, the yield of ethanol increased to 25.9%, and that of 2,5-HD dropped to 8%, demonstrating that the increase in the catalyst dosage could promote the formation of ethanol and inhibit the production of 2,5-HD. The maximal yield of 60.5% was achieved with 50 mg Co@C-700 catalyst. Combined with the results of the Co content in Table 1, 2,5-HD is the main product with low Co content (20 mg Co@C-700), which is consistent with the experimental result of the Co@C-800 catalyst (lower Co content). Thus, the Co content has a profound effect on the distribution of products.
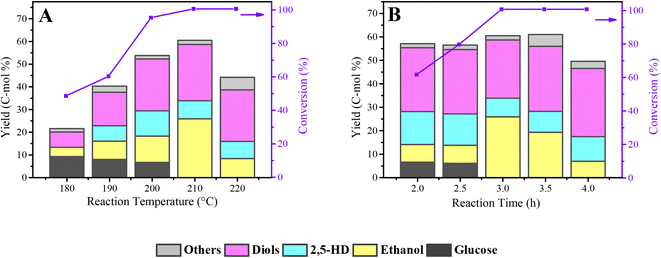
The total yield of diketones and alcohols was deeply influenced by the reaction temperature (Fig. 8A). When the reaction temperature increased from 180 °C to 210 °C, an increase in the total yield of diketones and alcohols is visible. Also, there is still about a 10% yield of residual glucose when the reaction temperature was lower than 210 °C. Noting that there is no 2,5-HD was detected at a lower temperature (180 °C), which shows that the formation of 2.5-HD needs more stringent reaction conditions. In particular, from 200 °C to 210 °C, the yield of ethanol increased obviously from 11.6% to 25.9%; meanwhile, the yield of other products only slightly changed except for the complete conversion of glucose, indicating that the production of ethanol is more sensitive to the reaction temperature than other products. Also, as the reaction temperature goes up, the yield of diols showed an upward trend, from 6.7% to 24.8%, demonstrating that the interrelated hydrogenolysis reaction of diol production requires a higher temperature.
Fig. 8B shows the effect of reaction time on the conversion of cellulose to diketones and alcohols over the Co@C-700 catalyst in phosphoric acid aqueous solution. With the increase in the reaction time, the yield of 2,5-HD showed a downward trend, from 14.1% at 2 h to 10.5% at 4 h. No obvious trend of yield was observed for the diol products from the initial 27.2% to the final 29.1%. Unlike, the yield trend of 2,5-HD and diols, the ethanol yield showed a tendency to increase first (from 7.5% to 25.9%) and then decrease (7.0%). Combined with Fig. 8A, it can be concluded that the production of ethanol is more susceptible to the reaction temperature and reaction time than 2,5-HD and diols. In the process of optimizing the reaction time, the gas products were also collected and detected after the reaction. As presented in Table S2,† the gas products analysis results showed that CH4 and CO2 were the main gas products; both of them were mainly produced via the aqueous-phase reforming process of alcohols over metal catalysts.45–47 Under the optimized reaction conditions (210 °C, 3 h), a total 60.5% yield of the products, mainly including ethanol (25.9%), 2,5-HD (8.0%), and diols (24.8%), can be achieved directly from cellulose in phosphoric acid aqueous solution.
We also carried out conversion experiments using ethanol as a substrate at different reaction times, and the liquid and gaseous products were collected for testing; the results are listed in Table S4.† As the reaction time increased from 0.5 h to 1 h, ethanol conversion increased from 3.2% to 5.9%, and the yield of gaseous products also increased. CH4 and CO2 are the main components of the gaseous products, and C2H6 only accounts for a small part. Therefore, the reason why ethanol yield decreased after 3 h reaction time is mainly because ethanol is prone to CH4 and CO2 production via the aqueous-phase reforming process over metal catalysts.46,47
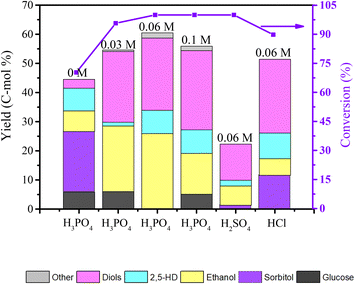
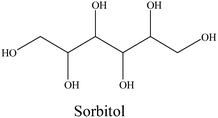
The experimental results in Fig. 9 show the influence of different H3PO4 concentrations and different mineral acids on the product distribution of cellulose conversion over the Co@C-700 catalyst. 70.3% cellulose conversion was obtained, while no H3PO4 was introduced, sorbitol was the main product, and only 17.9% yield of diketones and alcohols was achieved with the Co@C-700 catalyst. When the Co@C-700 catalyst was adopted with H3PO4, both the conversion of cellulose and the total yield of products were greatly improved, especially ethanol and diols, indicating that there is a synergy between the Co@C-700 catalyst and H3PO4, and the formation of ethanol is closely related to the addition of phosphoric acid. However, a high concentration of H3PO4 will also induce the side reaction and further decrease the total yield of diketones and alcohols. When H3PO4 was replaced with the same concentration of H2SO4 and HCl, lower ethanol yield was obtained, further indicating that H3PO4 is critical in the direct conversion of cellulose to ethanol over the Co@C-700 catalyst.
Reaction pathways
Scheme 1 shows the proposed reaction pathways for cellulose conversion over Co@C catalysts in phosphoric acid aqueous solution.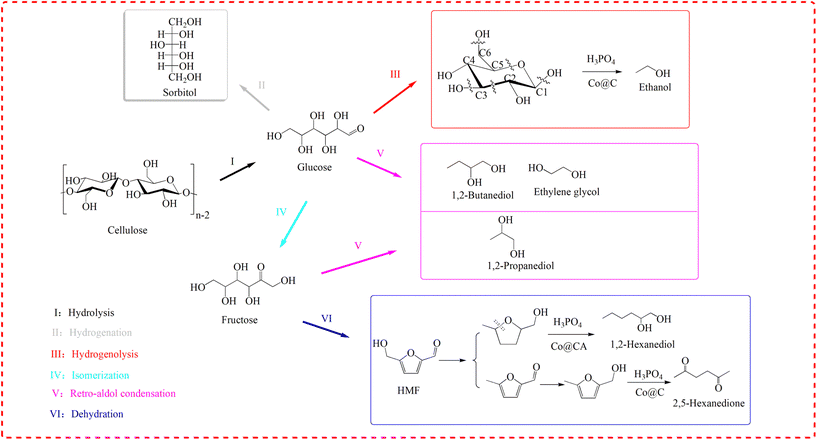 | ||
| Scheme 1 Proposed reaction pathways for cellulose conversion over Co@C catalysts in phosphoric acid aqueous solution. | ||
In this work, H3PO4 plays a major role in the hydrolysis of cellulose compared to the weak acidity of the Co@C catalyst. In this process, the metal catalyst cannot have strong hydrogenation capacity, otherwise a large amount of sorbitol will be generated, which will make it more difficult to convert to downstream products. For example, when Ru was supported on activated carbon and carbon nanotubes, the main products of cellulose conversion were sorbitol and mannitol.48,49
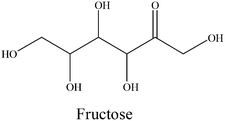
After cellulose is hydrolyzed to glucose, the results of 31P NMR analyses indicate that cyclic di-ester bonds could also be formed via dehydration between the C–OH of glucose and P–OH of H3PO4.24 On the other hand, the outer graphene layers of the Co@C catalyst could also induce the penetration of electrons from the metal to the catalyst surface and form an electronic negative surface so that the corresponding C–C and C–O bands of the reactants could be activated and fractured.36,50 Therefore, in this study, ethanol can be formed by the selective breakage of corresponding bonds of C–C and C–O through the synergy of Co@C catalysts and H3PO4. The retro-aldol reaction also occurs under high temperature and high hydrogen pressure in the presence of a metal catalyst.7,51 C2 and C4 alcohols (such as ethylene glycol and 1,2-butanediol) can be obtained due to the retro-aldol reaction of glucose, followed by selective hydrodeoxygenation. Glucose could also be isomerized to fructose, and C3 products (for example, 1,2-propanediol) were possibly formed via the retro-aldol reaction of fructose over metal catalyst.52 In addition, CH4 and CO2 are often generated as the main gaseous products via the aqueous-phase reforming process of alcohols over metal catalysts.45–47,53
As an important intermediate, HMF can be generated by the dehydration of fructose under acidic conditions, but due to the instability of HMF in aqueous phase, it could be converted rapidly in this wok.54–56 This also explains the reason why HMF was not detected. Similarly, the combination of P–OH of H3PO4 and –OH of the furan substrates will cause the activation of adjacent C–O bonds, and then the activated C–O bond will be cleaved under the action of the metal catalyst to generate the corresponding 2,5-HD and 1,2-hexanediol.57
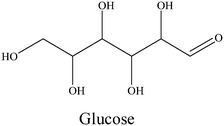
Table 3 shows the verification of product production with possible intermediate substrates. The product distribution from glucose exhibits a similar result to cellulose conversion: all products including ethanol, diols, and 2,5-hexanedione can be obtained. All the results of other intermediates in Table 3 could also maintain consistency with the proposed Scheme 1.
Catalyst stability
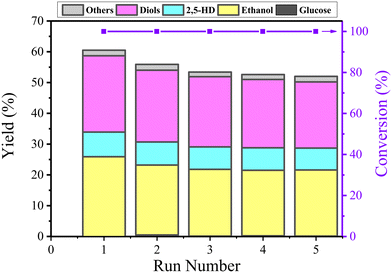
After each reaction, the used catalyst was separated via centrifugation and washed with deionized water till pH 7, and finally dried at −48 °C overnight in a vacuum using a freeze dryer. Then, the catalyst was directly used for the next run. The stability of the catalyst was evaluated by performing five runs at optimized reaction conditions (210 °C for 3 h). As shown in Fig. 10, the total yield of the products decreased from 60.5% to 52% after three runs and stabilized at this value for subsequent runs; the ICP test results (Table 1) shows that the Co content after 5 runs decreased to 30.04 wt% from 34.67 wt%, indicating that a few incompletely encapsulated Co leached under such high temperature hydrothermal conditions during the first three cycles. The slight decrease in the total yield of the products is due to the decrease in the Co content.The used Co@C-700 catalyst after five runs was collected and analyzed by TEM (Fig. S7†) and BET (Fig. 4). In detail, the particle size of the catalyst increased slightly from 8.67 nm to 9.07 nm, the SBET of the catalyst decreased from 132.6 m2 g−1 to 121.4 m2 g−1, the PV of the catalyst decreased by 0.02 cm3 g−1 (from 0.22 cm3 g−1 to 0.22 cm3 g−1), and the PS of the catalyst remained the same at 3.4 nm. These results showed that the structure and physicochemical properties of the used catalyst are similar to the fresh one, indicating that the outer graphene layers could protect the Co metal core from phosphoric acid corrosion. We also measured the stability of the Co@C-700 catalyst by TG-MS testing (Fig. S8†). The catalyst showed no obvious mass loss except for H2O under the optimal 210 °C reaction conditions, also indicating the durability of the catalyst.
Conclusion
A series of characterization methods was carried out to explore the formation mechanism and reaction activity of Co@C catalysts in this study. These results indicate that the Co particle is successfully encapsulated with graphene layers, and the calcination temperature has a great influence on the characteristics of the catalyst. Most Co2+ can be reduced to Co in situ due to the particularity of the carbon source citric acid in the roasting process; further reduction pretreatment of the catalyst is not necessary. Meanwhile, exploratory experiments of cellulose conversion indicate that the outer graphene layers of the catalysts could protect the metal core from high temperature, as well as hydrothermal and acidic reaction conditions so that the Co@C catalyst could remain stable for at least five runs. Combining the Co@C-700 catalyst with H3PO4, a total high 60.5% yield of diketones and alcohols, mainly including ethanol, 2,5-hexanedione, and diols, could be achieved directly from cellulose. It was also found that there is a synergistic effect between phosphoric acid and Co@C catalysts. The interaction between –OH on H3PO4 and –OH on substrates can activate the corresponding C–C bond and C–O bond, making it easier to be cleaved by the Co@C catalyst. Hence, this work provided an opportunity for diketone and alcohol production from renewable cellulosic biomass over the encapsulated non-noble metal catalyst.Conflicts of interest
The authors declare that there is no competing financial interest.Acknowledgements
The authors gratefully acknowledge the financial support from the National Science Foundation of China (51976220), the National Key R&D Program of China (2019YFC1905303), the Guangdong Basic and Applied Basic Research Foundation (2020A1515011540).References
- G. W. Huber and A. Corma, Angew. Chem., Int. Ed., 2007, 46, 7184–7201 CrossRef CAS PubMed.
- T. Ennaert, J. Van Aelst, J. Dijkmans, R. De Clercq, W. Schutyser, M. Dusselier, D. Verboekend and B. F. Sels, Chem. Soc. Rev., 2016, 45, 584–611 RSC.
- P. Gallezot, Chem. Soc. Rev., 2012, 41, 1538–1558 RSC.
- H. Xin, X. Hu, C. Cai, H. Wang, C. Zhu, S. Li, Z. Xiu, X. Zhang, Q. Liu and L. Ma, Front. Chem., 2020, 8, 333 CrossRef CAS PubMed.
- H. Wang, H. Xin, C. Cai, C. Zhu, Z. Xiu, Q. Liu, Y. Weng, C. Wang, X. Zhang, S. Liu, Z. Peng and L. Ma, ACS Catal., 2020, 10, 10646–10660 CrossRef CAS.
- A. Yamaguchi, N. Mimura, M. Shirai and O. Sato, ACS Sustainable Chem. Eng., 2019, 7, 10445–10451 CrossRef CAS.
- N. Ji, T. Zhang, M. Zheng, A. Wang, H. Wang, X. Wang and J. G. Chen, Angew. Chem., Int. Ed., 2008, 47, 8510–8513 CrossRef CAS.
- M. Yabushita, H. Kobayashi and A. Fukuoka, Appl. Catal., B, 2014, 145, 1–9 CrossRef CAS.
- J. Pang, J. Sun, M. Zheng, H. Li, Y. Wang and T. Zhang, Appl. Catal., B, 2019, 254, 510–522 CrossRef CAS.
- R. Singh, B. B. Krishna, G. Mishra, J. Kumar and T. Bhaskar, Renew. Energy, 2016, 98, 226–237 CrossRef CAS.
- Y. Yu, D. Liu and H. Wu, Energy Fuels, 2012, 26, 7331–7339 CrossRef CAS.
- N. Akiya and P. E. Savage, Chem. Rev., 2022, 102, 2725–2750 CrossRef PubMed.
- N. Ji, T. Zhang, M. Zheng, A. Wang, H. Wang, X. Wang, Y. Shu, A. L. Stottlemyer and J. G. Chen, Catal. Today, 2009, 147, 77–85 CrossRef CAS.
- X. Liu, X. Liu, G. Xu, Y. Zhang, C. Wang, Q. Lu and L. Ma, Green Chem., 2019, 21, 5647–5656 RSC.
- X. Liu, X. Liu, H. Wang, T. Xiao, Y. Zhang and L. Ma, Green Chem., 2020, 22, 6579–6587 RSC.
- R. Rinaldi and F. Schuth, ChemSusChem, 2009, 2, 1096–1107 CrossRef CAS.
- J. Hirayama, H. Kobayashi and A. Fukuoka, Kagaku to Kogyo, 2020, 93, 273–278 CAS.
- W. L. Faith, Ind. Eng. Chem., 1945, 37, 9–11 CrossRef CAS.
- F. Bergius, Ind. Eng. Chem., 1937, 29, 247–253 CrossRef CAS.
- H. Kobayashi, M. Yabushita, T. Komanoya, K. Hara, I. Fujita and A. Fukuoka, ACS Catal., 2013, 3, 581–587 CrossRef CAS.
- P. Conte, A. Maccotta, C. De Pasquale, S. Bubici and G. Alonzo, J. Agric. Food Chem., 2009, 57, 8748–8752 CrossRef CAS PubMed.
- H. Li, N. J. Kim, M. Jiang, J. W. Kang and H. N. Chang, Bioresour. Technol., 2009, 100, 3245–3251 CrossRef CAS PubMed.
- S. Gámez, J. J. González-Cabriales, J. A. Ramírez, G. Garrote and M. Vázquez, J. Food Eng., 2006, 74, 78–88 CrossRef.
- Q. Liu, H. Wang, H. Xin, C. Wang, L. Yan, Y. Wang, Q. Zhang, X. Zhang, Y. Xu, G. W. Huber and L. Ma, ChemSusChem, 2019, 12, 3977–3987 CrossRef CAS.
- W. Deng, X. Tan, W. Fang, Q. Zhang and Y. Wang, Catal. Lett., 2009, 133, 167–174 CrossRef CAS.
- A. Wang and T. Zhang, Acc. Chem. Res., 2013, 46, 1377–1386 CrossRef CAS.
- N. Li, Y. Zheng, L. Wei, H. Teng and J. Zhou, Green Chem., 2017, 19, 682–691 RSC.
- M. Yang, H. Qi, F. Liu, Y. Ren, X. Pan, L. Zhang, X. Liu, H. Wang, J. Pang, M. Zheng, A. Wang and T. Zhang, Joule, 2019, 3, 1937–1948 CrossRef CAS.
- J. Zhang, S.-B. Wu and Y. Liu, Energy Fuels, 2014, 28, 4242–4246 CrossRef CAS.
- A. A. Kirali, S. Sreekantan and B. Marimuthu, New J. Chem., 2020, 44, 15958–15965 RSC.
- C. H. Bartholomew, Appl. Catal., A, 2001, 212, 17–60 CrossRef CAS.
- M. Argyle and C. Bartholomew, Catalysts, 2015, 5, 145–269 CrossRef CAS.
- L. Yu, D. Deng and X. Bao, Angew. Chem., Int. Ed., 2020, 59, 15284–15297 Search PubMed.
- H. O. Otor, J. B. Steiner, C. García-Sancho and A. C. Alba-Rubio, ACS Catal., 2020, 10, 7630–7656 CrossRef CAS.
- X. Cui, P. Ren, D. Deng, J. Deng and X. Bao, Energy Environ. Sci., 2016, 9, 123–129 RSC.
- J. Deng, P. Ren, D. Deng and X. Bao, Angew. Chem., Int. Ed., 2015, 54, 2100–2104 CrossRef CAS PubMed.
- G. Qian, G. Yu, J. Lu, L. Luo, T. Wang, C. Zhang, R. Ku, S. Yin, W. Chen and S. Mu, J. Mater. Chem. A, 2020, 8, 14545–14554 RSC.
- G. Li, J. Yu, W. Yu, L. Yang, X. Zhang, X. Liu, H. Liu and W. Zhou, Small, 2020, 16, 2001980 CrossRef CAS PubMed.
- C. Zhang, H. Wang, F. Liu, L. Wang and H. He, Cellulose, 2013, 20, 127–134 CrossRef CAS.
- D. Deng, L. Yu, X. Chen, G. Wang, L. Jin, X. Pan, J. Deng, G. Sun and X. Bao, Angew. Chem., Int. Ed., 2013, 52, 371–375 CrossRef CAS PubMed.
- Y. Liang, H. Wang, H. Xin, X. Hu, L. Yan, Q. Zhang, C. Wang, Q. Liu and L. Ma, ACS Sustainable Chem. Eng., 2021, 9, 15394–15405 CrossRef CAS.
- K. S. Walton and R. Q. Snurr, J. Am. Chem. Soc., 2007, 129, 8552–8556 CrossRef CAS PubMed.
- X. Zhang, S. Liu, Y. Zang, R. Liu, G. Liu, G. Wang, Y. Zhang, H. Zhang and H. Zhao, Nano Energy, 2016, 30, 93–102 CrossRef CAS.
- W. Zhao, P. Tan, J. Zhang and J. Liu, Phys. Rev. B: Condens. Matter Mater. Phys., 2010, 82, 245423 CrossRef.
- Z. Tai, J. Zhang, A. Wang, M. Zheng and T. Zhang, Chem. Commun., 2012, 48, 7052–7054 RSC.
- H. Wang, C. Zhang, Q. Liu, C. Zhu, L. Chen, C. Wang and L. Ma, Energy Fuels, 2018, 32, 11529–11537 CrossRef CAS.
- R. D. Cortright, R. R. Davda and J. A. Dumesic, Nature, 2002, 418, 964–967 CrossRef CAS PubMed.
- C. Luo, S. Wang and H. Liu, Angew. Chem., Int. Ed., 2007, 46, 7636–7639 CrossRef CAS PubMed.
- L. S. R. Natalia Rey-Raap, J. J. de Melo Órfão, J. L. Figueiredo and M. F. R. Pereira, Appl. Catal., B, 2019, 256, 117826 CrossRef.
- J. Su, Y. Yang, G. Xia, J. Chen, P. Jiang and Q. Chen, Nat. Commun., 2017, 8, 14969 CrossRef.
- H. Wang, X. Hu, S. Liu, C. Cai, C. Zhu, H. Xin, Z. Xiu, C. Wang, Q. Liu, Q. Zhang, X. Zhang and L. Ma, Cellulose, 2020, 27, 7591–7605 CrossRef CAS.
- H. Wang, C. Zhu, Q. Liu, J. Tan, C. Wang, Z. Liang and L. Ma, ChemSusChem, 2019, 12, 2154–2160 CrossRef CAS PubMed.
- H. Song, P. Wang, S. Li, W. Deng, Y. Li, Q. Zhang and Y. Wang, Chem. Commun., 2019, 55, 4303–4306 RSC.
- J. N. Chheda, Y. Román-Leshkov and J. A. Dumesic, Science, 2006, 312, 1933–1937 CrossRef PubMed.
- J. N. Chheda, Y. Román-Leshkov and J. A. Dumesic, Green Chem., 2007, 9, 342–350 RSC.
- H. Xin, T. Zhang, W. Li, M. Su, S. Li, Q. Shao and L. Ma, RSC Adv., 2017, 7, 41546–41551 RSC.
- S. Fujita, K. Nakajima, J. Yamasaki, T. Mizugaki, K. Jitsukawa and T. Mitsudome, ACS Catal., 2020, 10, 4261–4267 CrossRef CAS.
Footnote |
| † Electronic supplementary information (ESI) available. See DOI: https://doi.org/10.1039/d2re00273f |
| This journal is © The Royal Society of Chemistry 2023 |

