Stochastic economic evaluation of different production pathways for renewable propylene glycol production via catalytic hydrogenolysis of glycerol†
Fredrick O.
Omoarukhe
a,
Emmanuel I.
Epelle
b,
Chukwuma C.
Ogbaga
 cd and
Jude A.
Okolie
 *ef
*ef
aDepartment of Chemical Engineering, University of Ilorin, P. M. B. 1515, Ilorin, Nigeria
bSchool of Computing, Engineering & Physical Sciences, University of the West of Scotland, Paisley PA1 2BE, UK
cDepartment of Biological Sciences, Nile University of Nigeria, Airport Road Bypass, Abuja, Nigeria
dDepartment of Microbiology and Biotechnology, Nile University of Nigeria, Airport Road Bypass, Abuja, Nigeria
eSt. Peter's College, Muenster, Canada
fGallogly College of Engineering, University of Oklahoma, Norman, Oklahoma, USA. E-mail: jude.okolie@ou.edu
First published on 13th October 2022
Abstract
Hydrogenolysis of crude glycerol is perceived as an alternative route for the production of propylene glycol owing to the environmental challenges and declining petroleum sources. However, the source of hydrogen is still a concern for the implementation of this technology. In this study, we investigated the economic viability of three different renewable propylene glycol (RPG) production pathways. The goal of this study is to determine whether the method used to produce hydrogen affects how economically feasible and environmentally friendly it is to produce RPG from the catalytic hydrogenolysis of glycerol. Furthermore, we developed a mathematical model using a stochastic approach based on Monte Carlo simulation to estimate the minimum selling price of RPG. The model considers uncertainties and future price trends. The results showed that scenario 1, with a net present value (NPV) of 3.2m US$, is more economical compared to scenarios 2 and 3, which have lower NPV values of 0.2m US$ and −1.9m US$, respectively. The stochastic mean minimum selling price (MSP) of propylene glycol for all three scenarios is also similar to the deterministic values (2.9 US$ per kg for scenario 1, 6.3 US$ per kg for scenario 2 and 7.6 US$ per kg for scenario 3). In terms of the GHG emissions, the direct emissions for scenario 2 (0.23 Mtons CO2 eq. per y) are greater than those for scenarios 1 and 3, while scenario 1 has the highest amount of indirect CO2 emissions, almost twice that of scenario 3 and 9.35 times more than scenario 1. The growing body of knowledge on the production of renewable propylene glycol will be strengthened by this study.
1. Introduction
Glycerol is one of the major by-products obtained during biodiesel production. Moreover, the interest in biodiesel has increased tremendously due to its non-toxicity and biodegradability.1 Biodiesel is a promising alternative to petroleum-based fuels in diesel engines, furnaces, and stationary equipment.2 The increased demand and production of biodiesel have led to a rise in crude glycerol production. On average, for every 1 m3 of biodiesel, 0.1 m3 of crude glycerol is produced.3 Crude glycerol contains up to 80% glycerol and 20% impurities including soap, methanol, fatty acid methyl esters (FAMEs), and inorganic elements.4 It should be mentioned that crude glycerol has low economic value due to the high purification cost. The high degree of impurity in crude glycerol influences its physical, chemical, and biological properties. Therefore, it is imperative to develop new technologies for the valorization of crude glycerol. Finding new uses of crude glycerol would ensure the sustainability of the biodiesel biorefinery.Several studies have proposed different routes for the conversion of crude glycerol to green fuels and value-added chemicals. Okolie et al.,5 showed that crude glycerol could be converted to green fuels such as biomethane, hydrogen and bioethanol. Monteiro et al.,3 identified different green chemicals that can be produced from glycerol. The chemicals include 1,3-propanediol, and 1,2-propanediol or propylene glycol.3 In another study, crude, purified, and pure glycerol were used to cultivate Trichosporon oleaginosus, which was used for the production of lipids.6 The study reported that crude glycerol negatively influenced the production of lipids when compared to pure glycerol. The thermochemical conversion of crude glycerol to hydrogen has also been widely explored by several studies.7,8
Among the green fuels and chemicals produced from crude glycerol, propylene glycol (1,2-propanediol) is the subject of immense interest due to its wide range of industrial applications.9 Propylene glycol is a ubiquitous chemical that can be used as a non-toxic antifreeze, moisturizer, surfactant, and preservative.10 Commercially, propylene glycol is often produced from the hydrolysis of petroleum-derived propylene oxide, a process that produces significant greenhouse gases. Furthermore, the challenges of environmental pollution and declining petroleum reserves have promoted interest in alternative propylene glycol production routes.
Propylene glycol can be produced from biodiesel-derived crude glycerol and hydrogen through a process known as hydrogenolysis. Selective hydrogenolysis reaction of glycerol to propylene glycol proceeds in the presence of a metallic catalyst and hydrogen in a batch or continuous reactor.11 However, the source of hydrogen is still a concern for the worldwide implementation of the technology. While most of the hydrogenolysis process relies on petroleum-derived hydrogen, there is a need to develop alternative hydrogen sources to promote the sustainability and environmentally benign nature of the process. Moreover, if the hydrogen used in hydrogenolysis is obtained from renewable sources, the produced propylene glycol is known as renewable propylene glycol (RPG). Integrating hydrogen production processes with glycerol hydrogenolysis helps to enhance resource utilization and promote a circular economy.
Few researchers have explored the design of integrated hydrogen production and hydrogenolysis reaction. Sun et al.12 performed a comparative study to assess the economic and environmental impact of two RPG production routes: conventional hydrogenolysis with external hydrogen and catalytic transfer hydrogenolysis (CATH) without external hydrogen, instead the process uses renewable H-donors in a liquid medium.12 Although CATH is more economical and environmentally friendly, the process faces challenges related to the development of an active and selective solid catalyst material with a bifunctional capability that can simultaneously produce hydrogen and promote hydrogenolysis reactions.12 Jiménez et al.10 assessed the technical and economic feasibility of RPG production with hydrogen purchased from external sources. The minimum selling price (MSP) was compared with another process that uses hydrogen produced from steam reforming of natural gas and renewable sources. Although the three production routes are economically feasible, the use of hydrogen from external sources had the lowest RPG minimum selling price (MSP) of 1.17 US$ per kg.10 However, the authors did not specify the technology used to produce the renewable hydrogen. In addition, the MSP was obtained using a deterministic approach.
The deterministic MSP cannot completely capture the considerable uncertainties and risks embedded within the techno-economic variables.10 Uncertainties such as capital cost, energy efficiency and equipment cost are not captured with the deterministic approach. In contrast, stochastic analysis is suitable for capturing the technical and economic uncertainties in any economic model.13The stochastic methods have the advantage of being able to identify the uncertainties in the input and then evaluate its impact on the output of the system. It is very useful in handling fluctuations in price and the intermittent nature of renewable energy systems.14 Stochastic analyses have been used by several authors to assess the uncertainties and economic feasibility of different biofuel production technology.13,15 However, there are no reported studies on the techno-economic analysis of different RPG production routes using the stochastic approach based on Monte Carlo simulation. To address the knowledge gaps, this study compares different economic viabilities of three different RPG production routes. Scenario 1 uses hydrogen from the steam reforming of methane. Scenario 2 uses hydrogen produced from hydrothermal gasification while the third scenario uses hydrogen from PEM electrolysis process.
Another novelty in our study is the development of a mathematical model for estimating the MSP of RPG production for the three production routes. In the deterministic approach, the MSP is usually estimated using numerical analysis tools such as the goal-seek function (often referred to as What-if-Analysis) in Excel. The goal-seek function utilises the Newton algorithm. However, it is difficult to estimate the MSP with the stochastic approach. This is because the Monte Carlo simulation cannot be evaluated directly when combined with a numerical analysis tool. The proposed mathematical model helps to address the limitations of the stochastic approach. It also considers uncertainties and future price trends.
2. Methodology
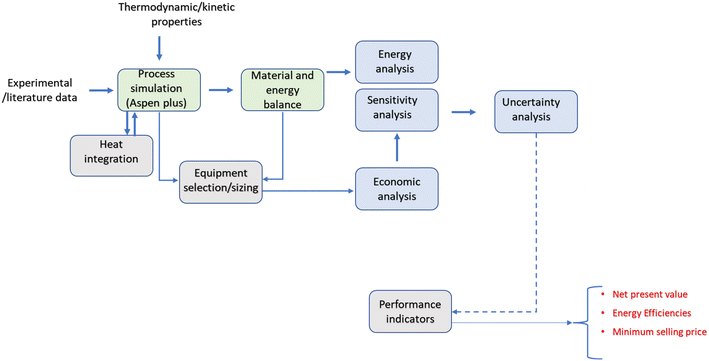
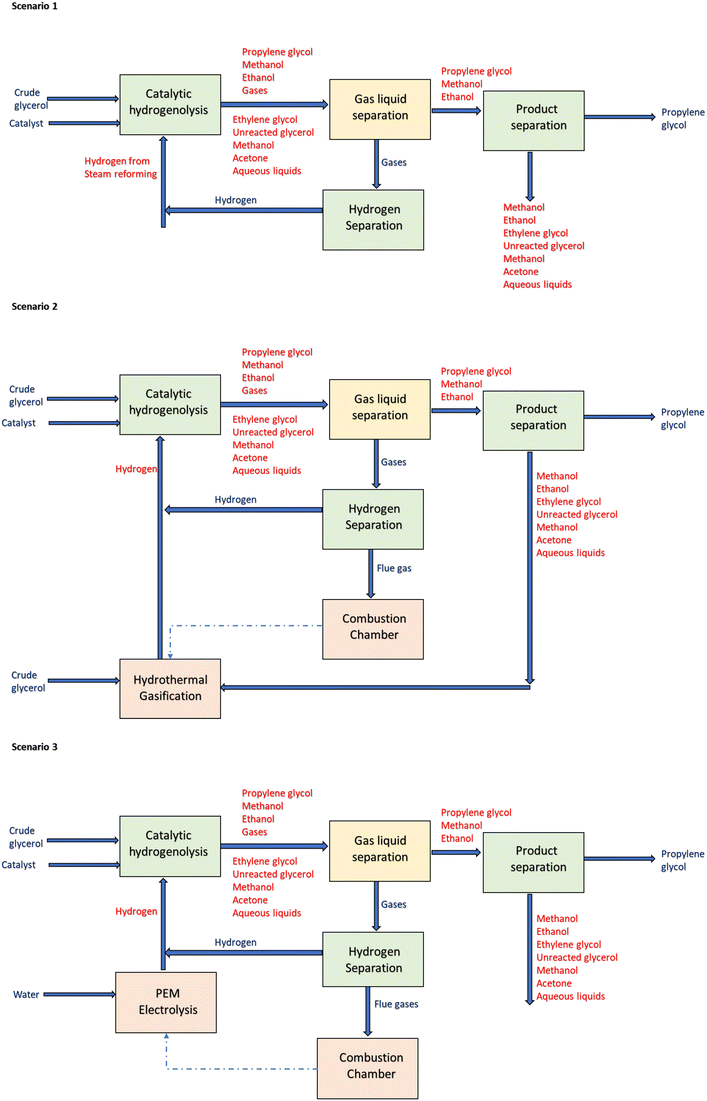
Schematics of the framework used in the present study are presented in Fig. 1. A conceptual design comprising catalytic hydrogenolysis of glycerol and hydrothermal gasification for hydrogen production is proposed. Three main scenarios are evaluated: scenario 1 was designed to produce RPG from crude glycerol via catalytic hydrogenolysis (CTH). The source of hydrogen in scenario 1 is from steam reforming of natural gas. In contrast, scenario 2 is an integrated process comprising CTH and hydrothermal gasification (HTG) of crude glycerol. The latter is the source of hydrogen for the CTH process. It should be mentioned that crude glycerol was selected as the source of hydrogen due to its wide availability and low cost. Crude glycerol valorization is challenging and often prohibitively expensive due to the presence of impurities such as water, soaps, alcohols, fatty acid methyl esters (FAMEs), and inorganic elements. Therefore, leveraging crude glycerol for hydrogen production could also contribute to the advancement of biodiesel refineries. Scenario 3 includes CTH and electrolysis for hydrogen production. Schematics of the three scenarios are shown in Fig. 2.Experimental data from CTH and literature information are used as inputs for the conceptual design. The catalysts and operating conditions used in the conceptual design are based on prior experimental studies.8,16,17 Heat integration is also performed to optimize the process energy requirements and reduce the overall capital cost.
2.1 Process design
![[thin space (1/6-em)]](https://www.rsc.org/images/entities/char_2009.gif) :
:![[thin space (1/6-em)]](https://www.rsc.org/images/entities/char_2009.gif) Zn
Zn![[thin space (1/6-em)]](https://www.rsc.org/images/entities/char_2009.gif) :
:![[thin space (1/6-em)]](https://www.rsc.org/images/entities/char_2009.gif) Cr
Cr![[thin space (1/6-em)]](https://www.rsc.org/images/entities/char_2009.gif) :
:![[thin space (1/6-em)]](https://www.rsc.org/images/entities/char_2009.gif) Zr (elemental ratio 3
Zr (elemental ratio 3![[thin space (1/6-em)]](https://www.rsc.org/images/entities/char_2009.gif) :
:![[thin space (1/6-em)]](https://www.rsc.org/images/entities/char_2009.gif) 2
2![[thin space (1/6-em)]](https://www.rsc.org/images/entities/char_2009.gif) :
:![[thin space (1/6-em)]](https://www.rsc.org/images/entities/char_2009.gif) 1
1![[thin space (1/6-em)]](https://www.rsc.org/images/entities/char_2009.gif) :
:![[thin space (1/6-em)]](https://www.rsc.org/images/entities/char_2009.gif) 3) catalyst were used in the simulation.16 The catalyst was selected for the simulation because it produced high conversion and selectivity during the CTH reaction. In addition, when compared with other catalysts, the kinetics data has been documented in the literature.
3) catalyst were used in the simulation.16 The catalyst was selected for the simulation because it produced high conversion and selectivity during the CTH reaction. In addition, when compared with other catalysts, the kinetics data has been documented in the literature.
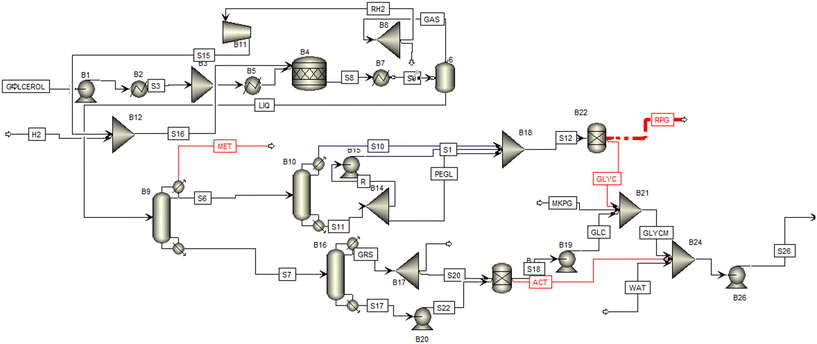 | ||
| Fig. 3 Overall process flow diagram, of the conceptual design for the catalytic hydrogenolysis of glycerol to propylene glycol. | ||
The preheated glycerol and hydrogen gas are both fed to the reactor (B4) which operates at a temperature of 250 °C and a pressure of 7 MPa. The operating conditions are selected based on previous studies.16 The resulting CTH products containing aqueous liquids, unreacted glycerol, alcohols, glycol mixtures, acetic acid, hydrogen, and other gaseous products are cooled (B7) before entering the gas–liquid separator (B6) where it is separated into gaseous and liquid effluents. Hydrogen gas is recovered from the gaseous stream through a membrane separator, recycled and mixed with the hydrogen feed.
The resulting liquid effluent comprising glycol mixtures and alcohols (propylene glycol, water, ethylene glycol, ethanol, acetone, acetic acid, methanol) is then sent to a series of separation units where it is separated into water, alcohols, glycols, glycerol, and propylene glycol. The sequence includes methanol recovery, azeotropic separation and propylene glycol purification. The azeotropic distillation column is modelled through a series of Redfrac combinations in Aspen Plus. The number of stages and the reflux ratio are specified by the trial-and-error method. The unreacted glycerol, acids, water, alcohols, and other compounds are mixed together and sent to the hydrothermal gasification unit.
The thermodynamic modelling of the PEM unit was carried performed with Aspen Plus and the process flow diagram is shown in Fig. 4. The property package, electrolyte non-random two liquid Redlich-Kwong (ENRTL-RK), was employed for the thermodynamic methods for modelling the electrolyte.22
The electrolytic process involves splitting deionized water into hydrogen, oxygen, and their respective ions using two reactor blocks representing the anode and cathode based on reactions (1)–(3).23
| Anode: H2O → 2H + 1/2O2 + 2e− | (1) |
| Cathode: 2H + 2e− → H2 | (2) |
| Overall: H2O → H2 + 1/2O2 | (3) |
![[thin space (1/6-em)]](https://www.rsc.org/images/entities/char_2009.gif) 900 kg h−1 enters the anodic compartment (ANODE) of the electrolyser where it is split into produce protons, electrons, hydrogen, and oxygen. The electrons leave the anode via the external power circuit, which provides the reaction's driving force The resulting stream is further fed into a membrane block (MEMBRANE) where it is separated into oxygen and hydrogen-rich streams. The oxygen-rich stream enters the heat exchanger (HEX1) where it was cooled to about −123 °C and passed through a flash separator to produce liquified oxygen. A combination of coolers and separators helps in the dehydration and liquefaction of oxygen.
900 kg h−1 enters the anodic compartment (ANODE) of the electrolyser where it is split into produce protons, electrons, hydrogen, and oxygen. The electrons leave the anode via the external power circuit, which provides the reaction's driving force The resulting stream is further fed into a membrane block (MEMBRANE) where it is separated into oxygen and hydrogen-rich streams. The oxygen-rich stream enters the heat exchanger (HEX1) where it was cooled to about −123 °C and passed through a flash separator to produce liquified oxygen. A combination of coolers and separators helps in the dehydration and liquefaction of oxygen.
The protons are transported to the cathode side via a conducting membrane that allows the formation of hydrogen. The produced hydrogen is cooled to ambient temperature and fed to a flash drum where gaseous components are knocked out. The resulting stream is further passed to a separator for efficient separation of gaseous and liquid components including the produced hydrogen gas. A detailed description of the operating blocks is summarized in Table 1. It should be emphasized that a FORTRAN statement was defined and used to calculate the electrolytic electricity demand based on the hydrogen production rate and assumed efficiencies. The presented stoichiometric reactions provide detailed insights into all the electrochemical reactions occurring during PEM electrolysis, it also helps in estimating the mass and energy balances. This is very important for feasibility studies.
| Name on Aspen Plus process design | Aspen Plus block name | Description | Process input |
|---|---|---|---|
| ANODE | RStoic | Converts water into oxygen and electron | Pressure 35 bar; temp 80 °C |
| CATHODE | RStoic | Converts water into hydrogen and proton | Pressure 35 bar; temp 80 °C |
| MEMBRANE | Sep | Separates hydrogen and oxygen and their respective ions | Split fractions: H2O is 0.5; H2 is 0; O2 is 1; H+ is 0.01; and OH− is 0.01 |
| HE1 | Cooler | Cools liquid oxygen | Temperature −123 °C; pressure 51 bar. |
| HE2 | Cooler | Cools hydrogen gas | Temperature 25 °C; pressure 35 bar |
| B5 | Common separator | Helps in the dehydration of oxygen | Split fractions: H2O is 0; H2 is 0; O2 is 1; H+ is 0; and OH− is 0 |
| B7 | Common separator | Helps in the dehydration of hydrogen | Split fractions: H2O is 0; H2 is 1; O2 is 0; H+ is 0; and OH− is 0 |
| B1 | Flash separator | Separates oxygen from other components | Pressure 1.5 bar; temperature −213 °C |
| B4 | Flash separator | Separates hydrogen from other components | Pressure 35 bar; temperature 25 °C |
![[thin space (1/6-em)]](https://www.rsc.org/images/entities/char_2009.gif) :
:![[thin space (1/6-em)]](https://www.rsc.org/images/entities/char_2009.gif) 10) in the mixer B24. The mixture is sent to a pump to increase the pressure to supercritical conditions (24 MPa), followed by preheating to 450 °C It should be mentioned that the hydrothermal gasification (HTG) unit proposed is similar to our previous studies.17,24 Schematics of the HTG unit are represented in Fig. 5. The incoming feed was not preheated to supercritical temperatures above 500 °C before being sent to the HTG reactor to minimize salt or inorganic materials deposition in the pipelines.
10) in the mixer B24. The mixture is sent to a pump to increase the pressure to supercritical conditions (24 MPa), followed by preheating to 450 °C It should be mentioned that the hydrothermal gasification (HTG) unit proposed is similar to our previous studies.17,24 Schematics of the HTG unit are represented in Fig. 5. The incoming feed was not preheated to supercritical temperatures above 500 °C before being sent to the HTG reactor to minimize salt or inorganic materials deposition in the pipelines.
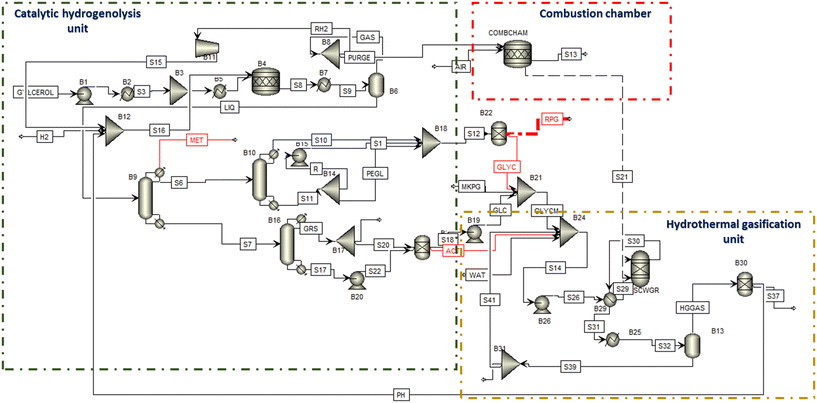 | ||
| Fig. 5 Overall process flow diagram, of the conceptual design for integrated catalytic hydrogenolysis and hydrothermal gasification. | ||
The HTG reactor was represented with the RGibbs block in Aspen Plus. The RGibbs block operating at 700 °C and 25 MPa allows the conversion of biogenic materials into gases and aqueous liquids based on the Gibb energy minimization method. This method defines species expected in the product and then proceeds with the estimation of product distribution that minimizes the Gibbs free energy value.25–28 The Gibbs minimization method has the advantages of being extremely flexible and preventing important reactions in the scheme that are neglected.26
The hot syngas (S30) was sent back to the heat exchanger (B29) and used as a feed preheater while the cold stream (S31) was cooled before being sent to the gas–liquid separator. The separated gas (HGGAS) is sent to the hydrogen separator. The separator was modelled with the specification of HYSEP Technology model (HYSEP Modul Type 1308, ECN, palladium membrane filter).17 Moreover, the separated hydrogen was recycled back as feedstock for CTH.
In addition, a combustion chamber operating at 1000 °C and 1.1 MPa was used to recover heat from the flue gas produced during the CTH process as shown in Fig. 5. The flue gas (PURGE) is fed to the combustion chamber (COMBCHAM) while air is added to aid the combustion process. The combustion chamber was modelled with a stoichiometric block by using two main reactions for methane and hydrogen combustion (eqn (4) and (5)).
| CH4 + 2O2 → CO2 + 2H2O | (4) |
| H2 + 0.5O2 → H2O | (5) |
2.2 Heat integration
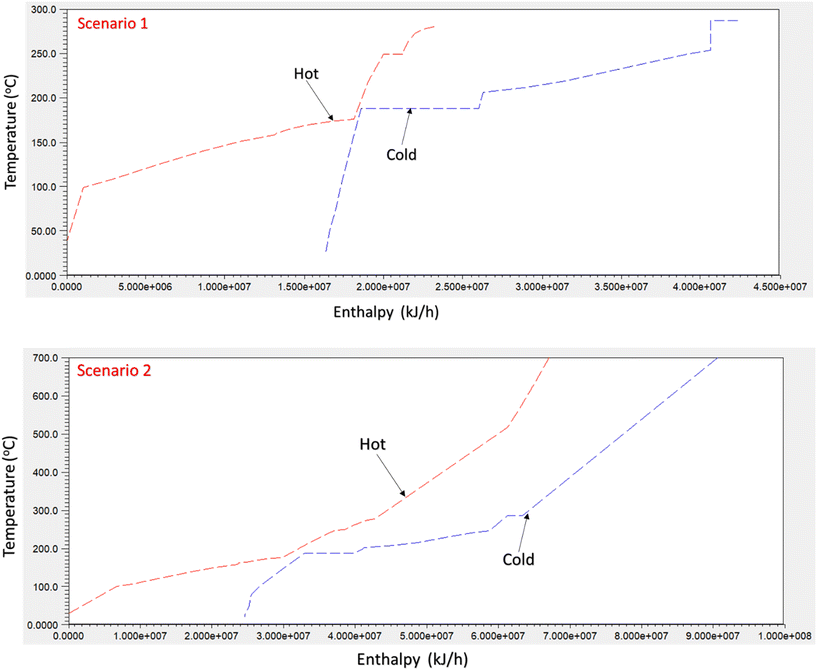
In this study, heat exchanger network optimization was performed to reduce the energetic losses in the system. Process simulation data including the mass and energy balance were extracted from Aspen Plus to the ASPEN Energy Analyzer. The ASPEN Energy Analyzer identifies different streams including those with high and low temperatures to evaluate the heat flows and determine the target temperatures. The heat exchanger network was designed using pinch analysis by assuming a minimum approach temperature (ΔTmin) of 10 °C.29 The pinch analysis is a promising approach that is often used in developing heat exchanger networks and process utilities to reduce energy consumption and the overall process cost. Moreover, waste heat is used up by identifying the hot and cold streams and matching them below and above the pinch point, respectively.The composite curve used to describe pinch analysis for scenario 2 is presented in Fig. 6. The composite curve shows the pinch temperature and the optimum possible heat that can be recovered in the heat exchanger network. The utility allocation method proposed by Linnhoff et al.30 was applied during the heat exchanger network design. This method selects the cheapest utility that satisfies the target temperature requirements. That way, the overall operating cost can be minimized. Therefore, the objective selected was to minimize the total annualized cost while the optimized variable is the heat exchanger load and the split stream. The optimization problem leads to a mixed liner program that is solved in Aspen Energy Analyzer. Although the energy analyzer does not guarantee a globally optimal solution, it proposes a series of near-optimal designs for the heat exchanger network.
2.3 Economic evaluation
A stochastic techno-economic analysis (TEA) was conducted for the three scenarios to determine the most economically viable design. While the deterministic method is based on a single estimate of the expected values, the stochastic method involves the presentation of up to 10![[thin space (1/6-em)]](https://www.rsc.org/images/entities/char_2009.gif) 000 random samples representing all the uncertain probability distributions.13 Profitability parameters such as net present value (NPV) and minimum selling price (MSP) are used to access the economic feasibility of the proposed designs.
000 random samples representing all the uncertain probability distributions.13 Profitability parameters such as net present value (NPV) and minimum selling price (MSP) are used to access the economic feasibility of the proposed designs.
NPV is defined as the sum of the present values of all cash flows, including the initial investment.31 NPV is represented in eqn (6), where t denotes period; n represents the plant life and r denotes the discount rate. In addition, Rt denotes the net cash flow.
 | (6) |
| Rt = RRPGt − Ct | (7) |
 | (8) |
| Ct = FCIt + LFt + NWt + COPt + Tt − LSVt | (9) |
| RRPGt = PPPGtQPPGt | (10) |
| sTt = (RRPGt − (INRt + NWt + COPt)) × TTAX | (11) |
Substituting eqn (9)–(11) into eqn (8):
 | (12) |
 | (13) |
![[thin space (1/6-em)]](https://www.rsc.org/images/entities/char_2009.gif) 000 iterations. The value of QPPGt was specified in the Aspen Plus simulation while the COPt, Tt, LSVt and INRt were computed for each period.
000 iterations. The value of QPPGt was specified in the Aspen Plus simulation while the COPt, Tt, LSVt and INRt were computed for each period.
The discounted cash flow analysis (DCFA) was used to appraise the NPV with the economic assumptions listed in Table 2. The aspen process economic analyzer (AEA) and literature search were used to determine the equipment purchase costs (EPC) for the three scenarios. Plant-wide costs of heat exchangers were also calculated with AEA. All the estimated costs were scaled up to 2022 using the chemical engineering plant cost indices. The capital expenditure (CAPEX) was calculated as a fraction of EPC. In the same manner, the operating expenditure (OPEX) was determined based on the assumptions outlined in our previous studies.24,31 Detail information on the CAPEX and OPEX calculations are presented in the ESI.†
| Parameters | Assumptions |
|---|---|
| Plant lifetime | 20 years |
| Plant construction duration | 3 years |
| Plant operating hours | 8000 h per year |
| Tax rate | 40% |
| Land cost | 2% of fixed capital investment |
| Basis | 5000 kg h−1 or glycerol |
| Rate of return | 12% |
| Depreciation method | Modified accelerated cost recovery system (MACRS) |
| Working capital | 5% of fixed capital investment |
3. Results and discussion
3.1 Model validation
To ensure the validation and reliability of the CTH model, the results were compared with experimental values from a previous study.16 Glycerol conversion for the model and experimental results during CTH was calculated from eqn (14). Fig. 7 compares the glycerol conversion for the experimental and model results for CTH of glycerol. It should be emphasized that the experimental results were performed at the following operating conditions: 80 wt% of glycerol solution, mass of catalyst (3.0 g), temperature (240 °C), H2 pressure (4 MPa), speed of agitation (1000 rpm), reaction time (3 h, 6 h and 8 h).16 | (14) |
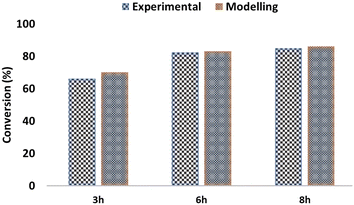 | ||
| Fig. 7 Comparison between experimental and model results for the catalytic hydrogenolysis of glycerol to propylene glycol. All experimental results were adapted from previous studies.16 | ||
Since the liquid products from CTH including the unreacted crude glycerol are used as the feedstock for HTG it is very difficult to validate the HTG model for the present study. However, a similar HTG model has been developed with higher accuracy in our previous study.5
3.2 Process simulation and emissions
The process simulation results for the three scenarios are briefly summarized in Table 3. The results include the feed flow rate (glycerol and hydrogen), propylene glycol yield, process efficiencies and greenhouse gas (GHG) emissions. The GHG emissions include direct and indirect emissions. The latter refers to the cradle to plant entry of GHG emissions. In contrast, the direct emissions comprise all the process emissions produced from the plant entry to the exit.29 A Canadian average electricity mix emissions of 120 g of CO2 eq. per kW h were used for the study.32| Parameters | Scenario 1 (catalytic hydrogenolysis) | Scenario 2 (catalytic hydrogenolysis and hydrothermal gasification) | Scenario 3 (catalytic hydrogenolysis and PEM electrolysis) |
|---|---|---|---|
| Glycerol feed flowrate (kg h−1) | 5000 | 5000 | 5000 |
| Hydrogen feed flowrate (kg h−1) | 60 | 60 | 60 |
| Hydrothermal gasification efficiency (%) | NA | 81.70 | NA |
| Hydrogenolysis conversion efficiency (%) | 83 | 83 | 83 |
| Total electricity consumed (kW) | 306.2 | 1141.8 | 5435.5 |
| Direct GHG emitted (Mtons CO2eq. per y) | 0.04 | 0.11 | 0.04 |
| Indirect GHG emitted (Mtons CO2eq. per y) | 12.35 | 1.32 | 6.30 |
| Energy savings (%) | 27.91 | 61.95 | 18.67 |
The conversion efficiencies of CTH and HTG are reported as 83% and 81.7% respectively. These values correlate with experimental data reported in previous studies.16,24 Comparing the three scenarios, scenario 3 consumes the highest amount of electricity, 17.7 times more than scenario 1 and 4.8 times more than scenario 3. The high electricity consumption for scenario 2 is due to the high amount of electricity required to split water into hydrogen and oxygen during electrolysis. It should be emphasized that effective heat integration and the use of the combustion chamber led to 61.95% energy savings for scenario 2 and 18.67% energy savings for scenario 3. Moreover, a 27.91% energy saving was attained in scenario 1 by applying the heat exchanger network analysis to minimize energy consumption.
As shown in Table 3, the direct emissions for scenario 2 (0.23 Mtons CO2 eq. per y) are greater than scenarios 1 and 3. The higher direct emission of scenario 2 compared to other scenarios is due to the addition of the hydrothermal gasification unit that produces biogenic CO2. Moreover, the PEM electrolysis does not produce any direct CO2 emissions, however, there is indirect CO2 associated with the electrolysis electricity consumption.
Scenario 1 has the highest amount of indirect CO2 emissions, almost twice that of scenario 3 and 9.35 times more than scenario 1. The increased GHG emissions of scenario 1 could be attributed to the use of emissions from the hydrogen production process. Scenario 1 proposes the use of steam-reforming derived hydrogen, a process that emits a large amount of GHG. In contrast, scenarios 2 and 3 use HTG and PEM electrolysis for hydrogen production, thereby decreasing the indirect emissions. In general, the production of hydrogen from hydrothermal gasification and PEM electrolysis led to a decline in indirect GHG emissions as well as a significant increase in the total electricity consumed by the process even when the combustion of flue gas is used to reduce the energy requirement.
3.3 Economic analysis
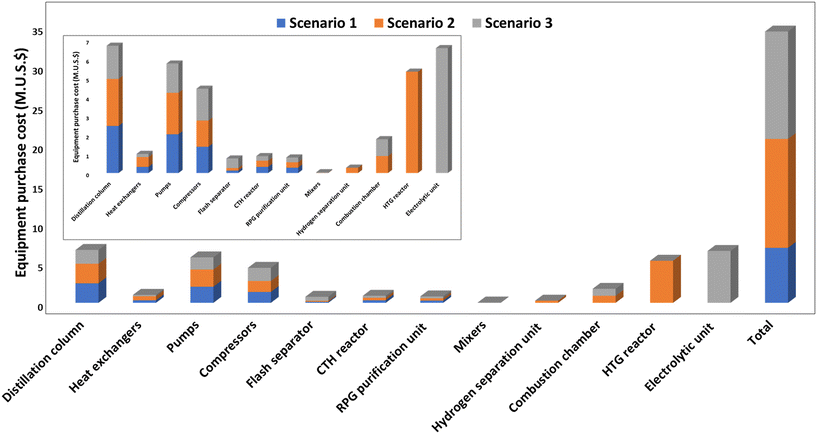 | ||
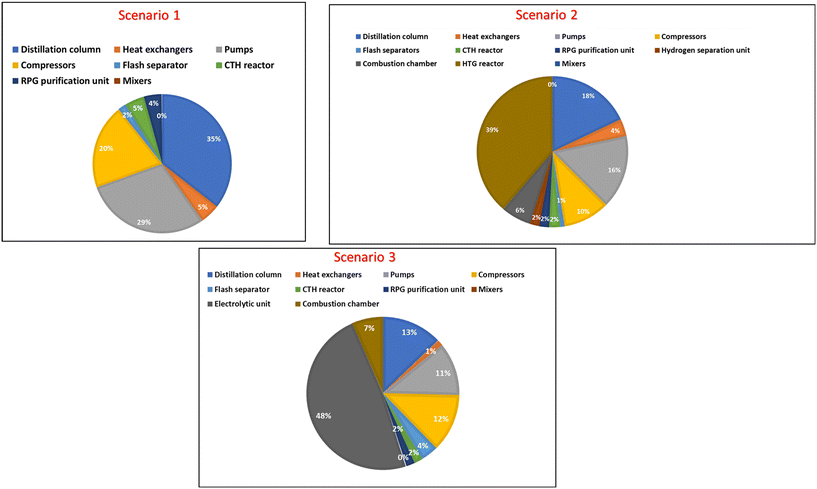
| Fig. 8 An overview of the equipment purchase cost for the three scenarios (including the cost of installation). | ||
The breakdown of EPC for the three scenarios shows that the distillation column accounts for a significant part of the overall cost. The distillation column accounts for 35% of the EPC for scenario 1, 18% for scenario 2 and 12% for scenario 3. Furthermore, the CTH product separation and recovery includes the sequential arrangement of three distillation columns for effective product recovery. Moreover, each distillation column has its reflux system, condenser and reboiler, therefore, contributing to the increased cost. Other factors that can affect the cost of the distillation column includes operating pressures, and feed composition, and generally, the taller the distillation column, the more trays required to separate more products and eventually the more expensive the column becomes.
The pumps account for 29% of the EPC for scenario 1, 16% of EPC for scenario 2 and 11% of EPC for scenario 3. In contrast, heat exchangers contribute a lower percentage to the overall EPC for the three scenarios. It should be mentioned that the electrolytic unit accounts for almost half of the EPC in scenario 3, while the HTG reactor contributes 39% of the EPC for scenario 2.
| LLabour (h y−1) = 2.13 × plant capacity (kg h−1)0.242 × nprocessing_steps × (hplant_operation/24) | (15) |
| Cost components | Scenario 1 (m US$) | Scenario 2 (m US$) | Scenario 3 (m US$) |
|---|---|---|---|
| Equipment purchase cost (EPC) | 7.0 | 13.8 | 13.6 |
| Working capital (WC) | 3.1 | 6.1 | 6.0 |
| Startup cost (SUC) | 1.0 | 2.0 | 2.0 |
| Feedstock cost | 1.6 | 4.5 | 1.2 |
| Capital expenditure CAPEX | 24.7 | 49.0 | 48.3 |
| Fixed operating cost (FOC) | 2.1 | 3.9 | 4.1 |
| Total utilities cost | 1.5 | 6.6 | 15.9 |
| Variable operating costs (VOC) | 3.1 | 11.1 | 17.1 |
| Yearly operating expenses (OPEX) | 5.2 | 15.0 | 21.2 |
As seen in Table 4, the CAPEX of scenarios 2 and 3 is almost twice that of scenario 1. Also, scenario 3 has higher yearly operating expenses (OPEX). The operating expenses include the fixed operating cost (FOC) and variable operating cost (FOC). The latter comprises feedstock and utility costs. The higher utility cost incurred during electrolytic hydrogen production contributes to the increased OPEX of scenario 3.
The total feedstock cost including the cost of catalysts and crude glycerol is also a major contributor to the OPEX. Compared to other case studies, scenario 2 had a significantly higher feedstock cost due to the extra cost of makeup glycerol for HTG, the Cost of catalyst and deionized water for HTG. Previous studies have shown that the cost of feedstock contributes towards the overall green fuel and chemical production cost. For instance, Michaga et al.33 recently showed that raw material cost contributes up to 30% of the overall sustainable aviation fuel production cost. Mukherjee et al.31 reported that the raw material cost contributes up to 48.1% of the OPEX during activated carbon production from spent coffee grounds. Okolie et al.35 showed that the raw material cost accounts for 41.1% of the OPEX for an integrated process comprising anaerobic digestion and ammonia recovery.
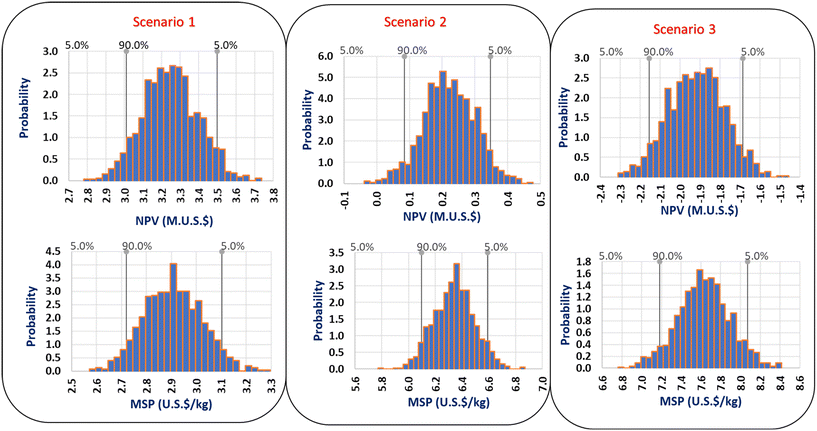 | ||
| Fig. 10 Net present value (NPV) and minimum selling price (MSP) distributions including future price distribution and uncertainty for the three scenarios. | ||
The stochastic analysis also evaluates the probability for the NPV and MSP to be higher or lower than the market value. The analysis helps to determine the uncertainty associated with future price distributions. As illustrated in Fig. 10, there is a 90% confidence interval for the NPV of scenario 21 to fall within 3.0–3.5m US$. Scenario 2 and 3 also has a 90% confidence interval for the NPV to be within 0.08–0.35m US$ and −2.1–−1.7m US$ respectively. In contrast, there is a 90% confidence interval for the MSP of scenarios 1, 2 and 3 to fall within the range of 2.7–3.1 US$ per kg, 6.1–6.6 US$ per kg and 7.2–8.1 US$ per kg respectively. The data range reported here is very useful to quantify uncertainties in future price and for the technology commercialization.
Based on the MSP and NPV, scenario 1 is preferable because of its low MSP and highest NPV. Moreover, scenarios 2 and 3 have a relatively high MSP of propylene glycol. Scenario 3 is not profitable because of its negative NPV. A project is considered profitable if the NPV values are positive while negative NPV values denote that the project is not economically feasible.17
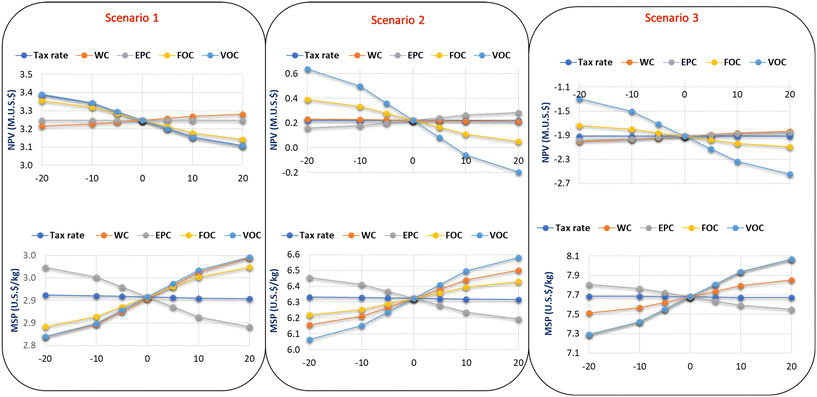 | ||
| Fig. 11 Spyder plots showing the sensitivity analysis for a 20% change in uncertainty variables and the impact on the NPV and MSP of propylene glycol. | ||
With respect to the MSP, parameters such as FOC, VOC and WC had a significant level of uncertainty on the MSP for scenarios 1 and 2. While a change in the tax rate had no impact on the MSP for all three scenarios. FOC and VOC have the same level of uncertainty for the MSP in scenario 3. In contrast, the EPC has a medium impact on the MSP. The FOC and VOC are the major cost components during the OPEX calculations. The FOC includes cost components such as overhead fees, insurance, and maintenance cost. These cost components are computed as a fraction of the total cost of labor. The cost of labor is also dependent on the plant location because countries have varying minimum wages and salary structures. Also, the wages of workers are sensitive to the economic situation of a country. Therefore, workers' wages could ultimately increase in the future thereby influencing the NPV and MSP.
The VOC comprises feedstock and utility costs. These prices are also sensitive to the plant location and government regulations. The location of the plant would determine the logistics and transportation cost for the raw materials. While the utility cost is highly unstable and depends on several factors such as the source of electricity, carbon pricing, and government incentives.
However, it is recommended that the plant should be located within the area where biodiesel is produced to minimize the volatilities in the feedstock price. Also, longstanding procurement plans should be in place between the biodiesel and propylene glycol producers. Moreover, if the processing equipment used in the study keeps developing, the EPC might decrease in future years, which in turn could lead to a decline in the NPV and MSP.
3.4 Discussion on the price competitiveness of the proposed scenarios
Commercial propylene glycol is produced from the Business as Usual (BAU) route via the non-catalytic liquid-phase hydrolysis of propylene oxide (PO). While the process has environmental concerns due to the use of petroleum-derived PO, the technology is well known and has been widely used for propylene glycol production with 85% product yield.36 The present study evaluates three different scenarios for producing propylene glycol based on hydrogen sources. The stochastic MSP of propylene glycol obtained in this study is compared with previous studies and the BAU route.Although the sustainable production of propylene glycol and the evaluation of the process economics are relatively new, the results were compared with previous studies. Jiménez et al.10 reported a propylene glycol MSP of 1.36 US$ per kg for the CTH when the hydrogen is produced from steam reforming of glycerol. Gonzalez-Garay et al.36 used the economic potential factor in US$ per kg as an indicator for assessing the economic viability. They reported an economic potential value of 1.32 US$ per kg of propylene glycol production for a technology that combines isothermal hydrogenolysis of glycerol with external hydrogen (although the source of hydrogen was not clearly specified). Moreover, the MSP for propylene glycol produced via the BAU route is between 1.53–2.2 US$ per kg.35,36
Compared with the previous studies, the MSP reported in the present study is higher. However, it is worthy to mention that the economic results presented in this assessment differ from those studies. Specifically, the study applies the plant cost index for the year 2021 while the other studies documented the cost based on the year of publication. Also, varying cost estimation methodologies were adopted. Previous studies apply the deterministic approach, a method that is unable to capture price uncertainties. The price of propylene glycol used in the economic evaluation also plays a significant role in the estimated MSP. To the best of our knowledge, previous studies did not document the price of propylene glycol used, therefore making it challenging to perform a direct MSP comparison.
4. Conclusion, study limitations and future research prospects
In this work, we have conducted a detailed stochastic techno-economic analysis for different propylene glycol production pathways. Scenario 1 was designed to produce RPG from crude glycerol via CTH with hydrogen produced from steam reforming of natural gas. Scenario 2 is an integrated process comprising CTH and HTG of crude glycerol. Scenario 3 includes CTH and PEM electrolysis for hydrogen production. Process design for all the scenarios was developed in Aspen Plus. Furthermore, a mathematical model was proposed and used to determine the stochastic MSP of propylene glycol. The key finding of the study is that scenario 1 is more economical compared to other scenarios. Scenario 1 has a NPV of 3.2m US$. On the contrary, scenarios 2 and 3 have lower NPV values of 0.2m US$ and −1.9m US$ respectively. The negative NPV for scenario 3 indicates that the proposed technology is not economically viable. The mean MSP of propylene glycol for all three scenarios are also similar to the deterministic values (2.9 US$ per kg for scenario 1, 6.3 US$ per kg for scenario 2 and 7.6 US$ per kg for scenario 3).In terms of the GHG emissions, the direct emission for scenario 2 (0.23 Mtons CO2 eq. per y) is greater than scenarios 1 and 3. Scenario 1 has the highest amount of indirect CO2 emissions, almost twice that of scenario 3 and 9.35 times more than scenario 1. The increased GHG emissions of scenario 1 could be attributed to the use of emissions from the hydrogen production process. Scenario 1 proposes the use of steam-reforming derived hydrogen, a process that emits a large amount of GHG. The present study demonstrates the impact of integrating different hydrogen sources on the economic viability of propylene glycol production via CTH. However, a detailed life cycle assessment is missing from the study. In addition, a comprehensive evaluation of several hydrogen sources is not evaluated in the study. Future studies should focus on a detailed cradle-to-grave life cycle assessment to evaluate the environmental impacts of the proposed technology. Catalytic transfer hydrogenolysis (CATH) is another promising process that uses renewable H-donors in a liquid medium for hydrogenolysis reaction. However, comparative process modelling, TEA and LCA analyses are scarcely reported. This should also be the focus of future studies. Other sources of sustainable hydrogen production such as methane pyrolysis, thermochemical gasification or fermentation should also be incorporated with CTH, and the economic and environmental impact should be evaluated as part of future studies.
Abbreviations
| AEA | Aspen process economic analyzer |
| CAPEX | Capital expenditure |
| CATH | Catalytic transfer hydrogenolysis |
| CTH | Catalytic hydrogenolysis |
| DCFA | Discounted cash flow analysis |
| ENRTL-RK | Electrolyte non-random two liquid Redlich-Kwong |
| EPC | Equipment purchase cost |
| FAMEs | Fatty acid methyl esters |
| GHG | Greenhouse gas |
| HTG | Hydrothermal gasification |
| MSP | Minimum selling price |
| NPV | Net present value |
| NRTL-RK | Non-random two liquid Redlich-Kwong |
| OPEX | Operating expenses |
| PEM | Polymer electrolytic membrane |
| RPG | Renewable propylene glycol |
Conflicts of interest
There are no conflicts to declare.References
- M. N. Bin Mohiddin, Y. H. Tan, Y. X. Seow, J. Kansedo, N. M. Mubarak, M. O. Abdullah, Y. S. Chan and M. Khalid, J. Ind. Eng. Chem., 2021, 98, 60–81 CrossRef.
- A. S. Roy, A. Chingkheihunba and K. Pakshirajan, Green Energy and Technology, 2016, pp. 83–105 Search PubMed.
- M. R. Monteiro, C. L. Kugelmeier, R. S. Pinheiro, M. O. Batalha and A. da Silva César, Renewable Sustainable Energy Rev., 2018, 88, 109–122 CrossRef CAS.
- J. A. Okolie, J. Ivan Escobar, G. Umenweke, W. Khanday and P. U. Okoye, Fuel, 2022, 307, 121821 CrossRef CAS.
- J. A. Okolie, M. E. Tabat, B. Gunes, E. I. Epelle, A. Mukherjee, S. Nanda and A. K. Dalai, Energy Convers. Manage.: X, 2021, 12, 100131 CAS.
- J. Chen, S. Yan, X. Zhang, R. D. Tyagi, R. Y. Surampalli and J. R. Valéro, Waste Manage., 2018, 71, 164–175 CrossRef CAS PubMed.
- R. L. Maglinao and B. B. He, Ind. Eng. Chem. Res., 2011, 50, 6028–6033 CrossRef CAS.
- M. Raza, A. Inayat and B. Abu-Jdayil, Sustainability, 2021, 13, 12813 CrossRef CAS.
- J. A. Okolie, iScience, 2022, 25, 104903 CrossRef CAS PubMed.
- R. X. Jiménez, A. F. Young and H. L. S. Fernandes, Renewable Energy, 2020, 158, 181–191 CrossRef.
- M. R. Nanda, Z. Yuan, W. Qin and C. Xu, Catal. Rev.: Sci. Eng., 2016, 58, 309–336 CrossRef CAS.
- P. Sun, W. Zhang, X. Yu, J. Zhang, N. Xu, Z. Zhang, M. Liu, D. Zhang, G. Zhang, Z. Liu, C. Yang, W. Yan and X. Jin, Front. Chem., 2021 DOI:10.3389/fchem.2021.778579.
- X. Zhao, G. Yao and W. E. Tyner, Appl. Energy, 2016, 183, 318–326 CrossRef.
- A. Zakaria, F. B. Ismail, M. S. H. Lipu and M. A. Hannan, Renewable Energy, 2020, 145, 1543–1571 CrossRef.
- A. Bittner, W. E. Tyner and X. Zhao, Biofuels, Bioprod. Biorefin., 2015, 9, 201–210 CrossRef CAS.
- R. V. Sharma, P. Kumar and A. K. Dalai, Appl. Catal., A, 2014, 477, 147–156 CrossRef CAS.
- J. A. Okolie, S. Nanda, A. K. Dalai and J. A. Kozinski, Bioresour. Technol., 2021, 331, 125005 CrossRef CAS PubMed.
- A. N. Marchesan, M. P. Oncken, R. M. Filho and M. R. W. Maciel, Chem. Eng. Trans., 2019, 74, 733–738 Search PubMed.
- S. Shiva Kumar and V. Himabindu, Mater. Sci. Energy Technol., 2019, 2, 442–454 Search PubMed.
- C. Lamy, Int. J. Hydrogen Energy, 2016, 41, 15415–15425 CrossRef CAS.
- M. Carmo, D. L. Fritz, J. Mergel and D. Stolten, Int. J. Hydrogen Energy, 2013, 38, 4901–4934 CrossRef CAS.
- M. von Kurnatowski and M. Bortz, Processes, 2021, 9, 1–24 CrossRef.
- S. Michailos, S. McCord, V. Sick, G. Stokes and P. Styring, Energy Convers. Manage., 2019, 184, 262–276 CrossRef CAS.
- J. A. Okolie, M. E. Tabat, B. Gunes, E. I. Epelle, A. Mukherjee, S. Nanda and A. K. Dalai, Energy Convers. Manage.: X, 2021, 12, 100131 CAS.
- J. A. Okolie, E. I. Epelle, S. Nanda, D. Castello, A. K. Dalai and J. A. Kozinski, J. Supercrit. Fluids, 2021, 173, 105199 CrossRef CAS.
- D. Castello and L. Fiori, Bioresour. Technol., 2011, 102, 7574–7582 CrossRef CAS.
- E. I. Epelle, W. Obande, G. A. Udourioh, I. C. Afolabi, K. S. Desongu, U. Orivri, B. Gunes and J. A. Okolie, Sustainable Energy Fuels, 2022, 6, 3324–3343 RSC.
- G. C. Umenweke, R. B. Pace, E. Santillan-Jimenez and J. A. Okolie, Chem. Eng. J., 2023, 452, 139215 CrossRef CAS.
- I. J. Okeke and T. A. Adams, Energy, 2018, 163, 426–442 CrossRef CAS.
- B. Linnhoff and D. Boland, User Guide on Process Integration for the Efficient Use of Energy, The Institution of Chemical Engineers, Rugby, UK, 1982, DOI:10.1016/0300-9467(83)80027-6.
- A. Mukherjee, J. A. Okolie, C. Niu and A. K. Dalai, Energy Convers. Manage.: X, 2022, 14, 100218 CAS.
- G. Canada, Provincial and Territorial Energy Profiles – Saskatchewan, https://www.cer-rec.gc.ca/en/data-analysis/energy-markets/provincial-territorial-energy-profiles/provincial-territorial-energy-profiles-quebec.html, (accessed 6 July 2022) Search PubMed.
- M. Fernanda Rojas Michaga, S. Michailos, M. Akram, E. Cardozo, K. J. Hughes, D. Ingham and M. Pourkashanian, Energy Convers. Manage., 2022, 255, 115346 CrossRef CAS.
- Government of Saskatchewan, Minimum Wage Will Increase to $13 Per Hour This Year, $15 by 2024|News and Media|, https://www.saskatchewan.ca/government/news-and-media/2022/may/03/saskatchewan-minimum-wage-to-receive-market-adjustment, (accessed 7 July 2022) Search PubMed.
- J. A. Okolie, M. E. Tabat, C. C. Ogbaga, P. U. Okoye, P. Davis and B. Gunes, Chem. Eng. J., 2022, 446, 137234 CrossRef CAS.
- A. Gonzalez-Garay, M. Gonzalez-Miquel and G. Guillen-Gosalbez, ACS Sustainable Chem. Eng., 2017, 5, 5723–5732 CrossRef CAS.
Footnote |
| † Electronic supplementary information (ESI) available. See DOI: https://doi.org/10.1039/d2re00281g |
| This journal is © The Royal Society of Chemistry 2023 |

