 Open Access Article
Making photocatalysts screenable – a milliscale multi-batch screening photoreactor as extension for the modular photoreactor†
Daniel
Kowalczyk
 a,
Gergely
Knorr
b,
Kalina
Peneva
 *b and
Dirk
Ziegenbalg
 *a
*a
aInstitute of Chemical Engineering, Ulm University, Albert-Einstein-Allee 11, 89081 Ulm, Germany. E-mail: dirk.ziegenbalg@uni-ulm.de
bInstitute of Organic Chemistry and Macromolecular Chemistry, Center for Energy and Environmental Chemistry, Jena Center for Soft Matter, University of Jena, Friedrich Schiller University Jena, Lessingstr. 8, 07743 Jena, Germany. E-mail: kalina.peneva@uni-jena.de
First published on 4th September 2023
Abstract
Development and evaluation of new photocatalytic systems requires screening of large parameter spaces. For such investigations, a photonically characterized, simple, and low-cost multi-batch screening photoreactor is presented that enables the screening of up to 49 sealed 4 mL milli batch reactors. The reactor concept is based on theoretical contemplation of the geometrical and optical properties of suited reflector concepts and utilizes basic components of the modular photoreactor introduced recently. Raytracing, radiometry and chemical actinometry were used for the photonic characterization. Applicability of the screening setup under catalytic conditions was evaluated using a benchmark system for photoinduced hydrogen evolution consisting of [Ru(bpy)3](PF6)2 as the photosensitizer, ascorbic acid as a sacrificial agent and Mo3S132− as the catalyst. Extending screening to metal-free organic photosensitizers, bimane compounds are reported as photosensitizers for photoinduced hydrogen evolution in various catalytic systems.
Introduction
In recent years, great efforts have been made to reduce the dependency on fossil fuels by promoting the use of renewable energy sources such as solar and wind power or the use of biomass.1 Despite this, fossil fuels contribution to the global energy production made up around 83% in 2021, which is only around 3% less than in the year 2000.2 To have a major impact, it is necessary to identify the main barriers to the widespread adoption of renewable energy and to develop strategies to overcome them. Certainly, one fundamental hurdle is the fluctuating character of solar- and wind-power, therefore the development of techniques and methods for energy storage become increasingly important with increasing production of power from renewables.3 Light-driven chemical transformations that utilize abundant sunlight are an attractive alternative that can be used for the renewable production and storage of energy that also meet the principles of green chemistry.4,5Light-driven homogeneous and heterogeneous catalysis require a complex interplay between light absorption, charge separation, charge transfer, and catalytic turnover.6,7 Therefore, the identification, evaluation and optimization of suitable light-driven systems and reaction conditions is a particular challenge, which emphasizes the need for suitable screening devices. Comprehensive parameter screening is the foundation for data aggregation and the subsequent development and evaluation of light-driven systems. The required screening devices can be quite expensive and are therefore not extensively accessible in the research community. Thus, the limited availability of affordable screening platforms is a notable impediment to further progress in the field of light-driven catalysis.
In this work, a simple multi-batch screening photoreactor concept is presented. The developed platform fulfills the minimal criteria for sufficient parameter screening of light-driven photocatalytic systems and can be manufactured at reasonable costs.
From screening photoreactors to scaled-up photochemical processes
In recent years, photochemical transformations gained great attention for synthetic organic chemistry.8 Due to technological innovations, essential challenges that hindered the widespread application of photoreactors in the industry namely reproducibility, selectivity, and scalability, can be targeted more efficiently. The scalability challenge arises mainly from the exponential attenuation of light interacting with matter and is the fundamental reason for a lack of photochemical transformations within industry.8 Nevertheless, several successful examples of traditional UV photochemistry employed on the industrial scale exist, such as the production of vitamin D, caprolactam (scale: 160![[thin space (1/6-em)]](https://www.rsc.org/images/entities/char_2009.gif) 000 t a−1) or rose oxide (scale: 60–100 t a−1).9,10 Since the inherent scale-up challenges are similar for both UV- and visible-light-driven reactions, the great potential for industrial application is independent of the used wavelength.11 Research on the photocatalytic and light-driven hydrogen generation, as a route towards clean and renewable energy generation, gains increasing interest. Hydrogen depicts the leading contender for meeting the future fuel needs due to its particularly high energy density compared to other fuels and its carbon neutral footprint.12 Besides the benefits of hydrogen use in the transportation sector, such as reduced emission levels of greenhouse gases, hydrogen plays a fundamental role in chemicals industry for the synthesis of ammonia and petrochemicals.13,14
000 t a−1) or rose oxide (scale: 60–100 t a−1).9,10 Since the inherent scale-up challenges are similar for both UV- and visible-light-driven reactions, the great potential for industrial application is independent of the used wavelength.11 Research on the photocatalytic and light-driven hydrogen generation, as a route towards clean and renewable energy generation, gains increasing interest. Hydrogen depicts the leading contender for meeting the future fuel needs due to its particularly high energy density compared to other fuels and its carbon neutral footprint.12 Besides the benefits of hydrogen use in the transportation sector, such as reduced emission levels of greenhouse gases, hydrogen plays a fundamental role in chemicals industry for the synthesis of ammonia and petrochemicals.13,14
To establish photochemical industrial processes, classically the stages from compound discovery and selection followed by synthesis optimization must be realized.11 On the early stage of compound discovery, suited screening platforms are used. It is particularly beneficial if the design criteria of a screening setup already consider potential effects and limitations that might be important at the later development and scale-up stages. A great example of target-oriented design criteria for screening platforms in general is the miniaturization approach in medicinal chemistry where the overarching goal is not a scaled-up production process, but the “Magic Bullet” that identifies the best molecules as clinical candidates with limited quantities. Thus, a screening device must be both resource-efficient and material-sparing. Using nanoliter robotics, the sample size can therefore be potentially reduced to less than 1 μL.15 This strategy does not directly contribute to scale-up and process development. Potential effects of light attenuation and mass transport effects already occur on the milliliter scale but do not play a significant role on the nanoliter scale. Therefore, the application of the later in a screening device can lead to a misrepresentation of limitations of the performed reaction. In the case of scale-up as overarching goal, the minimal size of a single screening cell should therefore be still representative for the conditions and limitations of the lab scale. This makes the transition between the stages of scaled-up as efficient as possible. For the development of a screening platform that enables the straight-forward linkage of the early stages of process development, the following criteria should be considered:
Control over the radiant intensity and temporal irradiation pattern of a light source is another important factor. Tunable light sources in terms of intensity or wavelength can be powerful tools for the investigation of photocatalytic reactions since temporal changes of the irradiation field can have a tremendous effect on photocatalytic systems, leading to enhanced photosensitizer lifetime in the range of an order of magnitude.32,33 Consequently, irradiation should be considered as screening parameter as well as control parameter from an engineering perspective. LEDs are particularly suitable for these applications because they offer easy-to-use control options and have undergone significant technological advances in recent years.27,34
Modularity of a platform can assure both adaptability and extensibility to meet different and future needs of a user.27 In addition, screening devices should allow work under inert gas atmosphere, and ensure the straightforward quantification of various liquid and gaseous products. Preferably the proposed platform should be compliant with commonly used analytics such as gas chromatography or UV/vis spectroscopy.
Only if the mentioned attributes are fulfilled, a platform for photochemical screening can find wide application beyond a specialized niche. In recent years, many photochemical screening devices have been published, addressing some of the discussed points well.45–52 Nevertheless, none of these presented platforms fulfills all of the mentioned criteria. The modular photoreactor introduced by us recently fulfills the mentioned criteria well and enables the screening of up to 18 sealed 4–8 mL GC-vials used as milli-batch reactors in a multi-batch approach.27 This platform ensures precise control of various LEDs and irradiation under well characterized and documented conditions as well as mixing of the reaction solution using stirring bars. Nevertheless, the screening capacity of the system is relatively low. Therefore, extending the screening space using alternative irradiation concepts is needed to fulfill the demands of accelerated screening.
Multi-batch screening photoreactor concept
Guaranteeing homogeneous irradiation over the irradiated surface of a screening device represents the fundamental requirement for a photochemical screening platform. Since most used light sources cannot ensure spatially uniform irradiation of larger screening areas, techniques and methods such as the utilization of transmissive or reflective light diffusors or the beneficial overlapping of multiple light sources should be applied to ensure irradiation homogeneity. The application of freeform reflectors is one suited concept for engineering irradiance uniformity over relatively large areas.23,53,54 Commercially available materials such as PTFE offer good diffuse reflectivity and are therefore particularly suited as reflector materials.55 In addition, even relatively thin PTFE sheets already assure high and even reflectivity over the UV/vis range (see Fig. S24 ESI†).The aim of the development presented here is to achieve mostly homogeneous irradiation of a reactor surface, while at the same time keeping the reflector design as simple and reproducible as possible. Therefore, the irradiation concept of the proposed photoreactor is based on indirect irradiation of a diffuse reflecting freeform PTFE sheet, using high power LEDs as light sources. The sheet shape is based on a curved reflector shield. The shield curvature was optimized by 3D raytracing simulations. In addition, complementary photonic characterization using radiometry and chemical actinometry was applied. Gained knowledge of the incident radiant distribution was used to balance out remaining radiant inhomogeneities caused by the reflector design. The light sources were controlled with the controller module presented together with the modular photoreactor in combination with an RND Ka3005p lab power supply.27,56,57 A commercially available roller shaker (IKA roller shaker 10 digital) was used as basis for irradiating up to 63 4 mL GC-vials that served as photoreactors at the same time. The solutions in the milli-scale photoreactors were efficiently mixed by applying rotation of the GC-vials along with an ellipsoidal movement of the shaker with up to 80 rpm and were used to study photoreactions with liquid and gaseous products under inert atmosphere through straight forward reaction monitoring by gas chromatography and UV/vis spectroscopy. All reactor components were fixed in position using 3D printed acrylonitrile butadiene styrene (ABS) parts.
Reactor concept
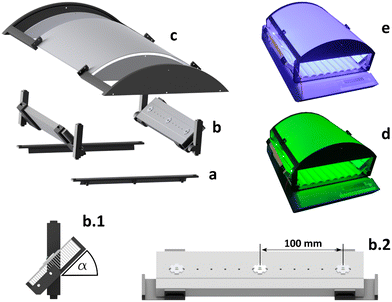
The reactor was designed in a modular fashion to enable simple reproduction, adaptability, and extensibility to enable widespread implementation. Utilizing 3D-printed parts allows relatively cheap manufacturing (ABS filament: 20–35 $ per kg; electricity: 0.009–0.026 $ per h; mass printed parts with 15% infill: 0.505 kg, printing time: ∼42.5 h)58,59 of the reactor components with total estimated costs of around 18.79 $.38,60–62 The proposed multi-batch screening photoreactor consists of three essential module types. All modules include components printed from black ABS by Fused Deposition Modeling (FDM), depicted in Fig. 1, and are available as Open Hardware. It consists of two base modules, that can be fixed to an IKA roller shaker 10 digital using a clipping mechanism (see Fig. 1a). Various LED modules (see Fig. 1b) can be fixed on the base module and a reflector module (Fig. 1c). The LED modules consist of an aluminum heat sink fixed by 3D printed holders. High power LEDs on printed circuit board (PCB) star mounts can be fixed at various positions in 20 mm steps from the edges of the aluminum cooler. For a setup with 3 LEDs per heatsink, a distance of 100 mm was chosen between two adjacent LEDs to avoid the formation of hotspot regions of irradiation caused by extensive overlapping of intensely emitting regions of the LED emission cones based on the manufacturer's characterization data (see Fig. S13 ESI†). The heatsinks are fixed at an angle of α = 45° relative to the roller. Two LED modules are fixed to the base modules. The reflector module consists of a 370 × 360 × 2 mm reflector shield made from virginal PTFE as well as reflecting side walls (wall thickness 3 mm). It is fixed by 3D printed holders and can be clipped on top of the LED modules. The multi-batch screening photoreactor was encased with red Plexiglas and to minimize temperature fluctuations, the case was ventilated by fans that ensured room temperature (air conditioned 20 °C) in the reactor.63,64Influence of mixing
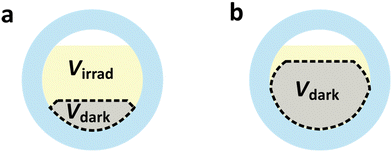
Competitive absorption of light by different reactive and non-reactive species present in a photoreaction can hinder product formation, indicated schematically for an increase of the overall absorption coefficient in Fig. 2a and b. No reaction will occur in the dark volume and if no active mixing is applied, the overall performance will decrease since the mass transport is limited by diffusion. Therefore, the quantification of mixing efficiency can give valuable insights into the properties of the photoreactor. The reversible photoreaction of a spiropyran (1,3,3-trimethylindolino-6′-nitrobenzopyrylospiran) to a merocyanine (4-nitro-2-[(E)-2-(1,3,3-trimethyl-3H-indol-1-ium-2-yl)ethenyl]phenolate) (Fig. 3), depicts a self-shadowing model reaction, since both educt and product absorb light within the UV-region. This reaction is particularly suited for studying the impact of mass transport as the apparent reaction rate correlates with the intensity of mixing.65–67 | ||
| Fig. 3 Reaction scheme of the reversible photoreaction of 1,3,3-trimethylindolino-6′-nitrobenzopyrylospiran (spiropyran) to its merocyanine form (merocyanine). | ||
The influence of mixing in the developed screening photoreactor was investigated using 4 mL GC-vials as milli reactors, filled with 4 mL spiropyran solution under constant LED irradiation for different mixing intensities and spiropyran concentrations. The concentrations were chosen to represent two extreme cases of light penetration depth within the photoreactor.
Since the reaction product merocyanine is highly absorbing in the UV-region, a high local concentration of the products in the irradiated reaction zone leads to competitive absorption of photons by both the spiropyran and merocyanine species and therefore a lower product yield. This effect is more pronounced between the unmixed to the mixed system, the higher the concentration of the absorbing species is. The results of the mixing experiments are shown in Fig. 4. For both examined concentrations an increase in absorbance after an irradiation time of 240 s was observed when active mixing was applied. For the low concentrated case the product absorbance increased from 1.023 to 1.149 (about 12.4% increase) when active mixing was applied. This effect gets even more pronounced for the high concentrated spiropyran solution, for which the merocyanine absorbance increases from 1.414 to 1.744 for the vessels mixed at 80 rpm in comparison to the unmixed vessels (about 23.3% increase). Interestingly, applying gentle mixing at 20 rpm already leads to an increase in absorbance to 1.643 (about 16.2% increase).
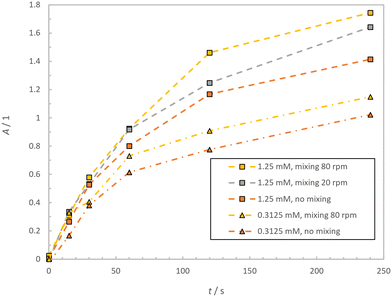 | ||
| Fig. 4 Time dependent merocyanine absorbance A using a 0.3125 mM and a 1.25 mM solution of spiropyran for unmixed and mixed conditions at 20 rpm and 80 rpm. | ||
The experiments show that shadowing effects can play a considerable role in photoreactions already on the low mL scale. Therefore, these effects cannot be neglected, since their influence will be even more decisive in larger photoreactors. Insufficient mixing between irradiated and dark zones can induce physical limitations and therefore slow down reaction rates and consequently decrease the performance of photochemical reaction systems.68 These results also exemplify the importance of the light penetration depth on the performance of a self-shadowing photochemical system and how even low concentrations (<1 mM) of the photoactive absorbing species, as present in very diluted solutions, can cause shadowing. This masking effect will also play an important role when the reactor volume is minimized, since the absolute light path decreases too. Therefore, excessive miniaturization is not desirable for screening devices if the aim of a screening procedure is the development of a scaled-up process.
Radiometric design and evaluation of the irradiation setup
3D raytracing as basis for photoreactor development
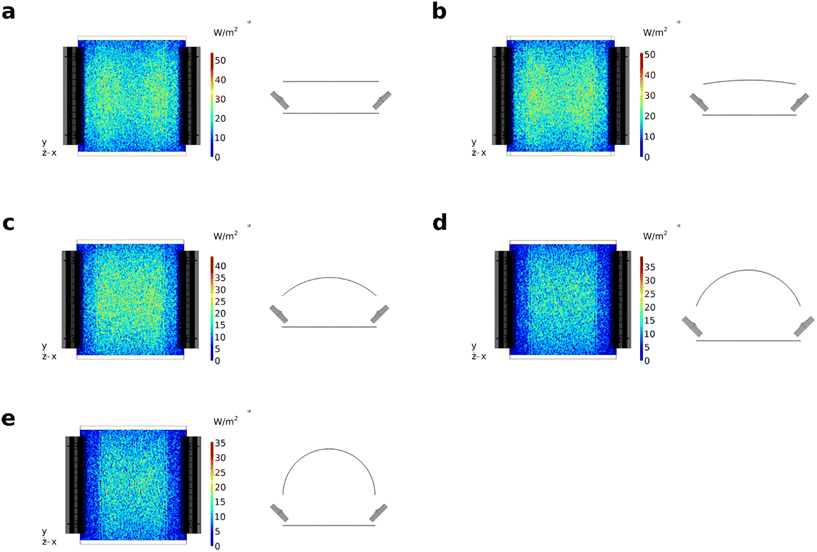
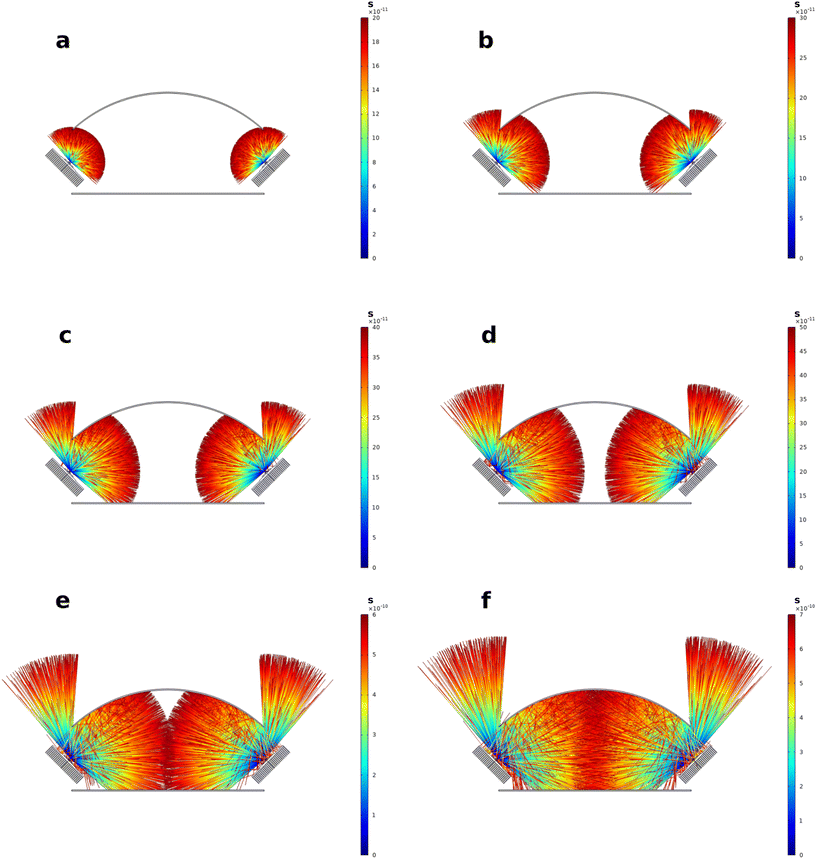
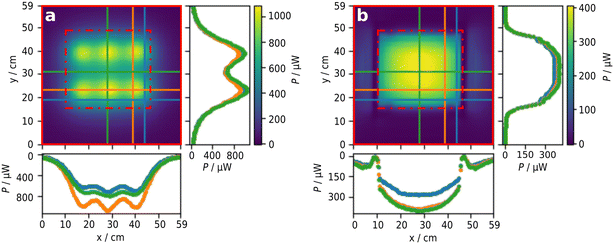
Ray tracing can be used as an effective tool for the evaluation of irradiation conditions.69–74 Different reflector configurations for the multi-batch screening photoreactor were evaluated and optimized by 3D raytracing using the ray optics module of COMSOL Multiphysics (see Fig. 5). A 360 × 370 mm reflector sheet was found to yield the most homogeneous irradiation (see Fig. 5c). The geometry of the curved reflector corresponds to the arc of a circle sector with radius r of 242.365 mm and circle sector angle ϕ of 87.47°. Depictions of the simulated ray trajectories, simulated with 50![[thin space (1/6-em)]](https://www.rsc.org/images/entities/char_2009.gif) 000 rays per LED, are shown in Fig. 6. The simulate ray trajectories indicate two clear drawbacks of the used reactor design. First, the emission cone of the LEDs used in the existing concept cannot be fully aligned with the reflector module, which already leads to some losses of the simulated rays. Secondly, a clear shadowing of the detector area can be observed by the aluminum heat sinks of the LEDs. These effects stem from practical constraints, namely the emission characteristics of the LEDs used and the dimensions of the coolers used of the reactor setup design and are therefore difficult to avoid. For low as well as large amounts of simulated rays no outstanding irradiance inhomogeneities on the detector but shadowed regions close to the heat sinks could be observed (see Fig. 7). From the initial optical power (5.25 W) emitted by the six LEDs, an optical power of around 1.82 W (50 000 rays per LED) and 1.78 W (160 000 rays per LED) were calculated at the detector plane. This corresponds to an efficiency of 34.7% or 33.9% for the high-and low-resolution simulation, respectively. The integral optical powers for the simulations with a low and high number of rays do not differ substantially from each other. Combining ray tracing simulations with lower numbers of rays, that require significantly less computational capacity with a suited mesh software therefore seems to be a valid method for the calculation of integral optical powers on defined detector areas.
000 rays per LED, are shown in Fig. 6. The simulate ray trajectories indicate two clear drawbacks of the used reactor design. First, the emission cone of the LEDs used in the existing concept cannot be fully aligned with the reflector module, which already leads to some losses of the simulated rays. Secondly, a clear shadowing of the detector area can be observed by the aluminum heat sinks of the LEDs. These effects stem from practical constraints, namely the emission characteristics of the LEDs used and the dimensions of the coolers used of the reactor setup design and are therefore difficult to avoid. For low as well as large amounts of simulated rays no outstanding irradiance inhomogeneities on the detector but shadowed regions close to the heat sinks could be observed (see Fig. 7). From the initial optical power (5.25 W) emitted by the six LEDs, an optical power of around 1.82 W (50 000 rays per LED) and 1.78 W (160 000 rays per LED) were calculated at the detector plane. This corresponds to an efficiency of 34.7% or 33.9% for the high-and low-resolution simulation, respectively. The integral optical powers for the simulations with a low and high number of rays do not differ substantially from each other. Combining ray tracing simulations with lower numbers of rays, that require significantly less computational capacity with a suited mesh software therefore seems to be a valid method for the calculation of integral optical powers on defined detector areas.
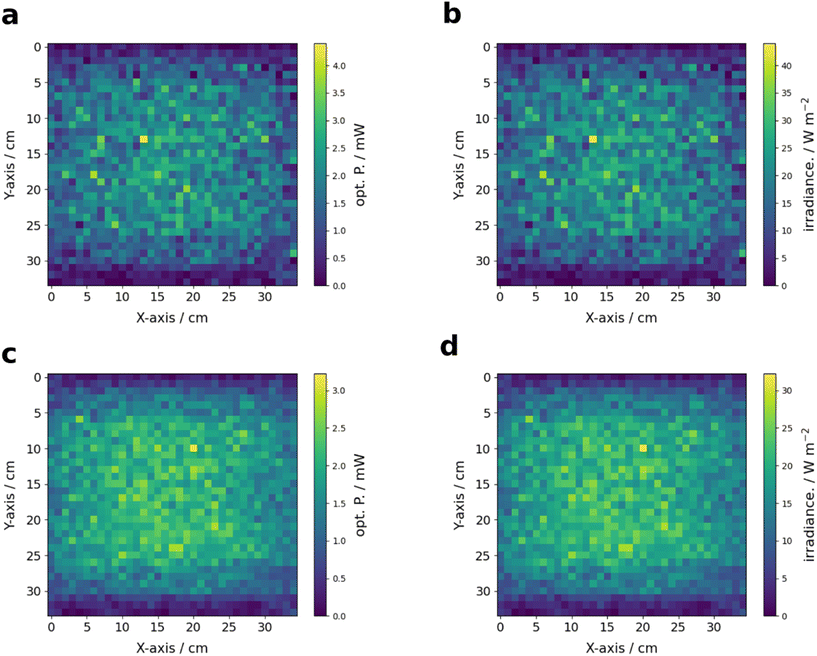 | ||
Fig. 7 Simulated optical power and irradiance determined by 3D raytracing for a total number of 300![[thin space (1/6-em)]](https://www.rsc.org/images/entities/char_2009.gif) 000 rays (a and b) and 960 000 rays (a and b) and 960![[thin space (1/6-em)]](https://www.rsc.org/images/entities/char_2009.gif) 000 rays (c and d). 000 rays (c and d). | ||
Radiometry
Complementary to the theoretical evaluation of the reflector setup, 2D radiometry of the LEDs was performed for direct and indirect irradiation with the reflector setup (see Fig. 8). The radiant power reaching the detector plane when using the reflector module was found to be around 35.8% (1.88 W) of the initial radiant power measured using the LEDs without reflector (5.25 W, see the ESI† for details on the calibration). This aligns well with the radiant powers calculated by the raytracing simulations, corresponding to an absolute deviation of around 3.2% and 5.3%. The irradiation is much more homogeneous on the reactor surface (y: 11–45 cm x: 16–49 cm) with the reflector.Even though that the LEDs for direct irradiation were arranged such that homogeneity of irradiation was increased, distinct intensity hotspots are clearly visible due to conical emission of the LEDs (see Fig. 8 left, S18 and S21 ESI†). The deviations along the x-axis are more pronounced than for the y-axis since three LEDs are used to cover the y-axis but just two LEDs for the x-axis. Significant fractions of the light were detected in regions exceeding the reactor surface. The use of the reflector module resulted in better homogeneity of the optical power along the reactor surface. In addition, the fraction of light not irradiating the reactor surface is smaller as for the pure LEDs. The intensity distribution along the x-axis differs only slightly, even on the outer edge of the reactor surface, while larger deviations were observed along the y-axis towards the outer edge of the reactor surface. This drop results from the shadowing of the reactor surface by the aluminum heatsinks. Consequently, the outer two columns of the IKA roller receive significantly less irradiation than the other columns. In summary, even though irradiation using the reflector is associated with a loss in overall optical power, a significant better homogeneity of irradiation can be achieved with the reflector concept.
Reactive validation of radiation field by actinometry
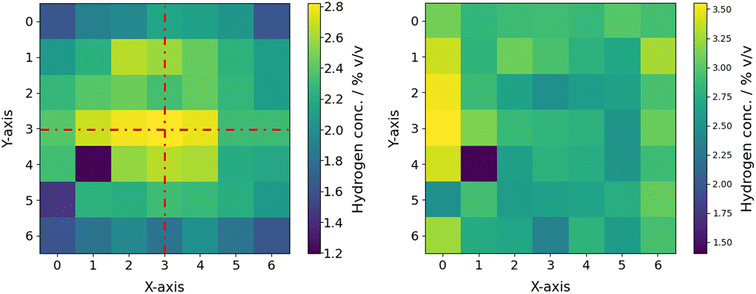
Actinometric measurements of all 63 potentially available positions on the roller shaker were performed using the ferrioxalate actinometer and 365 nm LEDs. Photon fluxes between 14–49 nmol s−1 per vial, corresponding to photonic efficiencies per vial of 0.1–0.3%, were determined. In total, a photon flux of 2140 nmol s−1 (equivalent to 0.701 W for 365 nm) was calculated, corresponding to a total efficiency of 13.25%. With this total photonic efficiency and an emitted optical power of 5.25 W (data sheet) for the six LEDs used, a corresponding optical power of 0.696 W was calculated.75In relation to the radiometrically determined optical power reaching the reactor surface, only 37% of the incident light is absorbed. This can be explained by the given geometrical arrangement of the vials on the reactor surface. Around 54.8% of the bed area is not covered by vials (for more information see Fig. S11 ESI†). In addition, the vials have caps made of black plastic, covering about 22.4% of the area occupied by the vials. Thus, only at around 35.1% of the reactor surface photons can be absorbed. These geometrical considerations lead to an optical power of 0.659 W, aligning very well with the actinometric measurement. In line with the ray tracing and radiometric results, clear shadowing of the two outer vials columns were observed with actinometry (see Fig. 9 left).
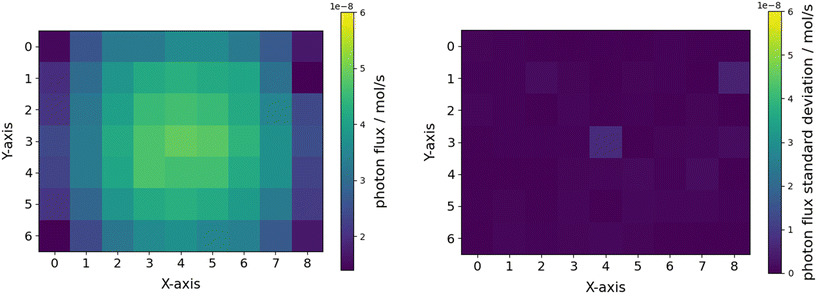 | ||
| Fig. 9 Mean actinometric photon flux received per vial in dependence of the x/y position on the roller shaker bed (left) and corresponding standard deviations (right). | ||
For further studies two screening matrices of 7 × 7 = 49 samples and 5 × 5 = 25 samples were defined (see Fig. S11 ESI†). The actinometry samples of these matrices exhibit standard deviations of 27.5% (49 samples) and 9.9% (25 samples). Therefore, the more sensitive a light-driven system responses to the parameter varied during screening the smaller the screening matrix must be chosen to rule out the impact of the radiation field inhomogeneity. This is primarily necessary when no correction procedure for the intensity inhomogeneities on the reactor surface is applicable. With knowledge of the photon flux at every reactor position, a normalization to the photon flux can be conducted in the photon-limited regime. In this context it is advisable to avoid high radiant intensities during screening to ensure operation in the photon-limited regime.
Screening studies
Utilization of solar light in homogeneous photocatalysis raises challenges, since many redox catalysts rely on photosensitization to enable light-driven redox catalysis.76 Therefore, suited photosensitizers are required for future technical implementation. Triplet photosensitizers depict compounds that can be efficiently excited to the triplet state and enable triplet energy transfer to compounds with small intrinsic triplet state yields. Typical triplet photosensitizers rely on the heavy atom effect and often use noble metals such as Ir, Pt or Ru. The limited absorption of these complexes in the visible region is a major drawback. As an exception, Ru(II)-complexes show moderate absorption of blue light but are expensive.77,78 Organic dyes may be used as cheaper, metal-free and environmentally friendly alternative photosensitizers.79 The development of these substances requires suited screening strategies. Recently, the use of organic dyes as photosensitizers coupled to [Fe2S2]-photocatalysts, noble metals such as Pd and Pt and Mo3S13-clusters for hydrogen evolution was reported.80–83 Despite showing improved absorption properties, the catalytic performance showed room for improvement. Similar conclusions can be drawn for copper of nickel based systems.84,85 This once again demonstrates the need for widely accessible tools suited for sufficient parameter screening within photocatalysis. Consequently, hydrogen evolution photocatalysis was chosen as benchmark application for the multi-batch-screening photoreactor.Initial reproducibility assessments were based on a benchmark reaction system for hydrogen evolution consisting of [Ru(bpy)3](PF6)2 as photosensitizer (PS), ascorbic acid (AA) as sacrificial agent (SA) and (NH4)2[Mo3S13] × 2H2O as catalyst (CAT). A matrix of 7 × 7 reaction samples with the same concentrations of PS, SA and CAT, were screened. The samples were irradiated for 2 h using 455 nm LEDs. Photonic characterization indicated mirroring planes along the x- and y-axis regarding the incident photon flux. Thus, very similar irradiation conditions for samples placed on opposite positions are to be expected (see Fig. 10 left). Therefore, the samples placed on the x/y-positions 0/5 and 1/4 were identified as clear outliers and are not considered for further calculations of the standard deviations. For the 7 × 7 screening matrix, a maximal standard deviation of 19.4% can be calculated for the reactor surface (see Fig. 10 left). For a 5 × 5 screening matrix, centered around the 3/3 position, a significantly lower maximal standard deviation of 9.2% was observed. Assuming that the reaction is operated under photonic limitation, position dependent correction of the hydrogen production can be performed by knowledge of the incident photon flux through linear correlation (see Fig. 10 right). In this case, standard deviations of 15.3% for the 7 × 7 matrix and 6.8% for the 5 × 5 matrix were obtained. Since the standard deviations calculated for the 5 × 5 matrix are very close to experimental errors found for the modular photoreactor, further screening experiments were performed on the 5 × 5 screening matrix.27
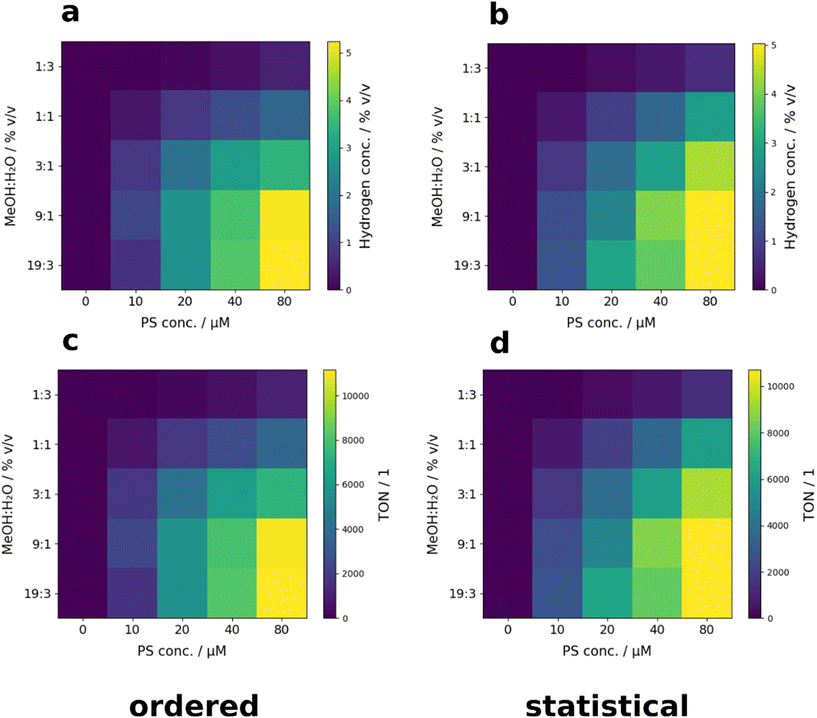
The benchmark reaction system was studied with respect to the influence of the methanol/water (MeOH)/(H2O) ratio (25/75, 50/50, 75/25, 90/10 and 95/5% v/v) and the PS concentrations (0, 10, 20, 40 and 80 μM). The screening results are depicted as heat maps in Fig. 11. The samples were placed on the reactor surface in ordered (Fig. 11 left) and statistical (Fig. 11 right) arrangements (for more information on the sample positioning see Tables S3 and S4 ESI†). Statistical placement of the samples was chosen to counteract systematic errors. Ordered and statistical arrangements led to very similar results, reproducing the literature-reported activity decrease with an increasing water content well.86 Compared to the highest performance of the control experiments performed in the modular reactor, reaching an average turn-over-number (TON) of about 30![[thin space (1/6-em)]](https://www.rsc.org/images/entities/char_2009.gif) 046 (PS = 20 μM; 9
046 (PS = 20 μM; 9![[thin space (1/6-em)]](https://www.rsc.org/images/entities/char_2009.gif) :
:![[thin space (1/6-em)]](https://www.rsc.org/images/entities/char_2009.gif) 1 MeOH/H2O) (see ESI† Fig. S3), the activity of the used catalytic system could be enhanced by a factor of around two from 5754/4853 (PS = 20 μM; 90
1 MeOH/H2O) (see ESI† Fig. S3), the activity of the used catalytic system could be enhanced by a factor of around two from 5754/4853 (PS = 20 μM; 90![[thin space (1/6-em)]](https://www.rsc.org/images/entities/char_2009.gif) :
:![[thin space (1/6-em)]](https://www.rsc.org/images/entities/char_2009.gif) 10 MeOH/H2O; TON ordered/statistical sample arrangement) to 11
10 MeOH/H2O; TON ordered/statistical sample arrangement) to 11![[thin space (1/6-em)]](https://www.rsc.org/images/entities/char_2009.gif) 154/10
154/10![[thin space (1/6-em)]](https://www.rsc.org/images/entities/char_2009.gif) 717 (PS = 80 μM; 95
717 (PS = 80 μM; 95![[thin space (1/6-em)]](https://www.rsc.org/images/entities/char_2009.gif) :
:![[thin space (1/6-em)]](https://www.rsc.org/images/entities/char_2009.gif) 4 MeOH/H2O; TON ordered/statistical sample arrangement) during the screening presented in this work (for more information see ESI† Tables S5 and S6).
4 MeOH/H2O; TON ordered/statistical sample arrangement) during the screening presented in this work (for more information see ESI† Tables S5 and S6).
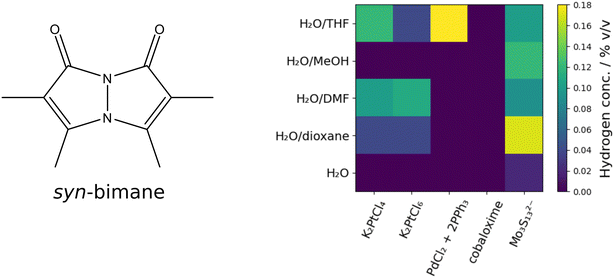
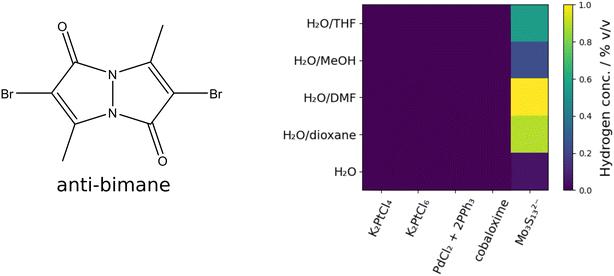
Noble metal free PS can be used as an alternative to expensive noble metal containing PS. Bimane dyes might be utilized as PS for the hydrogen evolution reaction (HER). Therefore, 2D screening using the 5 × 5 screening matrix was used for the bimane-compounds 2,3,5,6-tetramethyl-1H,7H-pyrazolo[1,2-a]pyrazole-1,7-dione (syn-(Me,Me)bimane, syn-bimane), and 2,6-dibromo-3,7-dimethyl-1H,5H-pyrazolo[1,2-a]pyrazole-1,5-dione (anti-(Me,Br)bimane, anti-bimane), both compounds have been described in the literature.87,88 The bimane compounds were chosen to be tested as PS-compounds in a photocatalytic setup not yet reported in literature. Screening was performed with different CATs (K2PtCl4, K2PtCl6, PdCl2 + 2PPh3, chloro(pyridine)cobaloxime and Mo3S132−) and 50/50% v/v mixtures of various solvents H2O/tetrahydrofuran (THF), H2O/MeOH, H2O/dimethylformamide (DMF), H2O/dioxane as well as pure H2O. The samples were irradiated for 12 h using six 455 nm LEDs for the syn-bimane PS under constant mixing at 80 rpm. For the anti-bimane PS, the irradiation modules were changed to six 365 nm LEDs.
Catalytic conditions: [catalyst] = 10 μM; [photosensitizer] = 1 mM; [AA] = 100 mM; solvent = organic solvent/H2O 50/50% v/v, 0/100% v/v.
The results obtained in the screening experiments of syn-bimane are summarized in Table 1 and Fig. 12. Except for the chloro(pyridine)cobaloxime CAT, all screened CATs showed activity at least at one of the screened parameter combinations, corresponding to TONs of 3–8 for K2PtCl4, 3–7 for K2PtCl6, 12 for PdCl2 + 2PPh3 and 1–11 for Mo3S132−.
| Y/X-position | 0 | 1 | 2 | 3 | 4 | |
|---|---|---|---|---|---|---|
| Solvent mixture 50/50% v/v | Metal ions | |||||
| K2PtCl4 | K2PtCl6 | PdCl2 + 2PPh3 | Chloro-(pyridine)-cobaloxime | Mo3S132− | ||
| 0 | H2O/THF | 0.12 | 0.04 | 0.18 | 0 | 0.10 |
| 1 | H2O/MeOH | 0 | 0 | 0 | 0 | 0.12 |
| 2 | H2O/DMF | 0.10 | 0.11 | 0 | 0 | 0.09 |
| 3 | H2O/dioxane | 0.04 | 0.04 | 0 | 0 | 0.17 |
| 4 | H2O | 0 | 0 | 0 | 0 | 0.02 |
| H2 conc./% v/v | ||||||
Results of the anti-bimane screening are depicted in Table 2 and Fig. 13. Activity could exclusively be observed using Mo3S132− as CAT. In contrast to the syn-bimane system, high activities could be observed corresponding to TONs of 3–64. We hypothesize that the higher catalytic efficiency of the anti-bimane could be explained by its high triplet conversion rate, as reported for various triplet PS.77
| Y/X-position | 0 | 1 | 2 | 3 | 4 | |
|---|---|---|---|---|---|---|
| Solvent mixture 50/50% v/v | Metal ions | |||||
| K2PtCl4 | K2PtCl6 | PdCl2 + 2PPh3 | Chloro-(pyridine)-cobaloxime | Mo3S132− | ||
| 0 | H2O/THF | 0 | 0 | 0 | 0 | 0.55 |
| 1 | H2O/MeOH | 0 | 0 | 0 | 0 | 0.24 |
| 2 | H2O/DMF | 0 | 0 | 0 | 0 | 1.00 |
| 3 | H2O/dioxane | 0 | 0 | 0 | 0 | 0.89 |
| 4 | H2O | 0 | 0 | 0 | 0 | 0.05 |
| H2 conc./% v/v | ||||||
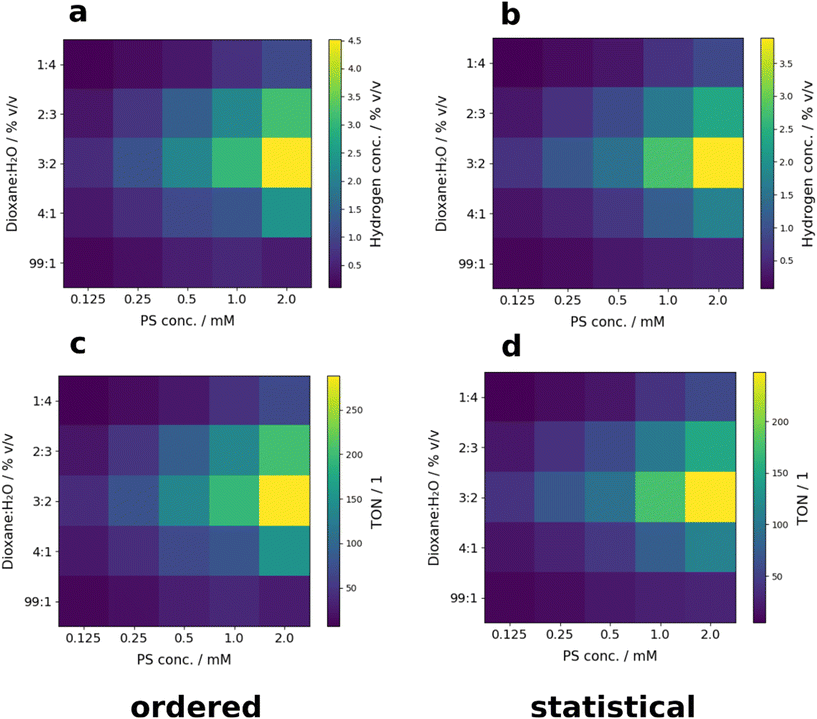
The activity of the anti-bimane as PS was screened for different H2O/dioxane ratios (20/80, 40/60, 60/40, 80/20 and 99/1% v/v) and PS concentrations (0.125, 0.25, 0.5, 1 and 2 mM). Screening was performed both with ordered (see Fig. 14 left) and statistical sample placement (see Fig. 14 right; for more details see Tables S9 and S10 ESI†). Again, no significant difference between ordered and statistical sample placement were observed, indicating that the homogeneity of irradiation on the 5 × 5 matrix is sufficient for 2 parameter screening of the examined catalytic systems. Interestingly, the observed maximum of activity is located at a solvent ratio of 60/40% v/v H2O/dioxane. Therefore, the optimal parameter combination for a given solvent ratio could be identified with a single screening step. Comparing the results of the 2D screening to the initial screening presented in Fig. 13, the corresponding TONs could be improved from around 57 to 288, corresponding to a factor of over 5 (for more information on the TONs see ESI† Tables S11 and S12).
Discussion
The different theoretical and experimental optical characterizations of the developed screening setup could be aligned very well with respect to the overall power reaching the reactor surface and the spatial distribution of the optical power. Mean standard deviations of 27.5% (49 samples) for the 7 × 7 (bed size ≈ 30 × 30 cm2) screening matrix and 9.9% (25 samples) for the 5×5 (bed size ≈ 21.4 × 21.4 cm2) screening matrix were observed for the optical characterization using chemical actinometry. By using the spatial information of the incident photon flux for every screening cell, standard deviations determined for the hydrogen production of the benchmark system [Ru(bpy)3](PF6)2, (NH4)2[Mo3S13] × 2H2O for HER could be reduced form 19.4% for the 7 × 7 screening matrix and 9.2% for the 5 × 5 screening matrix to 15.3% and 6.8%, respectively. For the 5 × 5 screening matrix, the determined standard deviation is similar to the expected experimental error. Since no effect of the sample arrangement on the overall experimental insight was found, it is concluded that the inhomogeneity of the irradiation is sufficiently low for screening studies, even without additional correction for the intensity differences. For the Ru-based benchmark reaction system, 2 parameter screening resulted in an increase of activity by a factor of around 2 in comparison to the data reported in literature. Since maximum activity is located at the corner of the screening matrix, potentially even higher activities could be identified through further screening. After an initial screening of five catalysts, for the screened anti-bimane (PS), Mo3S13 (CAT) reaction system, an optimal water dioxane ratio of 60/40% v/v was identified. Performing only two experiments, an increase of the activity by a factor of more than 5 was observed for the optimized screening parameters compared to the initial reaction conditions.Conclusions
A multi-batch screening photoreactor concept was developed and photonically characterized by combining the complementary theoretical and experimental techniques of ray tracing, 2D radiometry and chemical actinometry. A diffuse reflecting freeform PTFE shield was found to provide an acceptable homogeneous irradiation for relatively large reactor surfaces even with a small number of commercially available LEDs. The proposed device can be applied for both general and specific 2 parameter screening of light-driven reactions. The ability of active mixing using a roller shaker mixer makes the proposed screening platform applicable for both homogeneous and heterogeneous systems. Control of the irradiation modules can be realized by both laboratory DC power supplies or the controller of the modular photoreactor presented previously.27 The simplicity of the proposed concept together with sufficient and openly accessible documentation of the screening device ensure high compliance with the demands of experimentalists in photochemical laboratories. Thus, it is expected that the proposed setup contributes to increase accessibility of screening devices for photochemistry and help to bridge the gap between compound discovery, parameter optimization and process development. All information of the proposed setup can be found in the git repository of the modular photoreactor, characterization and catalytic data is deposited in Zenodo.56,57,89Experimental section
Photonic characterization
The subsequent reaction of spiropyran to merocyanine was performed at room temperature using the reflector photoreactor under constant mixing at 80 rpm. The reaction was performed using six 365 nm LEDs operated at a constant current of 500 mA. The samples were irradiated for 30 s, 60 s, 120 s and 240 s at room temperature with and without mixing. The change of absorbance was monitored using UV/vis spectroscopy at 590 nm in the same 4 mL GC-vials (d = 12.8 mm) used for the photoreaction (for detailed information see Fig. S2 ESI†).
Experiments were carried out in 4 mL LABSOLUTE 7613421 clear glass screw neck vials (ND13) with 2 mL of catalysis solution at pH 4. Catalysis was performed for 12 h at room temperature with active mixing at 80 rpm. The samples were ventilated using two fans mounted at the reactor shield (see Fig. S1 ESI†). Irradiation was performed using either six 455 nm LEDs operated at an electrical current of 1 A or six 365 nm LEDs operated at a current of 1 A. Evolved hydrogen was quantified using head space gas chromatography analysis. Turnover numbers were calculated from the number of hydrogen molecules produced per molecule CAT.
List of acronyms
| AA | Ascorbic acid |
| ABS | Acrylonitrile butadiene styrene |
| anti-Bimane | 2,6-Dibromo-3,7-dimethyl-1H,5H-pyrazolo[1,2-a]pyrazole-1,5-dione |
| CAT | Catalyst |
| DMF | Dimethylformamide |
| FAIR | Findable accessible interoperable reusable |
| FDM | Fused deposition modeling |
| GC | Gas chromatography |
| HER | Hydrogen evolution reaction |
| LED | Light emitting diode |
| Merocyanine | 4-Nitro-2-[(E)-2-(1,3,3-trimethyl-3H-indol-1-ium-2-yl)ethenyl]phenolate |
| PCB | Printed circuit board |
| PS | Photosensitizer |
| PTFE | Polytetrafluoroethylene |
| SA | Sacrificial agent |
| Spiropyran | 1,3,3-Trimethylindolino-6′-nitrobenzopyrylospiran |
| syn-Bimane | 2,3,5,6-Tetramethyl-1H,7H-pyrazolo[1,2-a]pyrazole-1,7-dione |
| THF | Tetrahydrofuran |
| TON | Turnover number |
| UV/vis | Ultraviolet/visible |
Author contributions
The authors contributions are listed in a according to the CRediT system as follows. D. Kowalczyk: conceptualization (lead), data curation (lead), formal analysis (lead), investigation (lead), project administration (equal), validation (lead), visualization (lead), draft (lead), writing-review and editing (lead). G. Knorr: data curation (supporting), formal analysis (supporting), investigation (supporting), validation (supporting), visualization (supporting), writing – review and editing (supporting). D. Ziegenbalg: conceptualization (supporting), acquisition (equal), methodology (supporting), project administration (equal), resources (equal), supervision (equal), validation (supporting), funding acquisition (equal), writing – review and editing (supporting). K. Peneva: acquisition (equal), methodology (supporting), project administration (equal), resources (equal), supervision (equal), validation (supporting), funding acquisition (equal), writing – review and editing (supporting). The conceptualization, simulation, manufacturing, and photonic characterization of the multi batch screening photoreactor was carried out at the Institute of Chemical Engineering at Ulm University. Screening studies were performed at the Institute of Organic Chemistry and Macromolecular Chemistry at the University of Jena.Conflicts of interest
There are no conflicts to declare.Acknowledgements
Development, photonic characterization, and evaluation of the photoreactor concept and the performed parameter studies under catalytic conditions including the synthesis of the used compounds was funded by the Deutsche Forschungsgemeinschaft DFG as part of the collaborative research center TRR234 “CataLight” (364549901), project A3 and C6. The authors acknowledge support from the state of Baden-Württemberg through bwHPC and the German Research Foundation (DFG) through grant no. INST 40/575-1 FUGG (JUSTUS2 cluster). The authors thank Konrad Hotzel for his experimental support.References
- A. Qazi, F. Hussain, N. A. B. D. Rahim, G. Hardaker, D. Alghazzawi, K. Shaban and K. Haruna, IEEE Access, 2019, 7, 63837–63851 Search PubMed.
- H. Ritchie, M. Roser and P. Rosado, Our World Data, 2022 Search PubMed.
- A. G. Olabi, Energy, 2017, 136, 1–6 CrossRef.
- S. L. Y. Tang, R. L. Smith and M. Poliakoff, Green Chem., 2005, 7, 761–762 RSC.
- R. A. Sheldon, Chem. Soc. Rev., 2012, 41, 1437–1451 RSC.
- D. Ziegenbalg, A. Pannwitz, S. Rau, B. Dietzek-Ivanšić and C. Streb, Angew. Chem., Int. Ed., 2022, e202114106 CAS.
- H. E. Bonfield, T. Knauber, F. Lévesque, E. G. Moschetta, F. Susanne and L. J. Edwards, Nat. Commun., 2020, 11, 804 CrossRef CAS PubMed.
- L. Buglioni, F. Raymenants, A. Slattery, S. D. A. Zondag and T. Noël, Chem. Rev., 2022, 122(2), 2752–2906 CrossRef CAS PubMed.
- M. Fischer, Angew. Chem., Int. Ed. Engl., 1978, 17, 16–26 CrossRef.
- N. Monnerie and J. Ortner, J. Sol. Energy Eng., 2001, 123, 171–174 CrossRef CAS.
- L. Candish, K. D. Collins, G. C. Cook, J. J. Douglas, A. Gómez-Suárez, A. Jolit and S. Keess, Chem. Rev., 2022, 122(2), 2907–2980 CrossRef CAS PubMed.
- K. Maeda and K. Domen, J. Phys. Chem. Lett., 2010, 1(18), 2655–2661 CrossRef CAS.
- B. L. Salvi and K. A. Subramanian, Renewable Sustainable Energy Rev., 2015, 51, 1132–1155 CrossRef CAS.
- N. Rambhujun, M. S. Salman, T. Wang, C. Pratthana, P. Sapkota, M. Costalin, Q. Lai and K. F. Aguey-Zinsou, MRS Energy Sustain., 2020, 7, 33 CrossRef.
- S. W. Krska, D. A. DiRocco, S. D. Dreher and M. Shevlin, Acc. Chem. Res., 2017, 50, 2976–2985 CrossRef CAS PubMed.
- M. Sender and D. Ziegenbalg, Chem. Ing. Tech., 2017, 89, 1159–1173 CrossRef CAS.
- J. Chen, S. Loeb and J. H. Kim, Environ. Sci.: Water Res. Technol., 2017, 3, 188–202 RSC.
- P. Fredes, U. Raff, E. Gramsch and M. Tarkowski, J. Res. Natl. Inst. Stand. Technol., 2021, 126, 1–25 CrossRef.
- J. Tan, K. Yang, M. Xia and Y. Yang, Opt. Appl., 2011, 41, 507–517 Search PubMed.
- C. D'Alessandro, D. De Maio, T. Mundo, M. Musto, F. Di Giamberardino, M. Monti, D. Dalena, V. G. Palmieri, D. De Luca, E. Di Gennaro and R. Russo, Sol. Energy, 2021, 221, 140–147 CrossRef.
- A. J. W. Whang, S. M. Chao, C. N. Chen, Y. Y. Chen, H. C. Hsiao and X. D. Hu, Opt. Rev., 2011, 18, 218–223 CrossRef.
- R. Wu, H. Wang, P. Liu, Y. Zhang, Z. Zheng, H. Li and X. Liu, Opt. Commun., 2013, 300, 100–107 CrossRef CAS.
- E. Chen and R. Wu, Opt. Eng., 2015, 54, 065103 CrossRef.
- N. H. Vu, T. T. Pham and S. Shin, Energies, 2017, 10(12), 2091 CrossRef.
- J. Zeng, X. Li and P. Ge, Opt. Appl., 2018, 48, 413–420 Search PubMed.
- M. Sender, B. Wriedt and D. Ziegenbalg, React. Chem. Eng., 2021, 6, 1601–1613 RSC.
- D. Kowalczyk, P. Li, A. Abbas, J. Eichhorn, P. Buday, M. Heiland, A. Pannwitz, F. H. Schacher, W. Weigand, C. Streb and D. Ziegenbalg, ChemPhotoChem, 2022, 6(7), e202200044 CrossRef CAS.
- B. Wriedt, D. Kowalczyk and D. Ziegenbalg, ChemPhotoChem, 2018, 2, 913–921 CrossRef CAS.
- B. Wriedt and D. Ziegenbalg, J. Flow Chem., 2020, 10, 295–306 CrossRef.
- B. Wriedt and D. Ziegenbalg, ChemPhotoChem, 2021, cptc.202100122 Search PubMed.
- M. Sender and D. Ziegenbalg, React. Chem. Eng., 2021, 6, 1614–1627 RSC.
- M. Sender, F. L. Huber, M. C. G. Moersch, D. Kowalczyk, J. Hniopek, S. Klingler, M. Schmitt, S. Kaufhold, K. Siewerth, J. Popp, B. Mizaikoff, D. Ziegenbalg and S. Rau, ChemSusChem, 2022, 15(12), e202200708 CrossRef CAS PubMed.
- J. J. Devery, J. J. Douglas, J. D. Nguyen, K. P. Cole, R. A. Flowers and C. R. J. Stephenson, Chem. Sci., 2015, 6, 537–541 RSC.
- G. Di, Z. Zhu, Q. Dai, H. Zhang, X. Shen, Y. Qiu, Y. Huang, J. Yu, D. Yin and S. Küppers, Chem. Eng. J., 2020, 379, 122296 CrossRef CAS.
- D. Friedmann, A. Hakki, H. Kim, W. Choi and D. Bahnemann, Green Chem., 2016, 18, 5391–5411 RSC.
- D. Heggo and S. Ookawara, Chem. Eng. Sci., 2017, 169, 67–77 CrossRef CAS.
- D. Ziegenbalg and F. Guba, Curr. Opin. Chem. Eng., 2022, 36, 100789 CrossRef.
- F. Guba, Ü. Tastan, K. Gugeler, M. Buntrock, T. Rommel and D. Ziegenbalg, Chem. Ing. Tech., 2019, 91, 17–29 CAS.
- O. Dmitrenko, T. Orlova and I. Terenetskaya, J. Mol. Liq., 2018, 267, 428–435 CrossRef CAS.
- G. Boulton, M. Rawlins, P. Vallance and M. Walport, Lancet, 2011, 377, 1633–1635 CrossRef PubMed.
- B. A. Nosek, Science., 2015, 348, 1422–1425 CrossRef CAS PubMed.
- J. C. Molloy, PLoS Biol., 2011, 9, 1–4 CrossRef PubMed.
- M. D. Wilkinson, M. Dumontier, I. J. Aalbersberg, G. Appleton, M. Axton, A. Baak, N. Blomberg, J.-W. Boiten, L. B. da Silva Santos, P. E. Bourne, J. Bouwman, A. J. Brookes, T. Clark, M. Crosas, I. Dillo, O. Dumon, S. Edmunds, C. T. Evelo, R. Finkers, A. Gonzalez-Beltran, A. J. G. Gray, P. Groth, C. Goble, J. S. Grethe, J. Heringa, P. A. 't Hoen, R. Hooft, T. Kuhn, R. Kok, J. Kok, S. J. Lusher, M. E. Martone, A. Mons, A. L. Packer, B. Persson, P. Rocca-Serra, M. Roos, R. van Schaik, S.-A. Sansone, E. Schultes, T. Sengstag, T. Slater, G. Strawn, M. A. Swertz, M. Thompson, J. van der Lei, E. van Mulligen, J. Velterop, A. Waagmeester, P. Wittenburg, K. Wolstencroft, J. Zhao and B. Mons, Sci. Data, 2016, 3(1), 160018 CrossRef PubMed.
- V. Gewin, Nature, 2016, 529, 117–119 CrossRef PubMed.
- N. Qi, M. K. Wismer, D. V. Conway, S. W. Krska, S. D. Dreher and S. Lin, React. Chem. Eng., 2022, 7, 354–360 RSC.
- M. Sezen-Edmonds, J. E. Tabora, B. M. Cohen, S. Zaretsky, E. M. Simmons, T. C. Sherwood and A. Ramirez, Org. Process Res. Dev., 2020, 24, 2128–2138 CrossRef CAS.
- Y. Bai, L. Wilbraham, B. J. Slater, M. A. Zwijnenburg, R. S. Sprick and A. I. Cooper, J. Am. Chem. Soc., 2019, 141, 9063–9071 CrossRef CAS PubMed.
- D. McDowall, B. J. Greeves, R. Clowes, K. McAulay, A. M. Fuentes-Caparrós, L. Thomson, N. Khunti, N. Cowieson, M. C. Nolan, M. Wallace, A. I. Cooper, E. R. Draper, A. J. Cowan and D. J. Adams, Adv. Energy Mater., 2020, 10, 1–10 Search PubMed.
- E. M. Lopato, E. A. Eikey, Z. C. Simon, S. Back, K. Tran, J. Lewis, J. F. Kowalewski, S. Yazdi, J. R. Kitchin, Z. W. Ulissi, J. E. Millstone and S. Bernhard, ACS Catal., 2020, 10, 4244–4252 CrossRef CAS.
- R. N. Motz, E. M. Lopato, T. U. Connell and S. Bernhard, Inorg. Chem., 2021, 60, 774–781 CrossRef CAS PubMed.
- C. K. Winkler, S. Simić, V. Jurkaš, S. Bierbaumer, L. Schmermund, S. Poschenrieder, S. A. Berger, E. Kulterer, R. Kourist and W. Kroutil, ChemPhotoChem, 2021, 5, 957–965 CrossRef CAS.
- N. B. Bissonnette, K. A. Ryu, T. Reyes-Robles, S. Wilhelm, J. H. Tomlinson, K. A. Crotty, E. C. Hett, L. R. Roberts, D. J. Hazuda, M. Jared Willis, R. C. Oslund and O. O. Fadeyi, ChemBioChem, 2020, 21, 3555–3562 CrossRef CAS PubMed.
- Y. Ding, P. F. Gu and Z. R. Zheng, Jpn. J. Appl. Phys., Part 1, 2007, 46, 7771–7773 CrossRef CAS.
- F. R. Fournier, W. J. Cassarly and J. P. Rolland, Conference proceedings: Nonimaging Optics: Efficient Design for Illumination and Solar Concentration VI, Proc. of SPIE, ed. R. Winston and J. M. Gordon, 2009, vol. 7423, p. 742302 Search PubMed.
- M. Janecek and W. W. Moses, IEEE Trans. Nucl. Sci., 2008, 55, 2432–2437 CAS.
- D. Kowalczyk and D. Ziegenbalg, Characterization data of the modular photoreactor, 2021, DOI:10.5281/zenodo.5615742.
- D. Kowalczyk and D. Ziegenbalg, “Py4ModPhotoreactor”, 2023, DOI:10.5281/zenodo.8149227, https://github.com/photonZfeed/Py4ModPhotoreactor.
- USA electricity prices, https://www.globalpetrolprices.com/USA/electricity_prices/, 2022 Search PubMed.
- T. Bardwell, How Much Electricity Does A 3D Printer Use? [EXPLAINED], https://www.3dsourced.com/guides/how-much-electricity-does-a-3d-printer-use/, 2023 Search PubMed.
- N. Jones, Nature, 2012, 487, 22–23 CrossRef CAS PubMed.
- M. D. Symes, P. J. Kitson, J. Yan, C. J. Richmond, G. J. T. Cooper, R. W. Bowman, T. Vilbrandt and L. Cronin, Nat. Chem., 2012, 4, 349–354 CrossRef CAS PubMed.
- S. Rossi, A. Puglisi and M. Benaglia, ChemCatChem, 2018, 10, 1512–1525 CrossRef CAS.
- T. D. Svejstrup, A. Chatterjee, D. Schekin, T. Wagner, J. Zach, M. J. Johansson, G. Bergonzini and B. König, ChemPhotoChem, 2021, 5, 808–814 CrossRef CAS.
- P. Piacentini, J. M. Fordham, E. Serrano, L. Hepp and M. Santagostino, Org. Process Res. Dev., 2023, 27, 798–810 CrossRef CAS.
- Y. H. Ernst Fischer, J. Chem. Soc., 1952, 4522–4524 Search PubMed.
- L. Kortekaas and W. R. Browne, Chem. Soc. Rev., 2019, 48, 3406–3424 RSC.
- R. Klajn, Chem. Soc. Rev., 2014, 43, 148–184 RSC.
- K. Loubière, M. Oelgemöller, T. Aillet, O. Dechy-Cabaret and L. Prat, Chem. Eng. Process.: Process Intensif., 2016, 104, 120–132 CrossRef.
- S. M. Rodríguez, J. B. Gálvez, M. I. M. Rubio, P. F. Ibáñez, D. A. Padilla, M. C. Pereira, J. F. Mendes and J. C. De Oliveira, Sol. Energy, 2004, 77, 513–524 CrossRef.
- J. Colina-Márquez, F. Machuca-Martínez and G. Li Puma, Environ. Sci. Technol., 2009, 43, 8953–8960 CrossRef PubMed.
- H. L. Otálvaro-Marín, M. A. Mueses, J. C. Crittenden and F. Machuca-Martinez, Chem. Eng. J., 2017, 315, 283–295 CrossRef.
- D. Cambié, F. Zhao, V. Hessel, M. G. Debije and T. Noël, React. Chem. Eng., 2017, 2, 561–566 RSC.
- D. A. Miaomiao Hou and J. Pantelic, Indoor Air, 2021, 1625–1638 Search PubMed.
- Y. M. Ahmed, M. Jongewaard, M. Li and E. R. Blatchley, Environ. Sci. Technol., 2018, 52, 4738–4745 CrossRef CAS PubMed.
- Inc., Luminus Devices SST-10-UV Product Datasheet, 2018.
- P. Du, K. Knowles and R. Eisenberg, J. Am. Chem. Soc., 2008, 130, 12576–12577 CrossRef CAS PubMed.
- J. Zhao, W. Wu, J. Sun and S. Guo, Chem. Soc. Rev., 2013, 42, 5323–5351 RSC.
- K. I. J. Matthey, “Monthly development of the price of selected precious metals from January 2019 to June 2022”, https://www.statista.com/statistics/1237905/comparison-precious-metals-price-growth/, 2022.
- C. F. Leung and T. C. Lau, Energy Fuels, 2021, 35, 18888–18899 CrossRef CAS.
- G. Knorr, D. Costabel, A. Skabeev, C. Neumann, J. Brossette, S. Kupfer, A. Turchanin, W. Weigand and K. Peneva, Dyes Pigm., 2022, 198, 109940 CrossRef CAS.
- D. Costabel, A. Skabeev, A. Nabiyan, Y. Luo, J. B. Max, A. Rajagopal, D. Kowalczyk, B. Dietzek, M. Wächtler, H. Görls, D. Ziegenbalg, Y. Zagranyarski, C. Streb, F. H. Schacher and K. Peneva, Chem. – Eur. J., 2021, 27, 4081–4088 CrossRef CAS PubMed.
- D. Costabel, A. Nabiyan, A. Chettri, F. Jacobi, M. Heiland, J. Guthmuller, S. Kupfer, M. Wächtler, B. Dietzek-Ivanšić, C. Streb, F. H. Schacher and K. Peneva, ACS Appl. Mater. Interfaces, 2022, 15(17), 20833–20842 CrossRef PubMed.
- D. Costabel, R. De, F. Jacobi, J. Eichhorn, K. Hotzel, A. Nabiyan, C. Neumann, A. Turchanin, S. Kupfer, F. H. Schacher, S. Rau, B. Dietzek-Ivanšić and K. Peneva, ACS Catal., 2023, 7159–7169 CrossRef CAS.
- S.-P. Luo, E. Mejia, A. Friedrich, A. Pazidis, H. Junge, A.-E. Surkus, R. Jackstell, S. Denurra, S. Gladiali, S. Lochbrunner and M. Beller, Angew. Chem., 2013, 125(1), 437–441 CrossRef.
- H. H. Cui, J. Y. Wang, M. Q. Hu, C. B. Ma, H. M. Wen, X. W. Song and C. N. Chen, Dalton Trans., 2013, 42, 8684–8691 RSC.
- M. Dave, A. Rajagopal, M. Damm-Ruttensperger, B. Schwarz, F. Nägele, L. Daccache, D. Fantauzzi, T. Jacob and C. Streb, Sustainable Energy Fuels, 2018, 2, 1020–1026 RSC.
- E. M. Kosower, H. Kanety and H. Dodiuk, J. Photochem., 1983, 21, 171–182 CrossRef CAS.
- B. P. Edward and M. Kosower, J. Am. Chem. Soc., 1980, 102, 4983–4993 CrossRef.
- D. Kowalcyzk and D. Ziegenbalg, Characterization Data of the Multi-Batch Screening Photoreactor, 2023, DOI:10.5281/zenodo.8169158.
- M. Sender, B. Wriedt and D. Ziegenbalg, React. Chem. Eng., 2021, 6(9), 1601–1613 RSC.
Footnote |
| † Electronic supplementary information (ESI) available. See DOI: https://doi.org/10.1039/d3re00398a |
| This journal is © The Royal Society of Chemistry 2023 |

