 Open Access Article
Interface catalytic regulation via electron rearrangement and hydroxyl radicals triggered by oxygen vacancies and heavy metal ions†
Xiang-Yu
Xiao
ab,
Zong-Yin
Song
ab,
Chong-Chong
Zhang
c,
Yong-Huan
Zhao
ab,
Zhi-Wei
Gao
ab,
Shi-Hua
Chen
a,
Pei-Hua
Li
a,
Yu-Feng
Sun
c,
Meng
Yang
*a and
Xing-Jiu
Huang
 *ab
*ab
aKey Laboratory of Environmental Optics and Technology, Environmental Materials and Pollution Control Laboratory, Institute of Solid State Physics, HFIPS, Chinese Academy of Sciences, Hefei 230031, P. R. China. E-mail: myang@iim.ac.cn; xingjiuhuang@iim.ac.cn
bDepartment of Materials Science and Engineering, University of Science and Technology of China, Hefei 230026, P. R. China
cCollege of Mechanical and Automotive Engineering, Anhui Polytechnic University, Wuhu, Anhui 241000, PR China
First published on 17th February 2023
Abstract
Although the enhanced intrinsic activities of some nano-metal oxides are obtained by manufacturing oxygen vacancies (OVs), the effect of multiple roles of OVs is ambiguous. Herein, an interface catalytic regulation via electron rearrangement and hydroxyl radicals (˙OH) was proposed with the designed ZrO2 hollow sphere rich in OVs (Vo-rich ZrO2). Surprisingly, it was shown that the catalytic ability of Vo-rich ZrO2 was 9.9 times higher than that of ZrO2 with little OVs in electrochemical catalytic reduction of Pb(II). It was found that the generation of Zr2+ and Zr3+ caused by OVs results in the rearrangement of abundant free electrons to facilitate the catalytic reaction rates. The longer bond length between Vo-rich ZrO2 and reactants, and the lower adsorption energy are beneficial for reactants to desorb, improving the conversion rates. Besides, the produced ˙OH were captured which were induced by OVs and trace divalent heavy metal ions in in situ electron paramagnetic resonance (EPR) experiments, contributing to lowering the energy barriers. This study not only revealed the enhanced interface catalytic effect of electron rearrangement and generated ˙OH triggered by OVs, but also provided unique insights into interface catalytic regulation on nano-metal oxides simulated by OVs.
1 Introduction
Nano-metal oxide catalysts offering intriguing properties and stability, and low price are the subject of intense investigation, particularly in the energy and environment-related catalysis field.1–4 However, some nano-metal oxides, like TiO2, CeO2, and ZrO2, suffer from poor catalytic efficiency due to their low electron transfer rates and limited active sites, greatly restricting their application.5–8 To this end, manufacturing oxygen vacancies (OVs) on them is a simple and convenient way to enhance their intrinsic catalytic properties, which aroused tremendous interest.9–11 For example, Pei et al.12 used TiO2, which possesses low conductivity and poor reactivity, to fabricate reductive TiO2−x nanocrystals by self-doping with abundant OVs and achieve excellent catalytic activity in the oxygen reduction reaction (ORR). Sun et al.6 reported that CeO2 with rich OVs exhibited excellent conductivity and adsorption capacity, leading to satisfactory catalytic performance in the electrochemical reduction reaction.It has been reported that the created OVs could play a significant role in catalysis. For instance, OVs serve as active sites for chemically absorbing the reactants, improving the number of reactants. Also, OVs could capture surrounding electrons to interact with intermediates with strong affinity and transfer electrons to them, boosting the redox reaction rates. Besides, the introduction of OVs changes the chemical environment and electronic structure of nano-metal oxides, modulating the band structure.13 However, the detailed interface catalytic mechanisms between the oxygen-defective nano-metal oxides and reactants induced by OVs were still unclear and insufficient. Therefore, taking advantage of OVs for interface catalytic regulation and revealing their roles in catalytic reactions are necessary and important.
What's more, it has been reported that OVs are beneficial for the generation of some reactive oxygen species (ROS), and the participation of these ROS in the catalytic process remarkably improved the catalytic efficiency.14 For example, Lyu et al. found that O2 could be directly activated into singlet oxygen (1O2) or superoxide radicals (˙O2−) spontaneously on TiO2−x, exhibiting excellent performance in dye degradation, ORR, and cell viability.15 Yuan et al.16 presented BiO2−x nanosheets rich in OVs to modulate ROS, catalyzing the production of ˙O2− and ·OH in cancer cells. Also, it was found that OVs are well suited to ROS catalytic kinetics. Li et al.17 found that the fabricated OVs on the surface of BiOCl are conducive to the formation of ˙O2−, achieving complete visible light NO oxidation with excellent efficiency. However, the research on ROS induced by OVs participating in catalytic reactions is mainly focused on biocatalysis, photocatalysis, etc. Relevant studies on electrocatalysts are few, although there is a great possibility that ROS would be produced and exist during the process.18
As a p-type semiconductor with a wide band gap (about 5 eV), the low catalytic activity of ZrO2 in the electrochemical process has been reported.19,20 Also, it can be used as a raw material for ceramic glaze because of its strong chemical inertness, improving the chemical stability, and acid and alkali resistance of glaze.21,22 Therefore, fabricating OVs in ZrO2 also has a great possibility for improving its intrinsic properties, broadening its application as a catalyst. Besides, ZrO2 is a kind of transition metal oxide with variable valence states of metal elements, which is quite similar to the above-mentioned TiO2 and CeO2. However, the introduction of OVs induces the generation of Ti3+ and Ce3+ in TiO2 and CeO2, respectively, participating in the catalytic reaction; while not only Zr3+ but also Zr2+ would be probably produced in oxygen-defective ZrO2, which is worth exploring. What's more, the possible generated ROS should also be studied during the electrochemical catalytic experiments.
In this work, ZrO2 nanomaterials with mesoporous hollow sphere structures were fabricated, and different oxygen vacancy concentrations in the pristine ZrO2 were modulated through calcining them in an oxidizing or reducing gas environment at high temperature, denoted as Vo-poor ZrO2 and Vo-rich ZrO2. The difference in oxygen vacancy concentrations among these ZrO2 nanomaterials was confirmed by electron paramagnetic resonance (EPR), X-ray photoelectron spectroscopy (XPS), and extended X-ray absorption fine structure (EXAFS). Besides, the effect of electron rearrangement induced by the abundant OVs is also verified to promote the catalytic reaction. To investigate the relationship between the catalytic ability of ZrO2 materials and their oxygen vacancy concentrations, electrochemical reduction experiments were implemented. Surprisingly, the ZrO2 possessing the highest concentration of OVs (Vo-rich ZrO2) exhibited superior catalytic capacity. During electrochemical catalytic reduction of Pb(II), the current density of 1.0 μM Pb(II) signals with Vo-rich ZrO2 is nearly 10 times higher than that of ZrO2 with the lowest oxygen vacancy concentrations (Vo-poor ZrO2). At the same time, in situ EPR spectra and DFT calculations were employed to prove the generation of ·OH triggered by OVs and trace divalent heavy metal ions, such as Pb(II), boosting the catalytic efficiency. Moreover, the multiple roles of OVs in interface catalytic regulation for enhanced catalytic capacity of Vo-rich ZrO2 were also explored.
2 Results and discussion
2.1 Structural and surface characterization
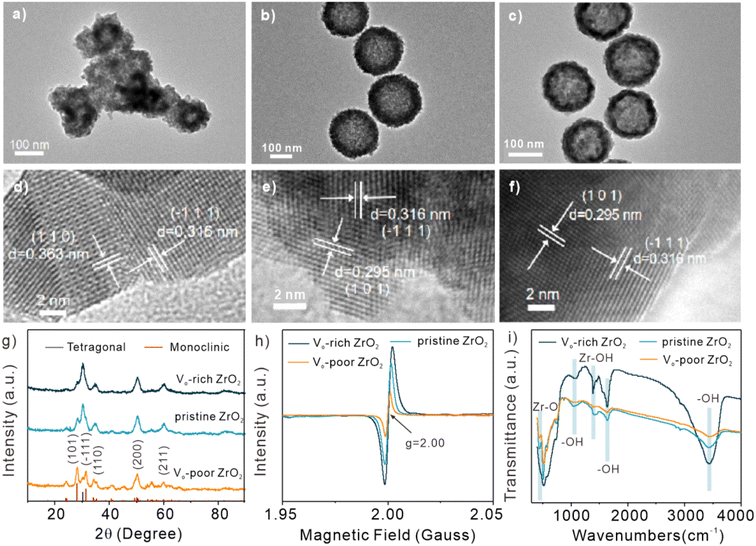
For obtaining ZrO2 samples with different oxygen vacancy concentrations, pristine ZrO2, possessing a small quantity of intrinsic OVs, was first synthesized through the hydrothermal method. Then, Vo-poor ZrO2 and Vo-rich ZrO2 were acquired through calcining pristine ZrO2 in air or Ar/H2, respectively. As pristine ZrO2 was partially reduced with the treatment of Ar/H2, a decreased number of oxygen atoms in Vo-rich ZrO2 were obtained. In contrast, the oxidizing gas (air) caused pristine ZrO2 to gain oxygen atoms, leading to the formation of Vo-poor ZrO2. The calcination treatment in reducing gas is also applicable for many other nano-metal oxides to create OVs,23,24 which is quite convenient and effective. The corresponding morphological characterization results of Vo-poor ZrO2, pristine ZrO2, and Vo-rich ZrO2 are shown in Fig. 1a–c and S1, S2†. The transmission electron microscopy (TEM) images of pristine ZrO2 and Vo-rich ZrO2 showed distinct hollow sphere structures with a diameter of about 150 nm, and the hollow volumes of Vo-rich ZrO2 particles significantly increased compared to those in pristine ZrO2 particles. However, the morphology of Vo-poor ZrO2 changed obviously, and severe aggregation was observed. The lattice orientations of (101) and (−111) in Vo-rich ZrO2 particles were marked in high-resolution transmission electron microscopy (HRTEM) images (Fig. 1d–f). It is clear to see that the lattice fringes of Vo-poor ZrO2 in Fig. 1d were clearer and neater than that of the others as the OVs were occupied by the oxygen atoms when being calcined in air. The energy-dispersive spectrometer (EDS) images in Fig. S2† show that the order of the percentage of oxygen atoms was Vo-poor ZrO2 > pristine ZrO2 > Vo-rich ZrO2, which was consistent with their corresponding oxygen vacancy concentrations. N2 adsorption–desorption isotherm curves in Fig. S3† exhibited the types of hysteresis loops in the range of 0.3–1.0 (P/P0), showing that all of them possessed mesoporous structures, and Vo-rich ZrO2 had the largest surface areas compared to the others. The X-ray diffraction (XRD) spectra of these ZrO2 particles are displayed in Fig. 1g. The peaks in Vo-rich ZrO2 were in good agreement with the standard card of JCPDS NO. 80-2155 (tetragonal phase), while the monoclinic ZrO2 characteristic peaks (JCPDS NO. 86-1449) were coincident with peaks in Vo-poor ZrO2 which only exhibited a small proportion of tetragonal phase characteristics. Besides, the pristine ZrO2 particles were also dominated by the tetragonal phase, showing a small intensity of characteristic peaks of monoclinic ZrO2.25 A strong intensity of monoclinic ZrO2 characteristic peak was observed in Vo-poor ZrO2 as pure stoichiometric ZrO2 crystals are the monoclinic phase which is highly stable at room temperature, and it would be converted to the tetragonal phase above 1400 K while to the cubic phase above 2600 K. It was found that the tetragonal phase could exist at normal temperature by introducing defects, and Vo-poor ZrO2 possesses more monoclinic phases due to the decrease of the oxygen vacancy concentrations.26 More details of crystalline phase transition were revealed by Raman spectra (Fig. S4†). The comparison of EPR signals provided evidence of different oxygen vacancy concentrations among Vo-poor ZrO2, pristine ZrO2, and Vo-rich ZrO2, as shown in Fig. 1h. The signals generated by the unpaired electrons at the OVs (g = 2.00) weakened sharply after heat treatment in air while strengthened in Ar/H2, which verified that Vo-rich ZrO2 possessed the highest oxygen vacancy concentration while Vo-poor ZrO2 had the lowest.27,28 The Fourier transform infrared (FT-IR) spectra (Fig. 1i) in the range of 400 to 4000 cm−1 demonstrated that they all have five characteristic peaks and there is no significant difference in peak position. The small peaks at 475, 1080, and 1385 cm−1 could be attributed to Zr–O vibration, bending vibration of hydroxyl groups, and Zr–OH vibration, respectively. The peaks at 1600 and 3430 cm−1 were assigned to the –OH flexural vibration mode and tensile mode.29 It was clearly shown that the content of –OH is also positively correlated with the concentration of OVs and the –OH content in Vo-rich ZrO2 was much higher than that in pristine ZrO2 and Vo-poor ZrO2.2.2 Valance states and electronic structure study
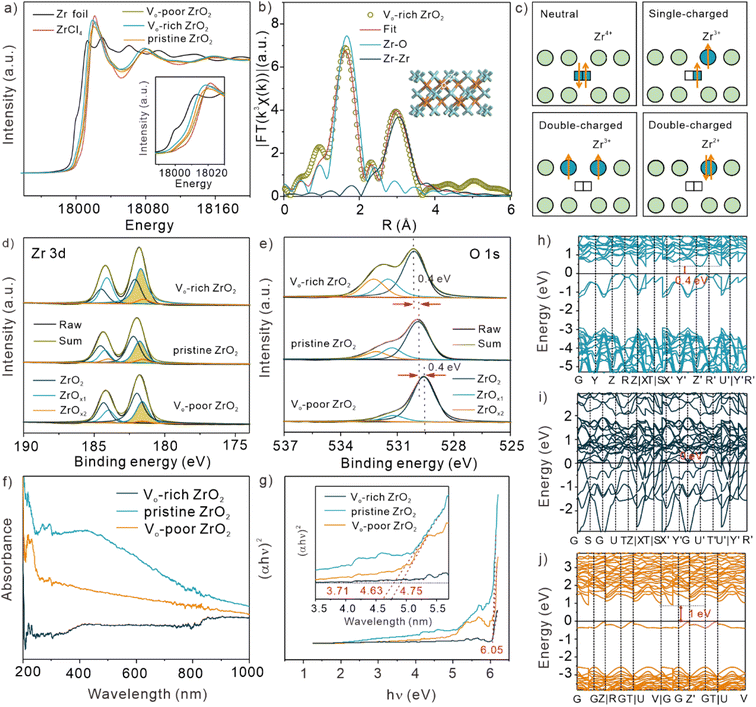
For figuring out the valence states of Zr in the three samples with different concentrations of OVs, the normalized Zr K-edge X-ray absorption near edge structure (XANES) spectra of Zr foil, ZrCl4, pristine ZrO2, Vo-poor ZrO2, and Vo-rich ZrO2 were analyzed, as shown in Fig. 2a. It is clear to see that the position of pre-edge peak tendency and the white line peak of Zr K-edge XANES in Vo-rich ZrO2 was in lower energy compared with that in pristine ZrO2 and Vo-poor ZrO2, indicating that the valence states of Zr in Vo-rich ZrO2 were lower than those of the others, and all of them were lower than that in ZrCl4 (Zr4+). Besides, Fig. 2b demonstrated the fitting results of Zr K-edge EXAFS spectra of Vo-rich ZrO2, which showed that Vo-rich ZrO2 had Zr–O and Zr–Zr coordination peaks. More information is shown in Fig. S5, S6, and Table S1.† It was found that after calcining in1 Ar/H2, the coordination numbers of Zr–O in Vo-rich ZrO2 (3.1) decreased apparently compared to that in pristine ZrO2 (3.6) and Vo-poor ZrO2 (3.9), further proving the highest oxygen vacancy concentration in Vo-rich ZrO2. There are three kinds of charge-characteristic OVs possibly generated in hypoxic ZrO2 due to Madelung potential, which are neutral, single, and double charge, respectively.26 The corresponding schematic diagrams are shown in Fig. 2c. The oxygen atom escaped with two electrons remaining, resulting in the formation of neutral OVs; while single-charged OVs retain one electron, and the other one is transferred to the adjacent Zr4+ to generate Zr3+. Regarding the double-charged OVs, Zr4+ is reduced to Zr3+ or Zr2+ depending on the number of electrons transferred.25 The high-resolution X-ray photoelectron spectroscopy (XPS) spectra of Zr 3d (Fig. 2d) and O 1s (Fig. 2e) of the three ZrO2 samples were also analysed for exploring their different OV species. As shown in Fig. 2d, the peak at 182.1 eV was in the majority of Zr 3d in pristine ZrO2 (56.14%) and Vo-poor ZrO2 (61.04%), indicating that the Zr4+ was the main state present in these two ZrO2 samples. Besides, the peaks coloured with cyan and orange were the non-stoichiometric ZrO2 caused by OVs and assigned as ZrOx1 (1.5 < x1 < 2) and ZrOx2 (1 < x2 ≤ 1.5), respectively. In Table S2,† we summarized the proportions of ZrOx1, ZrOx2, and their sums in the total area of O 1s, as well as that in the total area of Zr 3d. It was obvious that the sum proportion of ZrOx1 and ZrOx2 in Vo-rich ZrO2 was much higher than that in pristine ZrO2 and Vo-poor ZrO2, indicating that more single and double-charged OVs were produced in Vo-rich ZrO2. Similarly, ZrOx1 and ZrOx2 can be allocated to the position of 531.2 and 532.2 eV in the O 1s region in pristine ZrO2 and Vo-poor ZrO2,25,30 as shown in Fig. 2e. It is worth noting that the peaks of ZrOx1 and ZrOx2 in Vo-rich ZrO2 were much obvious than that of the other two, which all verified the highest concentration of Zr2+ and Zr3+ in Vo-rich ZrO2. And the peak at 529.9 eV in pristine ZrO2, which was attributed to Zr4+, shifted toward higher binding energy (530.2 eV) after fabricating abundant OVs while shifted toward lower binding energy (529.6 eV) in Vo-poor ZrO2, indicating that more dramatic changes in the oxygen environment occurred.To investigate the different electrochemical properties of these samples caused by OVs, the cyclic voltammetry (CV) and electrochemical impedance spectroscopy (EIS) experiments on pristine ZrO2, Vo-poor ZrO2, and Vo-rich ZrO2 were implemented. It was found that the conductivities of ZrO2 samples were positively correlated with the concentration of OVs, as exhibited in Fig. S7.† Besides, the UV-vis absorption spectra of the three ZrO2 particles (Fig. 2f) were collected and converted to a Tauc plot (Fig. 2g) as there is a close relationship between band gap and electrical conductivity. The energy band gap was calculated by converting the data according to the following formula:
| (αhν)n = k(hν − Eg) | (1) |
2.3 Remarkable catalytic ability of Vo-rich ZrO2 triggered by OVs
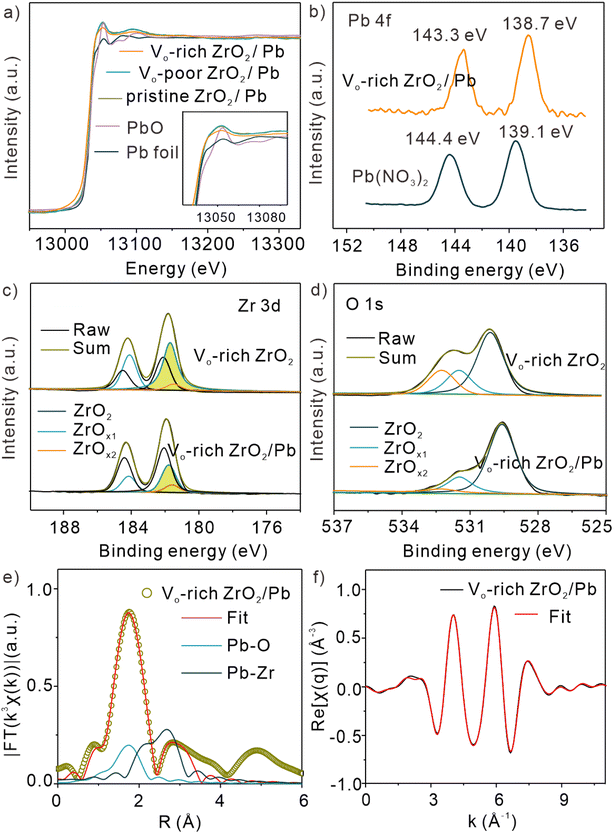
To explore the relationship between OV concentration and catalytic capacity, a divalent lead solution was adsorbed on the three ZrO2 samples, revealing the interface catalytic effect between Vo-rich ZrO2 and lead ions. XAFS spectra of the three samples after adsorption of Pb(II) were first studied, which were denoted as pristine ZrO2/Pb, Vo-poor ZrO2/Pb, and Vo-rich ZrO2/Pb, respectively. Fig. 3a shows the normalized Pb L3-edge XANES spectra of Pb foil, PbO, pristine ZrO2/Pb, Vo-poor ZrO2/Pb, and Vo-rich ZrO2/Pb. It has been reported that the height of the white line peak is related to the electronic structure and usually a higher white line peak indicates a higher valence state. Surprisingly, the height of the white line peak of Pb in Vo-rich ZrO2/Pb was similar to that in Pb foil, while that of pristine ZrO2/Pb and Vo-poor ZrO2/Pb was between Pb foil and PbO, indicating that almost all Pb(II) was catalytically reduced to Pb(0) in Vo-rich ZrO2 while part of Pb(II) in pristine ZrO2 and Vo-poor ZrO2. It is worth mentioning that Pb(II) could be effectively reduced without an electric field, showing that Vo-rich ZrO2 had superb catalytic ability. Comparison of Pb 4f XPS spectra of Vo-rich ZrO2/Pb(II) and Pb(NO3)2 is shown in Fig. 3b. It was observed that the two peaks of Pb 4f7/2 and Pb 4f5/2 at 138.7 eV and 143.3 eV in Vo-rich ZrO2, respectively, were a little lower than those in Pb(NO3)2 (139.1 eV and 144.4 eV),35 indicating that Pb(II) possibly obtained some electrons from Vo-rich ZrO2, which was in good agreement with the above XANES results. Besides, a comparison of XPS on different samples before and after the adsorption of Pb(II) was also performed. It is clear to see that the peak intensity of Pb 4f followed the trend as Vo-rich ZrO2 > pristine ZrO2 > Vo-poor ZrO2, as shown in Fig. S11,† indicating that Vo-rich ZrO2 had the largest amount of the adsorbed lead. At the same time, the surface energies of (101) and (−111) with different OV concentrations on Vo-rich ZrO2 have been calculated and the detailed information is shown in Table S2,† which indicated that with the increased concentration of OVs, the surface energies of both facets increase, showing better adsorption abilities.36 As there was a positive correlation between OV concentration and adsorption capacity, it could be deduced that the produced OVs could increase the number of active sites on the surface of ZrO2 to adsorb more Pb(II). Besides, the zeta potential test results in HAc–NaAc buffer solution at pH 5.0 are displayed in Fig. S12.† Clearly, as the concentration of OVs increased, more free electrons covered the surface of ZrO2, resulting in a stronger electronegativity. Combined with the FT-IR results in Fig. 1i, perhaps more Pb(II) will be electrostatically adsorbed on Vo-rich ZrO2 as –OH could chemically bond and interact with Pb(II), resulting in better adsorption capacity toward Pb(II).29,37 In addition, the changes of XPS Zr 3d and O 1s in Vo-rich ZrO2 were also investigated, as displayed in Fig. 3c, d and S13, S14.† Through the comparison, it was found that the total ratio of (ZrOx1 + ZrOx2) decreased significantly after the adsorption of Pb(II) compared with that of pristine ZrO2/Pb(II) and Vo-poor ZrO2/Pb(II), as shown in Table S3,† which indicated that Zr3+ and Zr2+ directly participated in boosting the catalytic reduction of Pb(II). For investigating the catalytic mechanisms of Vo-rich ZrO2 toward Pb(II) at the atomic level, the EXAFS spectra of Pb L3-edge in R space of pristine ZrO2/Pb, Vo-poor ZrO2/Pb, and Vo-rich ZrO2/Pb are exhibited in Fig. 3e, f and S15.† More detailed fitting results are shown in Table S4.† It was found that the first-shell coordination peak of Vo-rich ZrO2/Pb was at RPb–O = 2.30 Å with 1.2 O atoms around,38 where the second-shell coordination peak of Vo-rich ZrO2/Pb was at RPb–Zr = 3.04 Å with 1.0 Zr atom around. Compared with pristine ZrO2/Pb and Vo-poor ZrO2/Pb, the bond length of Pb–Zr in Vo-rich ZrO2/Pb was much longer than that of them, which was 3.01 Å and 3.00 Å, respectively. It suggested that Pb ions adsorbed on Vo-rich ZrO2 were easier to desorb than that adsorbed on pristine ZrO2 and Vo-poor ZrO2, contributing to improving the interface catalytic efficiency.2.4 The observed hydroxyl radicals induced by divalent heavy metal ions
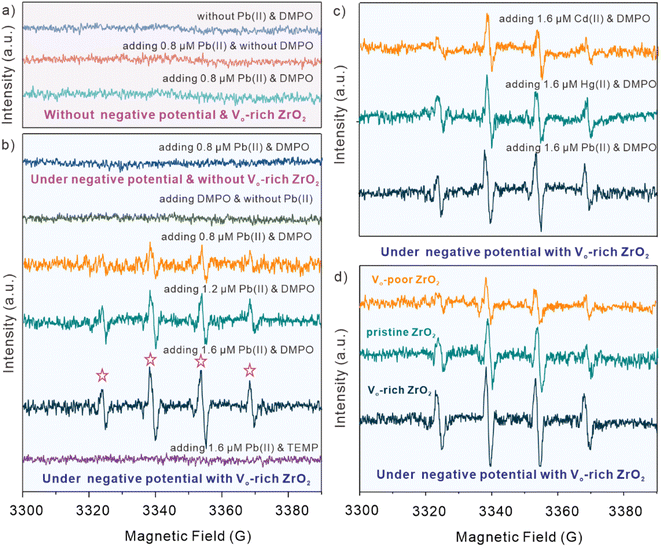
The in situ EPR experiments were carried out to study the possibly produced ROS species during the electrochemical catalytic process with Vo-rich ZrO2. Fig. 4a and b display the EPR spectra of observed ˙OH under the specific experimental conditions, and 5,5-dimethyl-1-oxaporphyrin-N-oxide (DMPO) was adopted as a spin-trapping agent. Obviously, it is clear to see that no matter whether Pb(II) and DMPO are added or not, there are no peak signals when without the effect of negative potential and the catalyst of Vo-rich ZrO2. After applying the negative potential, no EPR signals could be detected when there is no Vo-rich ZrO2 existing even though Pb(II) and DMPO were added. As shown in Fig. 4b, with the effect of negative potential and Vo-rich ZrO2, several peaks appeared in the presence of Pb(II) and DMPO, while there were no peaks observed without the addition of Pb(II). Interestingly, with the increasing concentration of Pb(II), the typical peaks of DMPO-˙OH (1![[thin space (1/6-em)]](https://www.rsc.org/images/entities/char_2009.gif) :
:![[thin space (1/6-em)]](https://www.rsc.org/images/entities/char_2009.gif) 2:2
2:2![[thin space (1/6-em)]](https://www.rsc.org/images/entities/char_2009.gif) :
:![[thin space (1/6-em)]](https://www.rsc.org/images/entities/char_2009.gif) 1) became more evident, indicating that a growing number of ˙OH was produced during this electrochemical catalytic process. It is worth mentioning that 2,2,6,6-tetramethyl-4-piperidine (TEMP), another type of spin-trapping agent, was also solely added for excluding the possibility of the generation of other ROS species. In brief, it could be deduced that ˙OH would be produced during the electrochemical catalytic reaction of Vo-rich ZrO2, where Pb(II) is necessary and act as a radical initiator.
1) became more evident, indicating that a growing number of ˙OH was produced during this electrochemical catalytic process. It is worth mentioning that 2,2,6,6-tetramethyl-4-piperidine (TEMP), another type of spin-trapping agent, was also solely added for excluding the possibility of the generation of other ROS species. In brief, it could be deduced that ˙OH would be produced during the electrochemical catalytic reaction of Vo-rich ZrO2, where Pb(II) is necessary and act as a radical initiator.
For figuring out whether other kinds of divalent heavy metal ions, except Pb(II), could trigger the production of ˙OH, 1.6 μM Cd(II) and Hg(II) were added respectively into the buffer solution under the same experimental conditions. Surprisingly, as displayed in Fig. 4c, the peaks of DMPO-˙OH were also detected when adding Cd(II) and Hg(II), while their intensities seemed a bit lower than that of adding Pb(II). This indicated that divalent heavy metal ions, not just confined to Pb(II), could induce the generation of ˙OH with the electrochemical catalytic effect of Vo-rich ZrO2. What's more, pristine ZrO2 and Vo-poor ZrO2 were also used to investigate the relationship between OV concentrations and the generated ˙OH. Fig. 4c shows the comparison of EPR spectra of Vo-rich ZrO2, pristine ZrO2, and Vo-poor ZrO2 for electrochemical catalysis in the presence of DMPO and 2.0 μM Pb(II). It was found that Vo-rich ZrO2 had the largest amount of produced ˙OH during the reaction, and the intensities of DMPO-˙OH peak signals were positively correlated with the concentration of OVs. It could be concluded that the captured different intensities of DMPO-˙OH peak signals of these three samples were ascribed to their different concentration of OVs. And the generated ˙OH perhaps have a specific impact on boosting the catalytic capacities of Vo-rich ZrO2.
2.5 The investigation of changed electronic structure and energy barrier
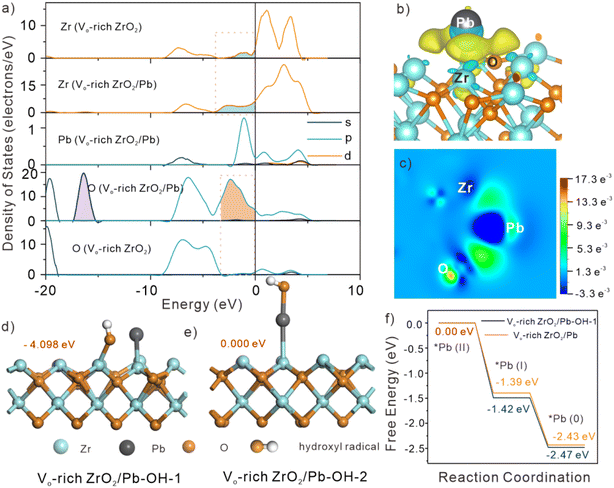
DFT calculations were employed to further understand the inner mechanisms for obviously enhanced catalytic capacity of Vo-rich ZrO2 due to the generated abundant OVs. The electronic structure of Vo-rich ZrO2 after adsorption of Pb(II) was studied first. The optimized structures of Pb(II) adsorbed on the surface of the three ZrO2 samples are exhibited in Fig. S16.† It showed that the adsorption energies of Pb(II) on pristine ZrO2, Vo-rich ZrO2, and Vo-poor ZrO2 were −1.542, −0.196 and −1.695 eV. Apparently, Vo-rich ZrO2/Pb had the lowest adsorption energy. The changes in the partial DOS of Zr, O, and Pb atoms in Vo-rich ZrO2 before and after the adsorption are shown in Fig. 5a. The degree of overlap between the orbitals of Pb 6p and Zr 4d near the Fermi level followed the trend as Vo-rich ZrO2/Pb < pristine ZrO2/Pb < Vo-poor ZrO2/Pb (Fig. S17†), reflecting the opposite strength on desorption capacities. This evidence was in good agreement with the EXAFS results. Besides, it is clear to see that the electron density of Zr 3d and O 1s close to the Fermi surface increased a lot in Vo-rich ZrO2/Pb, indicating that the intrinsic material becomes active when interacting with Pb atoms. A prominent newborn orbital hybrid peak (filled with purple) emerged in the partial DOS of O 1s of all three absorptive configurations, which proved the speculation that the adsorbed Pb atoms might take up the positions of OVs. Besides, the charge density difference images of the three adsorption structures showed that the electron cloud density (yellow area) around the Pb atoms in Vo-rich ZrO2/Pb was the least while that in Vo-rich ZrO2/Pb was the largest, which further proved the low absorptive ability of Pb(II) on Vo-rich ZrO2, as shown in Fig. 5b and S18.† The charge density difference image on the slice through Pb, Zr, and O atoms (Fig. 5h) displayed the electron flow condition that Zr atoms lost electrons to Pb atoms.39 In other words, the electron rearrangement in Vo-rich ZrO2 caused by OVs is beneficial for the catalytic reduction of Pb(II). The Bader charge of Pb, Zr, and O atoms was computed, and the results are displayed in Fig. S19 and Table S5.† It was found that the adsorbed Pb could obtain 0.167e more in Vo-rich ZrO2 than that in Vo-poor ZrO2, which was conducive to boosting the reduction rates, showing the excellent catalytic ability of Vo-rich ZrO2. The function of ˙OH in catalysis of Pb(II) was also studied. According to different active sites of ˙OH toward Pb(II), two different optimized configurations of Vo-rich ZrO2/Pb when ˙OH participate in Pb(II) reduction are exhibited in Fig. 5d and e, which were denoted as Vo-rich ZrO2/Pb–OH-1 and Vo-rich ZrO2/Pb–OH-2. Considering that ZrO2/Pb–OH-1 had the larger absorptive energy, −4.098 eV, which had a more stable configuration, the energies for Pb(II) reduction on Vo-rich ZrO2/Pb–OH-1 were simulated. The reduction process of Pb(II) to Pb(0) was in two steps, as shown in Fig. 5f. Apparently, every step of Vo-rich ZrO2/Pb–OH-1 for Pb(II) reduction had lower energies than that of Vo-rich ZrO2/Pb, indicating that the participation of ˙OH was more conducive to the reaction.2.6 Super-high catalytic capacity of Vo-rich ZrO2 in electrochemical reduction
For verifying the catalytic capacity and practical application prospect of Vo-rich ZrO2 in the electrochemical reduction reaction, the three ZrO2 samples were modified as catalysts on the same glassy carbon electrode (GCE) respectively for electrochemical catalysis of Pb(II) through square wave anode stripping voltammetry (SWASV). The bare GCE was also tested for comparison. The current responses of Pb(II) with increasing concentrations are shown in Fig. S20a–d.† Apparently, the current values of these modified GCEs toward Pb(II) at ca. −0.58 V all increased with the Pb(II) concentrations and an excellent linear relationship between Pb(II) concentration and peak current density was observed. The values of their current density per unit concentration were obtained by dividing the active area by the SWASV slope, and the active area of each modified electrode is shown in Fig. S21.† The current density per unit concentration of pristine ZrO2, Vo-poor ZrO2, and Vo-rich ZrO2 modified electrodes toward Pb(II) was 255.8, 184.9, and 2029.4 μA cm−2 μM−1, respectively, (Fig. 6). It was surprising that the catalytic ability of Vo-rich ZrO2 was almost 6.9 times higher than that of pristine ZrO2 and even 9.9 times higher than that of Vo-poor ZrO2, which indicated that the incredibly improved electrocatalytic ability of pristine ZrO2 was obtained after creating OVs. Besides, the order of their catalytic ability (Vo-rich ZrO2 > pristine ZrO2 > Vo-poor ZrO2) was consistent with their concentration of OVs, implying the vital role of OVs in the catalytic reduction of Pb(II). Besides, the corresponding experiments for characterizing catalytic cycle properties of Vo-rich ZrO2 have also been carried out, showing excellent practical application prospects. More information is displayed in Fig. S22.†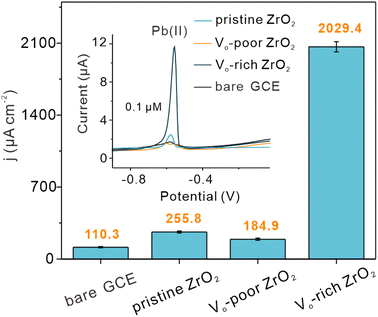 | ||
| Fig. 6 Comparisons of the current densities and the SWASV curves of Pb(II) at the same concentration on the bare GCE and the three modified electrodes. | ||
Fig. 7 vividly depicts the interface catalytic regulation via significant roles of OVs in Vo-rich ZrO2 for enhancing the catalytic efficiency in the electrochemical reduction of Pb(II). Fig. 7a shows that the extra electrons remaining in OVs transferred to the adjacent Zr4+, leading to the generation of Zr3+ and Zr2+. Then, more Pb(II) is adsorbed on the surface OVs of Vo-rich ZrO2 due to the large surface area, occupying the position of OVs and resulting in the formation of Pb–O and Pb–Zr bonds, as shown in Fig. 7b. The accumulated electrons in Zr3+ and Zr2+ directly transferred to Pb(II), promoting the catalytic reduction of absorbed Pb(II) to Pb(0). Besides, the longest Pb–Zr bonds and the lowest adsorption energy in Vo-rich ZrO2/Pb compared to those in pristine ZrO2/Pb and Vo-poor ZrO2/Pb are beneficial for Pb(II) to desorb, improving the rates of conversion. What's more, the generated ˙OH which are induced by OVs and Pb(II) also act as redox mediators to accelerate the electron transfer rates in electrochemical reduction reactions, boosting the interface catalytic effect.
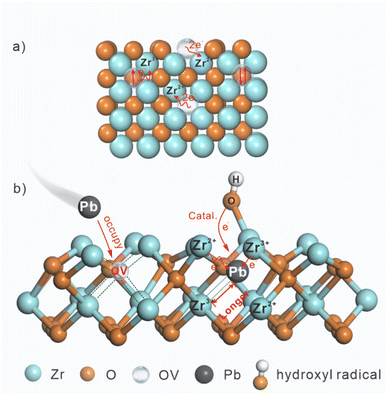 | ||
| Fig. 7 The schematic diagram of (a) electron rearrangement on Vo-rich ZrO2 triggered by OVs; (b) interface catalytic regulation via OVs and ˙OH on Vo-rich ZrO2. | ||
3 Conclusions
In summary, ZrO2 mesoporous hollow spheres rich in OVs were fabricated and the multiple roles of OVs in interface catalytic regulation were revealed. First, the introduction of OVs brings more catalytic reaction sites. After fabricating abundant OVs, the adsorption capacity is improved due to increased surface area, and more surface –OH is produced for chemical interaction with reactants. Unlike other catalytic systems where OVs are indirectly involved in catalytic processes, in this study, OVs themselves are catalytic rooms for the adsorbed reactants, enhancing the rates of conversion and the reaction. Second, OVs cause the rearrangement of electrons. The excess electrons in OVs transfer to the adjacent Zr4+, promoting the formation of Zr2+ and Zr3+, which in turn transfer electrons to the reactants. Zr2+ and Zr3+ serve as redox mediators, accelerating the electron transfer rates and boosting the catalytic reduction reaction. The changed electronic and energy band structures induced by OVs also enhanced the intrinsic conductivity and activity of pristine ZrO2. Besides, DFT calculations and EXAFS revealed that longer Pb–Zr and lower absorptive energies are beneficial for desorption. Third, for the first time, ˙OH have been observed to be triggered by OVs and divalent heavy metal ions in in situ EPR experiments. It was shown that when adding divalent heavy metal ions, more produced ˙OH were captured in the electrochemical reduction reaction with Vo-rich ZrO2, which also act as a catalyst. In the experiments of electrochemical reduction of Pb(II), it was shown that the catalytic ability of Vo-rich ZrO2 was almost 9.9 times higher than that of Vo-poor ZrO2, showing superior practical application prospects in the fields of chemistry, nanomaterials, catalysis, etc. This finding will provide enlightenment and guidance for wide communities including advanced in situ measurements, especially in the fields of chemistry, catalysis, nanomaterials, etc., in boosting the catalytic effect through interface catalytic regulation.4 Experimental section
4.1 Synthesis of ZrO2 hollow spheres
The synthesis of ZrO2 hollow spheres referred to the previous literature with revision.40 Zirconium dichloride (0.3 g) is added to acetone (90 mL) and stirred magnetically for a few minutes to completely dissolve to form a colourless solution. The solution was immediately filled into a 100 mL Teflon-lined container, sealed, and placed in an oven at 200 °C for 12 h, and then naturally cooled down to room temperature. The resulting solution was centrifuged at 10![[thin space (1/6-em)]](https://www.rsc.org/images/entities/char_2009.gif) 000 rpm for 3 minutes, then alternately washed twice with water, ethanol, and acetone. The obtained precipitate was freeze-dried all day, and the resulting powder was called pristine ZrO2.40 The pristine ZrO2 powder was calcined at 650 °C in a tube furnace with an average ramp rate of 3 °C min−1 for 90 minutes, and the gas introduced was (Ar/H2, air); the products were named Vo-rich ZrO2 and Vo-poor ZrO2.
000 rpm for 3 minutes, then alternately washed twice with water, ethanol, and acetone. The obtained precipitate was freeze-dried all day, and the resulting powder was called pristine ZrO2.40 The pristine ZrO2 powder was calcined at 650 °C in a tube furnace with an average ramp rate of 3 °C min−1 for 90 minutes, and the gas introduced was (Ar/H2, air); the products were named Vo-rich ZrO2 and Vo-poor ZrO2.
4.2 Computational methods
Spin-polarized DFT calculations were performed using the Vienna ab initio simulation package (VASP).41,42 The generalized gradient approximation proposed by Perdew, Burke, and Ernzerhof (GGA-PBE) is selected for the exchange-correlation potential.43 The pseudo-potential was described by the projector-augmented-wave (PAW) method.44 The geometry optimization is performed until the Hellmann–Feynman force on each atom is smaller than 0.02 eV·Å−1. The energy criterion is set to 10−6 eV in the iterative solution of the Kohn–Sham equation. For DOS calculation, a 2 × 1 × 1 supercell adopted from tetragonal ZrO2 was used for pristine ZrO2 and Vo-rich ZrO2, and a 1 × 12 × 1 supercell adopted from monoclinic ZrO2 was used for Vo-poor ZrO2. The supercell size for pristine ZrO2 and Vo-rich ZrO2 is 10.14 × 5.07 × 5.07 Å3, and it is 5.1454 × 10.4150 × 5.3107 Å3 for Vo-poor ZrO2. The k-mesh for structure optimization is 0.06 2π Å−1. For adsorption calculation, a 2 × 2 supercell with 12 Å vacuum is applied. The size of Vo-rich ZrO2/Pb and pristine ZrO2 is 10.14 × 10.14*16.8022 Å3. The size of Vo-poor ZrO2/Pb is 10.415 × 10.6214 × 17.0749 Å3. The k-mesh for structure optimization is 0.06 2π Å−1. The hydroxyl radicals were calculated using PBE and their charge states are automatically assigned by the program.Data availability
We have provided all the data in the manuscript and ESI.†Author contributions
X. H., M. Y. and X. X. designed this project. X. X. and C. Z. implemented the experiments. Z. S. implemented the DFT calculations. X. X., Y. Z. and Z. G. completed the data analysis. X. X. and C. Z. drafted the manuscript. S. C., P. L, and Y. S. reviewed and edited the manuscript. All authors approved the final version.Conflicts of interest
There are no conflicts to declare.Acknowledgements
This work was supported by the National Key R&D Program of China (2021YFB3201400), the National Natural Science Foundation of China (22204166 and 22206187), the Key R&D Program of Anhui Province (202104i07020006 and 202104i07020011), the China Postdoctoral Innovation Talents Supporting Project (BX2021317), Anhui Provincial Natural Science Foundation (2208085QB57), the postdoctoral researcher funding project of Anhui Province (2021B528), the Youth Innovation Promotion Association of CAS (2023469), and the HFIPS Director’s Fund, Grant No. YZJJZX202019, YZJJ202102, YZJJ2022QN26 and YZJJ202302-TS. This work was also supported by the CAS-Shanghai Science Research Center, User Experiment Assist System, and the staff of the BL11B and BL14W1 beamline of SSRF for data collection. A portion of this work was performed on the Steady High Magnetic Field Facilities, High Magnetic Field Laboratory, CAS. Special Foundation of President of the Chinese Academy of Sciences and the special project (SXHZ202003) of science and technology cooperation between Fuyang Municipal People's Government and Fuyang Normal University are acknowledged.References
- A. Zhang, R. Zhao, L. Hu, R. Yang, S. Yao, S. Wang, Z. Yang and Y. M. Yan, Adv. Energy Mater., 2021, 11, 2101412 CrossRef CAS.
- E. V. Miu, J. R. McKone and G. Mpourmpakis, J. Am. Chem. Soc., 2022, 144, 6420–6433 CrossRef CAS PubMed.
- E. Lam, J. J. Corral-Perez, K. Larmier, G. Noh, P. Wolf, A. Comas-Vives, A. Urakawa and C. Coperet, Angew. Chem., Int. Ed., 2019, 58, 13989–13996 CrossRef CAS PubMed.
- X. Y. Guo, L. Yao, X. Y. Hou, X. F. Wu, Y. W. Zhang, Q. Zhu, Z. T. Guo, S. T. Li, Y. L. Jiang, S. H. Feng and K. K. Huang, Chem. Sci., 2022, 13, 9440–9449 RSC.
- D. N. Pei, L. Gong, A. Y. Zhang, X. Zhang, J. J. Chen, Y. Mu and H. Q. Yu, Nat. Commun., 2015, 6, 8696 CrossRef CAS PubMed.
- Y.-F. Sun, J.-J. Li, F. Xie, Y. Wei and M. Yang, Sens. Actuators, B, 2020, 320, 128355 CrossRef CAS.
- Y.-F. Sun, W. Jian, P.-H. Li, M. Yang and X.-J. Huang, Sens. Actuators, B, 2019, 292, 136–147 CrossRef CAS.
- H. Y. An, Y. Hu, N. Song, T. L. Mu, S. Q. Bai, Y. Peng, L. L. Liu and Y. Tang, Chem. Sci., 2022, 13, 3035–3044 RSC.
- X. Dong, X. Duan, Z. Sun, X. Zhang, C. Li, S. Yang, B. Ren, S. Zheng and D. D. Dionysiou, Appl. Catal., B, 2020, 261, 118214 CrossRef CAS.
- M. Chen, W. Wang, Y. Qiu, H. Wen, G. Li, Z. Yang and P. Wang, ACS Catal., 2022, 12, 5565–5573 CrossRef CAS.
- M. Chu, C. Chen, W. Guo, L. Lu, Y. Wu, H. Wu, M. He and B. Han, Green Chem., 2019, 21, 2589–2593 RSC.
- D. N. Pei, L. Gong, A. Y. Zhang, X. Zhang, J. J. Chen, Y. Mu and H. Q. Yu, Nat. Commun., 2015, 6, 8696 CrossRef CAS PubMed.
- P. H. Li, Z. Y. Song, M. Yang, S. H. Chen, X. Y. Xiao, W. Duan, L. N. Li and X. J. Huang, Anal. Chem., 2020, 92, 16089–16096 CrossRef CAS PubMed.
- H. Li, H. Shang, X. Cao, Z. Yang, Z. Ai and L. Zhang, Environ. Sci. Technol., 2018, 52, 8659–8665 CrossRef CAS PubMed.
- P. Lyu, J. Zhu, C. Han, L. Qiang, L. Zhang, B. Mei, J. He, X. Liu, Z. Bian and H. Li, ACS Appl. Mater. Interfaces, 2021, 13, 2033–2043 CrossRef CAS PubMed.
- X. Yuan, L. Wang, M. Hu, L. Zhang, H. Chen, D. Zhang, Z. Wang, T. Li, M. Zhong, L. Xu, D. Wang, Y. Liu and W. Tan, Angew. Chem., Int. Ed., 2021, 60, 20943–20951 CrossRef CAS PubMed.
- X. Wang, L. Wu, J. Wang, Y. Zhou, Y. Wang, W. D. Wu, W. Li and Z. Wu, Chemosphere, 2022, 307, 135967 CrossRef CAS PubMed.
- S. Liang, W. Zheng, L. Zhu, W. Duan, C. Wei and C. Feng, Environ. Sci. Technol., 2019, 53, 5328–5336 CrossRef CAS PubMed.
- Z. Miao, P. Hu, C. Nie, H. Xie, W. Fu and Q. Li, J. Energy Chem., 2019, 38, 114–118 CrossRef.
- H. Yildirim and R. Pachter, ACS Appl. Electron. Mater., 2019, 1, 467–477 CrossRef CAS.
- M. D. Palacios, S. Mestre, M. J. Orts and E. Blasco, Bol. Soc. Esp. Ceram. Vidrio, 2012, 51, 169–174 CrossRef CAS.
- M. Gajek, J. Partyka, M. Lesniak, A. Rapacz-Kmita and L. Wojcik, Ceram. Int., 2018, 44, 15845–15850 CrossRef CAS.
- S. Li, Y. Cui, R. Kang, B. Zou, D. H. L. Ng, S. A. El-Khodary, X. Liu, J. Qiu, J. Lian and H. Li, Chem. Commun., 2021, 57, 8182–8185 RSC.
- M. A. K. Purbayanto, E. Nurfani, O. Chichvarina, J. Ding, A. Rusydi and Y. Darma, Appl. Surf. Sci., 2018, 462, 466–470 CrossRef CAS.
- M. A. Rahman, S. Rout, J. P. Thomas, D. McGillivray and K. T. Leung, J. Am. Chem. Soc., 2016, 138, 11896–11906 CrossRef CAS PubMed.
- M. V. Ganduglia-Pirovano, A. Hofmann and J. Sauer, Surf. Sci. Rep., 2007, 62, 219–270 CrossRef CAS.
- A. Sinhamahapatra, J. P. Jeon, J. Kang, B. Han and J. S. Yu, Sci. Rep., 2016, 6, 27218 CrossRef CAS PubMed.
- W. Y. Zhou, S. S. Li, J. Y. Song, M. Jiang, T. J. Jiang, J. Y. Liu, J. H. Liu and X. J. Huang, Anal. Chem., 2018, 90, 4328–4337 CrossRef CAS PubMed.
- K. Shehzad, M. Ahmad, J. He, T. Liu, W. Xu and J. Liu, J. Colloid Interface Sci., 2019, 533, 588–597 CrossRef CAS PubMed.
- M. A. Rahman, J. P. Thomas and K. T. Leung, Adv. Energy Mater., 2018, 8, 1701234 CrossRef.
- T. Kondratowicz, M. Drozdek, A. Rokicińska, P. Natkański, M. Michalik and P. Kuśtrowski, Microporous Mesoporous Mater., 2019, 279, 446–455 CrossRef CAS.
- C. Mao, J. Wang, Y. Zou, H. Li, G. Zhan, J. Li, J. Zhao and L. Zhang, Green Chem., 2019, 21, 2852–2867 RSC.
- S. Kumar, S. Bhunia, J. Singh and A. K. Ojha, J. Alloys Compd., 2015, 649, 348–356 CrossRef CAS.
- X. Hao, J. Zhou, Z. Cui, Y. Wang, Y. Wang and Z. Zou, Appl. Catal., B, 2018, 229, 41–51 CrossRef CAS.
- S. S. Li, M. Jiang, T. J. Jiang, J. H. Liu, Z. Guo and X. J. Huang, J. Hazard. Mater., 2017, 338, 1–10 CrossRef CAS PubMed.
- B. Li, X. Li, W. Gao and Q. Jiang, Acta Mater., 2021, 212, 116895 CrossRef CAS.
- W. Y. Zhou, J. Y. Liu, J. Y. Song, J. J. Li, J. H. Liu and X. J. Huang, Anal. Chem., 2017, 89, 3386–3394 CrossRef CAS PubMed.
- S. H. Chen, Z. Y. Song, P. H. Li, X. Y. Xiao, H. Q. Huang, M. Yang, C. H. Lin, L. N. Li and X. J. Huang, J. Hazard. Mater., 2021, 416, 126157 CrossRef CAS PubMed.
- Y. Y. Li, Z. Y. Song, X. Y. Xiao, L. K. Zhang, H. Q. Huang, W. Q. Liu and X. J. Huang, J. Hazard. Mater., 2022, 435, 129009 CrossRef CAS PubMed.
- H. Wang, H. Chen, B. Ni, K. Wang, T. He, Y. Wu and X. Wang, ACS Appl. Mater. Interfaces, 2017, 9, 26897–26906 CrossRef CAS PubMed.
- G. F. Kresse and J. Furthmuller, Comput. Mater. Sci., 1996, 6, 15–50 CrossRef CAS.
- G. F. Kresse and J. Furthmuller, Phys. Rev. B: Condens. Matter Mater. Phys., 1996, 54, 11169–11186 CrossRef CAS PubMed.
- K Burke, J. P. Perdew and M. Ernzerhof, Phys. Rev. Lett., 1997, 78, 1396 Search PubMed.
- P. E. Blochl, Phys. Rev. B: Condens. Matter Mater. Phys., 1994, 50, 17953–17979 CrossRef PubMed.
Footnote |
| † Electronic supplementary information (ESI) available. See DOI: https://doi.org/10.1039/d2sc06762e |
| This journal is © The Royal Society of Chemistry 2023 |

