 Open Access Article
Creative Commons Attribution 3.0 Unported Licence
A general but still unknown characteristic of active oxygen evolution electrocatalysts†
Eleonora
Romeo
 a,
Francesc
Illas
 *a and
Federico
Calle-Vallejo
 *bc
*bc
aDepartment of Materials Science and Chemical Physics, Institute of Theoretical and Computational Chemistry (IQTCUB), University of Barcelona, C/Martí i Franquès 1, 08028 Barcelona, Spain. E-mail: francesc.illas@ub.edu
bNano-Bio Spectroscopy Group, European Theoretical Spectroscopy Facility (ETSF), Department of Polymers and Advanced Materials: Physics, Chemistry and Technology, University of the Basque Country UPV/EHU, Av. Tolosa 72, 20018 San Sebastián, Spain. E-mail: federico.calle@ehu.es
cIKERBASQUE, Basque Foundation for Science, Plaza de Euskadi 5, 48009 Bilbao, Spain
First published on 7th March 2023
Abstract
The unsatisfactory electrocatalysis of the oxygen evolution reaction (OER) is a major hurdle for the sustainable production of hydrogen using water electrolyzers. Besides, most state-of-the-art catalysts are based on expensive and scant elements such as Ru and Ir. Hence, it is paramount to establish the features of active OER catalysts to make well-informed searches. Here, an affordable statistical analysis exposes a general yet unnoticed characteristic of active materials for the OER: they frequently have three out of four electrochemical steps with free energies above 1.23 eV. For such catalysts, the first three steps (abbreviated as: H2O → *OH, *OH → *O, *O → *OOH) are statistically prone to be over 1.23 eV, and the second step is often potential limiting. Finally, “electrochemical symmetry”, a recently introduced concept, is shown to be a simple and convenient criterion for the in silico design of enhanced OER catalysts, as materials with three steps over 1.23 eV tend to be highly symmetric.
Introduction
Our goal in this contribution is to uncover a general but still unknown energetic feature of active catalysts for the oxygen evolution reaction (OER, in acidic conditions: 2H2O → O2 + 4H+ + 4e−). This reaction displays large overpotentials, particularly in acidic media,1–3 and is catalyzed by materials typically based on ruthenium and iridium, which are both expensive and scarce elements on the Earth's crust.4 Arguably, the deficient electrocatalysis of the OER is a foremost impediment on the way toward the global, sustainable production of hydrogen using water electrolyzers.To reach our goal, several ingredients are necessary. First of all, we need a considerable amount of data, such that statistically meaningful analyses can be made. Table S1 in the ESI† shows all the data we collected from the literature for single-atom catalysts (SACs),5,6 monoxides (MO),7–9 dioxides (MO2),8 doped and undoped TiO2,10 perovskite oxides (BaNiOx,11 SrxNayRuO3,12 LaMO3 and SrMO3 (ref. 7–9)), double perovskites (Sr2MIrO6 (ref. 13) and LSNMR14), and metalloporphyrins.15 In total, the set includes around 160 data points from different materials, the structures of which were optimized using density functional theory (DFT) calculations with functionals of the generalized gradient approximation (GGA) family.
Second, we need a means of describing the energetics of proton–electron pairs in electrochemical media. Here we adopted the computational hydrogen electrode approach,16 which seizes the equilibrium in solution between gas-phase hydrogen and protons and electrons, such that:  . This allows us to calculate the adsorption energies of the intermediates and the free energies of the electrochemical steps within a simple and self-consistent thermodynamic framework.
Third, we need a catalytic pathway connecting the reactants and products of the OER. In this case we opted for the most widely used pathway in the literature,8,17 see eqn (1)–(4).
| H2O + * → *OH + H+ + e− | (1) |
| *OH → *O + H+ + e− | (2) |
| *O + H2O → *OOH + H+ + e− | (3) |
| *OOH → * + O2 + H+ + e− | (4) |
| ΔG1 = ΔGOH | (5) |
| ΔG2 = ΔGO − ΔGOH | (6) |
| ΔG3 = ΔGOOH − ΔGO | (7) |
| ΔG4 = ΔGO2 − ΔGOOH | (8) |
| H2O + * → *O + 2H+ + 2e− | (9) |
| 2H2O + * → *OOH + 3H+ + 3e− | (10) |
Fourth, we need a metric for the OER activity. The most widespread in computational electrocatalysis is perhaps the “thermodynamic overpotential”,8,26 calculated on the basis of eqn (5)–(8) as:
| ηOER = max(ΔG1, ΔG2, ΔG3, ΔG4)/e− − E0 | (11) |
The step with the largest (most positive) free energy change is called the potential-limiting step (PLS). Moreover, it is worth noting that the concept of potential-limiting step is different from that of rate-determining step. The former is a thermodynamic construct whereas the latter is a kinetic one. Nonetheless, they are often connected in electrocatalytic pathways,27,28 and we will assume their correspondence in the analysis that follows.
Finally, we need some descriptors to capture the OER activity trends. For our current purposes, we will only consider three descriptors, but we stress that several other experimental and computational descriptors are available in the literature.29–34 The first one is probably the most widely used descriptor in the literature and corresponds to the difference between the adsorption energies of *O and *OH (i.e., ΔGO − ΔGOH,2,8 which corresponds to ΔG2, see eqn (2) and (6)). Furthermore, the scaling relation observed on a vast number of materials7,8,15,26 is such that: ΔGOOH ≈ ΔGOH + 3.20. However, it should ideally be ΔGOOH = ΔGOH + 2.46, given that *OH and *OOH are separated in the catalytic pathway by two electron transfers (2e−˙E0 = 2.46 eV). Indeed, if one adds eqn (2) and (3), the result is: *OH + H2O → *OOH + 2H+ + 2e−. In this order of ideas, the second descriptor (γOOH/OH) as defined in eqn (12), is a metric for the breaking of the scaling relation between the adsorption energies of *OOH and *OH from 3.20 to 2.46 eV:
| γOOH/OH = (ΔGOOH − ΔGOH − 2E0)/2e− | (12) |
This descriptor is worth considering, as the breaking of the *OOH–*OH scaling relation is usually prescribed to optimize OER electrocatalysts.2,8,26 The third descriptor is based on the concept of electrochemical symmetry. A fully symmetric catalyst, namely a thermodynamically ideal catalyst for the OER has: ΔG1 = ΔG2 = ΔG3 = ΔG4, which leads to ηOER = 0 and γOOH/OH = 0,8,35 according to eqn (11) and (12). For real catalysts, catalytic symmetry can be quantified in terms of the electrochemical-step symmetry index (ESSI):36,37
 | (13) |
We note that n in eqn (13) can either be 1, 2 or 3 for real catalysts, while only the ideal catalyst has n = 4 and ESSI = 0. Importantly, in the next section we will show that n is a crucial parameter for the OER performance of electrocatalysts. In particular, catalysts with n = 3 will be statistically shown to most often display low values of ηOER.
Results and discussion
How n influences the activity of catalysts
We now use the three aforementioned descriptors to analyze the OER activity trends among the compounds in our database. In Fig. 1, the data are divided in families of materials, following the conventional depiction of oxygen evolution trends. The upper left panel is a Sabatier-type volcano plot, the apex of which is located at ΔGO − ΔGOH ≈ 1.60 eV and ηOER ≈ 0.37 V. For comparison, an ideal catalyst displays: ΔGO − ΔGOH ≈ 1.23 eV and ηOER ≈ 0, see the yellow square in Fig. 1. It has been argued that the volcano apex is found at these values in view of the transfer of more than two electrons during the OER catalytic cycle and the unfit energetic separation between *OOH and *OH close to 3.20 eV.7,8,15,37,38 Materials lying on the left side of the volcano (ΔGO − ΔGOH < 1.6 eV) bind the OER intermediates strongly, and step 3 (*O → *OOH) is the PLS. Conversely, materials on the right side of the volcano bind the OER intermediates weakly (ΔGO − ΔGOH > 1.6 eV), and the PLS is step 2 (*OH → *O).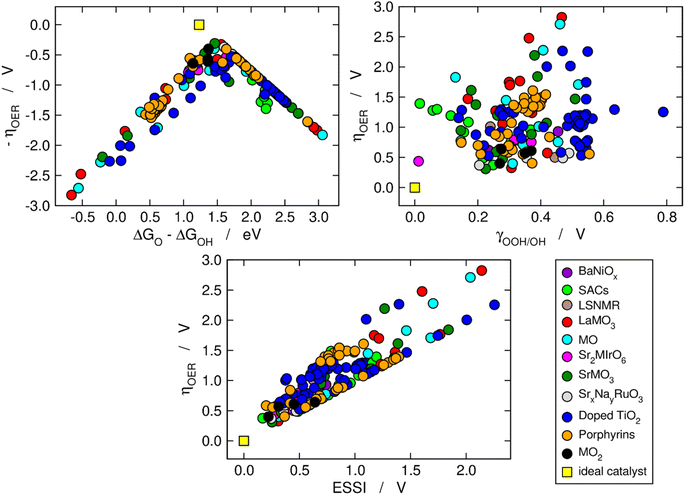 | ||
| Fig. 1 Computational description of OER activity trends on a variety of materials: BaNiOx,11 SACs,5,6 LSNMR,14 MO, LaMO3 and SrMO3,7–9 Sr2MIrO6,13 SrxNayRuO3,12 (doped) TiO2,10 metalloporphyrins,15 and MO2.8 Upper left corner: Sabatier-type activity plot showing −ηOER as a function of ΔGO − ΔGOH. Upper right corner: ηOER plotted against the degree of breaking of the *OOH–*OH scaling relation (γOOH/OH). Bottom: correlation between ηOER and the electrochemical-step symmetry index (ESSI).36 The ideal catalyst, for which ηOER = ESSI = γOOH/OH = 0, is shown in every panel for comparison. | ||
The upper right panel of Fig. 1 shows no clear correlation between ηOER and γOOH/OH, meaning that breaking the *OOH–*OH scaling relation does not guarantee a low OER overpotential.36,37 In fact, although such breaking is usually stipulated as the key to lowering OER overpotentials,2,8,26 the upper right panel of Fig. 1 calls for a rethinking, in line with previous works.39 Alternative quantitative strategies have been suggested, such as the delta-epsilon optimization40 and the partial breaking of the *OOH–*OH scaling relation.41
The bottom panel of Fig. 1 shows the proportional relationship between ηOER and ESSI. There are two features worth highlighting in this panel: first, it follows from eqn (11) and (13) that ηOER ≥ ESSI in all cases. The upper limit (ESSI = ηOER) corresponds to catalysts with only one step above 1.23 eV (n = 1). Second, as ESSI approaches zero, which happens at low OER overpotentials, the dispersion among the data points decreases.36 Specifically, for ESSI ≈ 0.25 V the data points are in the range of 0.25–0.60 V, while for ESSI ≈ 1.50 V the data points are in the range of 1.50–2.30 V. This feature is encouraging, as it suggests that the predictive power of ESSI increases as the overpotentials tend to zero, that is, as materials become increasingly active.
Fig. 2 is analogous to Fig. 1, but the materials are classified by the number of electrochemical steps with free energies larger than 1.23 eV. On the upper left panel, materials with n = 3 appear to be concentrated around the top of the volcano, meaning that their OER overpotentials are low and relatively similar. This is not related to the breaking of the *OOH–*OH scaling relation, as the upper right panel shows that materials with n = 3 span a range of γOOH/OH between 0.2 and 0.6 V where numerous other materials with n = 1, 2 are also located that have large overpotentials. Conversely, the bottom panel of Fig. 2 clearly shows that materials with n = 3 generally display small ESSI values, suggesting that active OER materials tend to be electrochemically symmetric and vice versa, and that symmetry likely grows alongside n. We will come back to this point later in this manuscript.
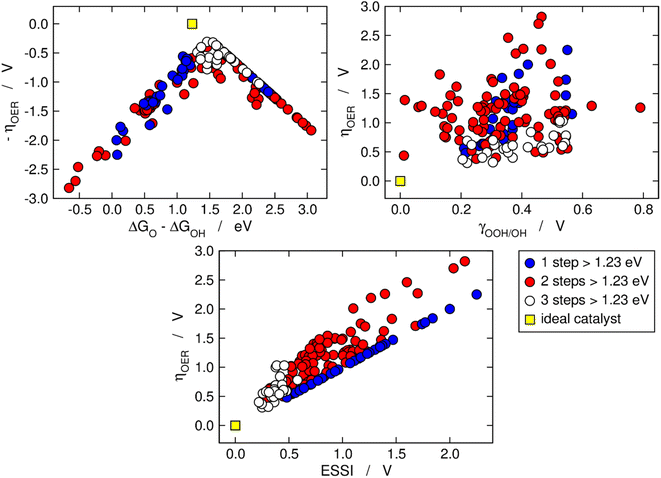 | ||
| Fig. 2 OER activity trends as in Fig. 1 but with the data classified depending on the number of electrochemical steps larger than 1.23 eV. Upper left corner: Sabatier-type activity plot for −ηOER as a function of ΔGO − ΔGOH. Upper right corner: ηOER plotted against γOOH/OH. Bottom: correlation between ηOER and ESSI. The ideal catalyst is shown in every panel for comparison. | ||
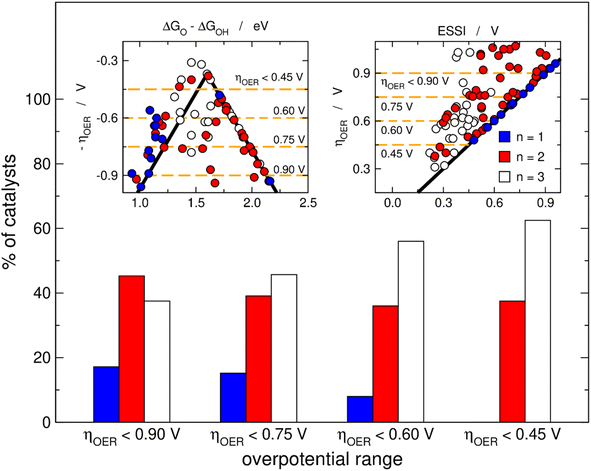
Fig. 3 helps in quantifying the general features of Fig. 2. Basically, we set four upper limits for the overpotential (0.90, 0.75, 0.60 and 0.45 V), and in each case we searched the number of materials with n = 1, 2, 3. The procedure is illustrated in the insets of Fig. 3 for the volcano and the ESSI plots, where the dashed lines correspond to the upper bounds of ηOER. We observe that as the upper limit for the overpotential decreases, that is, as the catalysts become more active, the proportion of materials with n = 3 grows (from 38% for ηOER < 0.90 V to 63% for ηOER < 0.45 V), the proportion of materials with n = 2 decreases first and then remains relatively constant (from 45 to 38%), and the proportion of materials with n = 1 decreases (from 17 to 0%).
Statistics of the reaction steps as a function of n
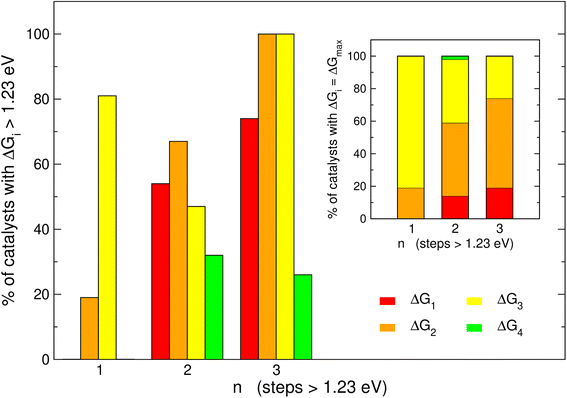
It is informative to know the most frequent reaction steps with energies over 1.23 eV when n = 1, 2, 3. We first analyze those steps separately in Fig. 4 and then altogether in Fig. 5. When n = 1, Fig. 4 shows step 3 (*O → *OOH) to be over 1.23 eV in 81% of the materials, in agreement with the upper left panel of Fig. 2 where most of the blue points are on the left of the volcano plot. Interestingly, when n = 1, no catalyst is limited by steps 1 or 4.When n = 2 the most common step above 1.23 eV is step 2 (*OH → *O, 67%), followed by steps 1 and 3 (H2O → *OH and *O → *OOH, 54 and 47%, respectively). Finally, when n = 3 the most common steps above 1.23 eV are steps 1, 2 and 3 (74, 100 and 100%, respectively). Interestingly, this shows that when n = 3, steps 2 and 3 are always above 1.23 eV. Furthermore, the inset of Fig. 4 shows that the most frequent PLS is by far step 3 when n = 1 (81%), majorly steps 2 and 3 when n = 2 (45 and 39%), and step 2 when n = 3 (56%). Hence, steps 2 and 3 are usually potential-limiting and their proportions change in opposite directions as a function of n.
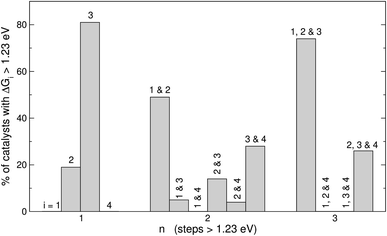
Fig. 5 displays the most frequent combinations of steps as a function of n. It is shown again that when n = 1, step 3 is the most likely step to be over 1.23 eV. For n = 2 the most frequent combination is that of steps 1 and 2 (49%), followed by the combination of steps 3 and 4 (28%). If n = 3, the combination of steps 1, 2, and 3 is found on most catalysts (74%), the combination of steps 2, 3, and 4 might be observed but to a lesser extent (26%), and other combinations are unlikely to happen. In perspective, Fig. 4 and 5 suggest that it is advisable to plan the optimization of catalysts according to n, and not simply aiming at breaking the *OOH–*OH scaling relation.
Overall OER trends as a function of n
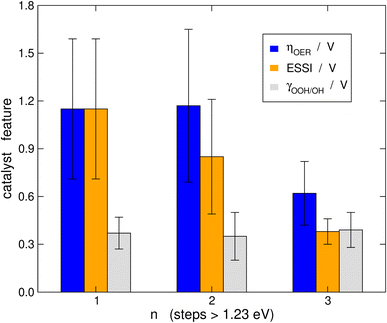
It is probably illustrative to visualize the overall trends in our data set at this point. To this end, in Fig. 6 we report the averages of ηOER, γOOH/OH, and ESSI for the cases in which n = 1, 2, 3. The error bars correspond to the standard deviations of the data. We reiterate that γOOH/OH may not be a good descriptor for the OER trends, as there are no appreciable changes in its average as a function of n and the error bars are of similar sizes. It is important to note in Fig. 6 that catalysts with n = 1, 2 span a broad range of overpotentials and ESSI values, hence the wide error bars. Admittedly, the entire groups of catalysts with n = 1, 2 are probably not well represented by their average. Nevertheless, for n = 3 the error bars are narrow and the average values of ηOER and ESSI are low. This supports our conclusion that catalysts with n = 3 are consistently more symmetric than the rest, exhibit lower overpotentials and their good OER performance does not stem from breaking the *OOH–*OH scaling relation. We note in passing that a catalyst with n = 1, 2 may reach n = 3 by means of delta-epsilon optimizations.40 Those provide in simple terms quantitative guidelines for the lowering of ηOER by weakening or strengthening the adsorption energies of *O, *OH and/or *OOH. Such guidelines can be implemented in experiments by means of tensile or compressive strain, ligand effects, electrolyte effects, ensemble effects, etc. (see ref. 40 and references therein).Connection to the free-energy span model
Recent works have highlighted the insights offered by the free-energy span model in electrocatalysis.42–44 The model is based on the largest positive free-energy difference between the species involved in a given catalytic pathway. Interestingly, the model can be used to anticipate the kinetic behavior of a catalyst on the basis of its reaction energies. We calculated the energy span of each catalyst in our database following the procedure in previous works42,43 (see Section S2†). We find that the most frequent span for catalysts with n = 1 is between *OOH and *O (ΔG3), which involves one electron transfer. In turn, the most frequent span for catalysts with n = 2 is between *O and the clean surface (ΔG1 + ΔG2), which involves two electron transfers. Finally, the most frequent span for catalysts with n = 3 is between *OOH and the clean surface (ΔG1 + ΔG2 + ΔG3), which involves three electron transfers. We note that the spans agree with the findings presented in Fig. 4, where we provided a statistical analysis of the relationship between n and the reaction free energies.Furthermore, at a potential of 1.23 V vs. RHE (ηOER = 0) the average values of the span, denoted Gmax(ηOER = 0),42,43 are 1.15 ± 0.44, 1.68 ± 0.72, and 1.14 ± 0.25 eV for materials with n = 1, 2, 3, respectively. Because of the number of electrons transferred within the span, as the overpotential grows, the average Gmax(ηOER) should decrease faster as a function of n. Indeed, when the applied potential is 1.60 V vs. RHE (ηOER = 0.37 V) the average values of Gmax(ηOER = 0.37 V) are 0.78 ± 0.44, 1.03 ± 0.67, and 0.27 ± 0.21 eV for materials with n = 1, 2, 3, respectively. In sum, more elaborate approaches such as the free-energy span model also show that materials with n = 3 are statistically more auspicious for the OER than materials with n = 1, 2.
Conclusions
The general features of OER electrocatalysts that make them active are not overly clear in the state of the art, which limits our ability to perform well-informed searches for new materials. Experimentally, the main guideline is the addition of Ru or Ir (or Ni/Fe in alkaline media), and in computational terms the main recipes are to have ΔGO − ΔGOH ≈ 1.60 eV and supposedly breaking the *OOH–*OH scaling relation.Here, a statistical analysis of nearly 160 DFT-optimized data points gathered from the literature led us to conclude that an active OER material typically has n = 3. In other words, three out of four OER electrochemical steps have free energies above 1.23 eV. Statistically, the three steps are steps 1 (H2O → *OH), 2 (*OH → *O), and 3 (*O → *OOH). The most likely potential-limiting step of an active OER material with n = 3 is step 2 (*OH → *O). Furthermore, materials with n = 3 are considerably more electrochemically symmetric than others, and their average ESSI and overpotential are descriptive of the overall class of materials, which is not the case for n = 1, 2. Finally, we found no connection between the breaking of the *OOH–*OH scaling relation and low overpotentials.
The implications of these findings are, first, that electrochemical symmetry is a suitable design criterion for OER electrode materials, and second, that the optimization of an OER catalyst with n = 1, 2 should aim for and is likely to entail an increase of n. Specific knowledge of the steps already above 1.23 eV and those close to that value provide a good starting point to devise effective, data-driven strategies for the enhancement of OER electrocatalysts.
Data availability
The free energies of *O, *OH, *OOH and of steps 1, 2, 3, and 4 of the OER, together with the values of ηOER, ESSI, γOOH/OH and the equations and results of the free-energy span model are provided in the ESI.†Author contributions
F. C. V. and F. I. conceived the idea behind this work. All authors contributed to the analysis of the data. E. R. and F. C. V. wrote the first draft of the manuscript and all authors edited its subsequent versions. F. I. and F. C. V. supervised the research work.Conflicts of interest
There are no conflicts to declare.Acknowledgements
This work received financial support from grants PID2021-127957NB-I00, TED2021-132550B-C21, PID2021-126076NB-I00, and María de Maeztu Excellence Unit CEX2021-001202-M which are funded by MCIN/AEI/10.13039/501100011033 and by the European Union. E. R. thanks the Spanish MICIUN for an FPI PhD grant (MDM-2017-0767-20-1).References
- W. T. Hong, M. Risch, K. A. Stoerzinger, A. Grimaud, J. Suntivich and Y. Shao-Horn, Toward the rational design of non-precious transition metal oxides for oxygen electrocatalysis, Energy Environ. Sci., 2015, 8, 1404–1427 RSC
.
- Z. W. She, J. Kibsgaard, C. F. Dickens, I. Chorkendorff, J. K. Nørskov and T. F. Jaramillo, Combining theory and experiment in electrocatalysis: insights into materials design, Science, 2017, 355(6321), eaad4998 CrossRef PubMed
.
- F. Dionigi, P. Strasser, F. Dionigi and P. Strasser, NiFe-Based (Oxy)hydroxide Catalysts for Oxygen Evolution Reaction in Non-Acidic Electrolytes, Adv. Energy Mater., 2016, 6, 1600621 CrossRef
.
- P. C. K. Vesborg and T. F. Jaramillo, Addressing the terawatt challenge: scalability in the supply of chemical elements for renewable energy, RSC Adv., 2012, 2, 7933–7947 RSC
.
- F. Calle-Vallejo, J. I. Martínez and J. Rossmeisl, Density functional studies of functionalized graphitic materials with late transition metals for oxygen reduction reactions, Phys. Chem. Chem. Phys., 2011, 13, 15639–15643 RSC
.
- F. Calle-Vallejo, J. I. Martínez, J. M. García-Lastra, E. Abad and M. T. M. Koper, Oxygen reduction and evolution at single-metal active sites: comparison between functionalized graphitic materials and protoporphyrins, Surf. Sci., 2013, 607, 47–53 CrossRef CAS
.
- F. Calle-Vallejo, N. G. Inoglu, H. Y. Su, J. I. Martínez, I. C. Man, M. T. M. Koper, J. R. Kitchin and J. Rossmeisl, Number of outer electrons as descriptor for adsorption processes on transition metals and their oxides, Chem. Sci., 2013, 4, 1245–1249 RSC
.
- I. C. Man, H. Y. Su, F. Calle-Vallejo, H. A. Hansen, J. I. Martínez, N. G. Inoglu, J. Kitchin, T. F. Jaramillo, J. K. Nørskov and J. Rossmeisl, Universality in Oxygen Evolution Electrocatalysis on Oxide Surfaces, ChemCatChem, 2011, 3, 1159–1165 CrossRef CAS
.
- F. Calle-Vallejo, O. A. Díaz-Morales, M. J. Kolb and M. T. M. Koper, Why is bulk thermochemistry a good descriptor for the electrocatalytic activity of transition metal oxides?, ACS Catal., 2015, 5, 869–873 CrossRef CAS
.
- M. García-Mota, A. Vojvodic, H. Metiu, I. C. Man, H. Y. Su, J. Rossmeisl and J. K. Nørskov, Tailoring the Activity for Oxygen Evolution Electrocatalysis on Rutile TiO2(110) by Transition-Metal Substitution, ChemCatChem, 2011, 3, 1607–1611 CrossRef
.
- M. Retuerto, F. Calle-Vallejo, L. Pascual, P. Ferrer, Á. García, J. Torrero, D. Gianolio, J. L. G. Fierro, M. A. Peña, J. A. Alonso and S. Rojas, Role of lattice oxygen content and Ni geometry in the oxygen evolution activity of the Ba-Ni-O system, J. Power Sources, 2018, 404, 56–63 CrossRef CAS
.
- M. Retuerto, L. Pascual, F. Calle-Vallejo, P. Ferrer, D. Gianolio, A. G. Pereira, Á. García, J. Torrero, M. T. Fernández-Díaz, P. Bencok, M. A. Peña, J. L. G. Fierro and S. Rojas, Na-doped ruthenium perovskite electrocatalysts with improved oxygen evolution activity and durability in acidic media, Nat. Commun., 2019, 10(1), 1–9 CrossRef CAS PubMed
.
- M. Retuerto, L. Pascual, O. Piqué, P. Kayser, M. A. Salam, M. Mokhtar, J. A. Alonso, M. Peña, F. Calle-Vallejo and S. Rojas, How oxidation state and lattice distortion influence the oxygen evolution activity in acid of iridium double perovskites, J. Mater. Chem. A, 2021, 9, 2980–2990 RSC
.
- M. Retuerto, F. Calle-Vallejo, L. Pascual, G. Lumbeeck, M. T. Fernandez-Diaz, M. Croft, J. Gopalakrishnan, M. A. Peña, J. Hadermann, M. Greenblatt and S. Rojas, La1.5Sr0.5NiMn0.5Ru0.5O6 Double Perovskite with Enhanced ORR/OER Bifunctional Catalytic Activity, ACS Appl. Mater. Interfaces, 2019, 11, 21454–21464 CrossRef CAS PubMed
.
- F. Calle-Vallejo, A. Krabbe and J. M. García-Lastra, How covalence breaks adsorption-energy scaling relations and solvation restores them, Chem. Sci., 2016, 8, 124–130 RSC
.
- J. K. Nørskov, J. Rossmeisl, A. Logadottir, L. Lindqvist, J. R. Kitchin, T. Bligaard and H. Jónsson, Origin of the overpotential for oxygen reduction at a fuel-cell cathode, J. Phys. Chem. B, 2004, 108, 17886–17892 CrossRef
.
- J. Rossmeisl, Z. W. Qu, H. Zhu, G. J. Kroes and J. K. Nørskov, Electrolysis of water on oxide surfaces, J. Electroanal. Chem., 2007, 607, 83–89 CrossRef CAS
.
- A. Grimaud, O. Diaz-Morales, B. Han, W. T. Hong, Y. L. Lee, L. Giordano, K. A. Stoerzinger, M. T. M. Koper and Y. Shao-Horn, Activating lattice oxygen redox reactions in metal oxides to catalyse oxygen evolution, Nat. Chem., 2017, 9(5), 457–465 CrossRef CAS PubMed
.
- R. R. Rao, M. J. Kolb, N. B. Halck, A. F. Pedersen, A. Mehta, H. You, K. A. Stoerzinger, Z. Feng, H. A. Hansen, H. Zhou, L. Giordano, J. Rossmeisl, T. Vegge, I. Chorkendorff, I. E. L. Stephens and Y. Shao-Horn, Towards identifying the active sites on RuO2(110) in catalyzing oxygen evolution, Energy Environ. Sci., 2017, 10, 2626–2637 RSC
.
- N. Vonrüti, R. Rao, L. Giordano, Y. Shao-Horn and U. Aschauer, Implications of Nonelectrochemical Reaction Steps on the Oxygen Evolution Reaction: Oxygen Dimer Formation on Perovskite Oxide and Oxynitride Surfaces, ACS Catal., 2022, 12, 1433–1442 CrossRef
.
- T. Binninger and M. L. Doublet, The Ir–OOOO–Ir transition state and the mechanism of the oxygen evolution reaction on IrO2(110), Energy Environ. Sci., 2022, 15, 2519–2528 RSC
.
- N. B. Halck, V. Petrykin, P. Krtil and J. Rossmeisl, Beyond the volcano limitations in electrocatalysis – oxygen evolution reaction, Phys. Chem. Chem. Phys., 2014, 16, 13682–13688 RSC
.
- M. J. Craig, G. Coulter, E. Dolan, J. Soriano-López, E. Mates-Torres, W. Schmitt and M. García-Melchor, Universal scaling relations for the rational design of molecular water oxidation catalysts with near-zero overpotential, Nat. Commun., 2019, 10(1), 1–9 CrossRef CAS PubMed
.
- E. Sargeant, F. Illas, P. Rodríguez and F. Calle-Vallejo, Importance of the gas-phase error correction for O2 when using DFT to model the oxygen reduction and evolution reactions, J. Electroanal. Chem., 2021, 896, 115178 CrossRef CAS
.
- E. Sargeant, F. Illas, P. Rodríguez and F. Calle-Vallejo, On the shifting peak of volcano plots for oxygen reduction and evolution, Electrochim. Acta, 2022, 426, 140799 CrossRef CAS
.
- M. T. M. Koper, Thermodynamic theory of multi-electron transfer reactions: implications for electrocatalysis, J. Electroanal. Chem., 2011, 660, 254–260 CrossRef CAS
.
- M. T. M. Koper, Analysis of electrocatalytic reaction schemes: distinction between rate-determining and potential-determining steps, J. Solid State Electrochem., 2013, 17, 339–344 CrossRef CAS
.
- V. Tripkovic and T. Vegge, Potential- and Rate-Determining Step for Oxygen Reduction on Pt(111), J. Phys. Chem. C, 2017, 121, 26785–26793 CrossRef CAS
.
- K. S. Exner, A universal descriptor for the screening of electrode materials for multiple-electron processes: beyond the thermodynamic overpotential, ACS Catal., 2020, 10, 12607–12617 CrossRef CAS
.
- K. S. Exner, The electrochemical-step asymmetry index, MethodsX, 2021, 8, 101590 CrossRef CAS PubMed
.
- X. Cheng, E. Fabbri, Y. Yamashita, I. E. Castelli, B. Kim, M. Uchida, R. Haumont, I. Puente-Orench and T. J. Schmidt, Oxygen Evolution Reaction on Perovskites: A Multieffect Descriptor Study Combining Experimental and Theoretical Methods, ACS Catal., 2018, 8, 9567–9578 CrossRef CAS
.
- S. Trasatti, Electrocatalysis in the anodic evolution of oxygen and chlorine, Electrochim. Acta, 1984, 29, 1503–1512 CrossRef CAS
.
- W. T. Hong, R. E. Welsch and Y. Shao-Horn, Descriptors of Oxygen-Evolution Activity for Oxides: A Statistical Evaluation, J. Phys. Chem. C, 2016, 120, 78–86 CrossRef CAS
.
- J. Zhang, H. b. Yang, D. Zhou and B. Liu, Adsorption Energy in Oxygen Electrocatalysis, Chem. Rev., 2022, 122(23), 17028–17072 CrossRef CAS PubMed
.
- C. H. Kjaergaard, J. Rossmeisl and J. K. Nørskov, Enzymatic versus inorganic oxygen reduction catalysts: comparison of the energy levels in a free-energy scheme, Inorg. Chem., 2010, 49, 3567–3572 CrossRef CAS PubMed
.
- N. Govindarajan, J. M. García-Lastra, E. J. Meijer and F. Calle-Vallejo, Does the breaking of adsorption-energy scaling relations guarantee enhanced electrocatalysis?, Curr. Opin. Electrochem., 2018, 8, 110–117 CrossRef CAS
.
- O. Piqué, F. Illas and F. Calle-Vallejo, Designing water splitting catalysts using rules of thumb: advantages, dangers and alternatives, Phys. Chem. Chem. Phys., 2020, 22, 6797–6803 RSC
.
- M. M. Montemore and J. W. Medlin, Scaling relations between adsorption energies for computational screening and design of catalysts, Catal. Sci. Technol., 2014, 4, 3748–3761 RSC
.
- K. S. Exner, Why the breaking of the OOH versus OH scaling relation might cause decreased electrocatalytic activity, Chem Catal., 2021, 1, 258–271 CrossRef CAS
.
- N. Govindarajan, M. T. M. Koper, E. J. Meijer and F. Calle-Vallejo, Outlining the Scaling-Based and Scaling-Free Optimization of Electrocatalysts, ACS Catal., 2019, 9, 4218–4225 CrossRef CAS
.
- S. Razzaq and K. S. Exner, Statistical analysis of breaking scaling relation in the oxygen evolution reaction, Electrochim. Acta, 2022, 412, 140125 CrossRef CAS
.
- K. S. Exner, A universal descriptor for the screening of electrode materials for multiple-electron processes: beyond the thermodynamic overpotential, ACS Catal., 2020, 10, 12607–12617 CrossRef CAS
.
- S. Razzaq and K. S. Exner, Materials Screening by the Descriptor Gmax(η): The Free-Energy Span Model in Electrocatalysis, ACS Catal., 2023, 1740–1758 CrossRef CAS PubMed
.
- J. Chen, Y. Chen, P. Li, Z. Wen and S. Chen, Energetic Span as a Rate-Determining Term for Electrocatalytic Volcanos, ACS Catal., 2018, 8, 10590–10598 CrossRef CAS
.
Footnote |
| † Electronic supplementary information (ESI) available. See DOI: https://doi.org/10.1039/d2sc06832j |
| This journal is © The Royal Society of Chemistry 2023 |

