 Open Access Article
Continuous nucleation of metallic nanoparticles via photocatalytic reduction†
Zoe C.
Simon
 a,
Ann Marie N.
Paterno
 a,
Kaitlyn M.
McHugh
a,
Paige J.
Moncure
a,
Kaitlyn M.
McHugh
a,
Paige J.
Moncure
 a,
Riti
Sen
a,
Samuel T.
Patton
a,
Eric M.
Lopato
a,
Riti
Sen
a,
Samuel T.
Patton
a,
Eric M.
Lopato
 b,
Savannah
Talledo
 b,
Stefan
Bernhard
 b and
Jill E.
Millstone
 *acd
*acd
aDepartment of Chemistry, University of Pittsburgh, Pittsburgh, Pennsylvania 15260, USA. E-mail: jem210@pitt.edu
bDepartment of Chemistry, Carnegie Mellon University, Pittsburgh, Pennsylvania 15213, USA
cDepartment of Chemical and Petroleum Engineering, University of Pittsburgh, Pittsburgh, Pennsylvania 15260, USA
dDepartment of Mechanical Engineering and Materials Science, University of Pittsburgh, Pittsburgh, Pennsylvania 15260, USA
First published on 15th February 2023
Abstract
Whether in organic synthesis or solar energy conversion, light can be a powerful reagent in chemical reactions and introduce new opportunities for synthetic control including duration, intensity, interval, and energy of irradiation. Here, we report the use of a molecular photosensitizer as a reducing agent in metallic nanoparticle syntheses. Using this approach, we report three key findings. (1) Nanoparticles produced by photocatalytic reduction form via a continuous nucleation mechanism, as opposed to burst and burst-like nucleation processes typically observed in metal nanoparticle syntheses. (2) Because nucleation is continuous, as long as the solution is irradiated (and there remains excess reagents in solution), nanoparticle nucleation can be turned on and off by controlling the timing and duration of irradiation, with no observable particle growth. (3) This synthetic method extends to the formation of bimetallic nanoparticles, which we show also form via a continuous nucleation pathway, and follow predicted patterns of metal incorporation as a function of the magnitude of the difference between the reduction potentials of the two metals. Taken together, these results establish a versatile synthetic method for the formation of multimetallic nanoparticles using visible light.
Introduction
The power to convert between visible light and chemical energy has been harnessed across chemistry, from solar cells1–4 to photoredox catalysis.5–7 In comparison, light-driven formation of nanoparticles (NPs) remains limited in scope, where the majority of reported syntheses are driven by localized surface plasmon resonances (LSPR) from existing or developing seed particles.8–11 Though LSPR-driven NP formations have now been studied for almost two decades,11–14 few investigations have used molecular photochemistry, and specifically photoreduction, to drive NP formation.15–19 Yet using these strategies, such as molecular photosensitizers (PSs) to reduce metal ions, has several advantages, including the ability to control reaction outcomes via irradiation wavelength, intensity, and timing, as well as the photoredox properties of the PS, among other parameters.One particularly interesting approach would be single-electron-transfer reactions via molecular PSs, because typical PSs used in photoredox chemistry are poor reducing agents in the ground state, but upon irradiation with visible light are converted into strongly reducing species.5 This ability to activate metal ion reduction only during irradiation would allow for the photo-titration of electrons into the reaction, offering unprecedented control over ion reduction, and ultimately the kinetics of NP formation overall.
Here, we describe the photocatalytic synthesis of both mono and bimetallic NPs using a molecular PS, and report three primary findings. First, NP formation via photocatalytic reduction follows a continuous nucleation pathway, as opposed to burst and burst-like nucleation pathways typically observed in traditional chemical reduction syntheses.20–23 Second, we show that NP formation can be turned on and off by controlling the timing and duration of irradiation, and that these on/off intervals do not impact the final NP size. Finally, we demonstrate the versatility of this synthetic approach by synthesizing a suite of bimetallic NPs, and show that these systems also follow a continuous nucleation pathway. Taken together, these results demonstrate a promising NP formation route with unprecedented temporal control and good initial substrate versatility.
Results and discussion
Our photocatalytic reduction method for NP formation uses five reagents: a molecular photosensitizer (PS) as the metal ion reductant, triethanolamine (TEOA) as the sacrificial reductant (SR) to reductively quench the PS,24 the metal ion precursor(s) of interest, and poly(ethylene glycol) methyl ether thiol (PEGSH), which is a capping ligand to stabilize resulting NPs (Fig. 1). The PS was chosen for these studies because it has a long-lived excited state (1027 ns), is a strong, one electron reductant in the photo-reduced state (−1.484 V vs. SCE), and is stable in polar organic solvents.25 TEOA was chosen as the SR because it is well studied and known to reductively quench the chosen PS.25 PEGSH was used as the capping ligand because it is known to stabilize a wide range of mono and bimetallic NPs.26–29 Experiments are carried out in acetonitrile due to the solubility of the reagents and the wide electrochemical window of acetonitrile (approximately −2 and +2 V vs. SCE).30 The reagents are added serially to glass vials situated in a home-built photoreactor (Fig. 1). | ||
| Fig. 1 Scheme of the photoreactor and photocatalytic cycle. Vials are irradiated from the bottom with blue-light LEDs (λ = 445 ± 5 nm) which excite the Ir-based molecular photosensitizer (PS). The PS is then reductively quenched by triethanolamine (TEOA).31 | ||
Once combined, the solutions are irradiated using two blue-light LEDs (445 ± 5 nm/100 W) for varying lengths of time. In the absence of the LED light source, no discernible features or changes are observed in the extinction spectrum of the solutions, indicating NP nucleation has not been initiated (Fig. S1†). However, after irradiating the samples a broad extinction feature from approximately 500–540 nm (λmax = 524.6 ± 0.6 nm) is observed, suggesting the formation of NPs. The mechanism of metal ion reduction in this photocatalytic system has been studied in previous work.32,33 Briefly, the PS is excited by incident light, and is then reductively quenched by the SR, TEOA. The photoreduced PS then drives the metal reduction process.32,33 The mechanism of subsequent reductions is at this point unknown, but it is speculated that the reaction proceeds through disproportionation of chloro-bridged dimers.31 Initially, we chose to study Au NP nucleation, as the size and concentration dependence of the Au plasmon wavelength and intensity allows for tracking of both the evolution of size and concentration of the NPs using extinction spectroscopy. Using this system, we then tracked the formation, size, and size distribution of the Au NPs as a function of irradiation time.
Irradiation time is a unique factor that can be used to control metal ion reduction via a photocatalytic approach. In these syntheses, unlike traditional chemical reduction-based syntheses, the generation of reducing electrons is triggered only by light, and due to the catalytic nature of our system, those electrons are continuously produced as long as the solution is irradiated (and there remains excess SR). We analyzed Au NP formation by extinction spectroscopy and transmission electron microscopy (TEM) from 10 min to 48 h of irradiation, and recorded average diameters for 13 timepoints in that time range (Fig. 2A and C). After initial NP formation, NP size does not increase over 48 hours of irradiation. However, NP concentration increases with irradiation as indicated by a progressive increase in intensity at a constant λmax (524.6 ± 0.6 nm, N.B. a slight decrease in O.D. is observed at 48 h, likely due to ripening processes as indicated by the decreased spectral breadth of the LSPR peak, Fig. 2B and S2†).
 | ||
| Fig. 2 (A) Representative transmission electron microscopy (TEM) micrograph of Au NPs after irradiation for 1 h. For TEM micrographs and size histograms of all time points, see Fig. S3 and S4.† (B) Optical density (O.D.) at λmax for the reaction as a function of irradiation time. Each point represents the average of three independent trials, error bars represent the standard error. For full extinction spectra, see Fig. S2.† (C) Box and whisker plot showing the evolution of NP diameter as a function of irradiation time; horizontal red lines represent the median, bottom and top of the box represents first and third quartiles, respectively, whiskers represent 1.5 times the interquartile range, red crosses represent statistical outliers. | ||
This increase in NP concentration, but no observable change in NP size, is markedly different from size evolution observed in chemical reduction syntheses.34–36 Therefore, we further examined not only NP size, but also NP size distributions in order to identify any patterns in either size or size distribution that would comment on the nucleation and growth processes occurring in solution during the irradiation period. For example, if size distributions were progressively more skewed toward larger sizes as a function of increasing irradiation time, then even if the mean did not significantly change, the shift in NP size distribution would indicate simultaneous growth and nucleation of NPs. Using a box and whisker plot analysis (Fig. 2C), we do not observe any consistent skew of the NP size distributions, and no consistent trend in either increasing or decreasing average NP diameter as a function of irradiation time. The similar mean diameters and size distributions indicate both limited growth and also limited ripening processes over the irradiation time and suggest a continuous nucleation mechanism of NP formation in these syntheses.
Current nucleation models to describe metal NP formation in chemical reduction driven syntheses (e.g. La Mer or Finke–Watzky) predict an increase in NP size over time.20–22,37 In contrast, the average diameter of NPs formed in this photocatalytic system remains statistically the same over the irradiation time, and instead only the concentration of NPs increases. This marked difference in size evolution suggests that nucleation continues, while growth largely stops (likely by a combination of ligand capping and a limited reduced ion concentration afforded by the light-driven reduction mechanism).
A photo-driven continuous nucleation pathway is exciting because it should offer the potential to start, stop, and/or isolate the reaction products with exceptional precision by controlling irradiation duration. For example, we should be able to achieve the same NP results (for example, NP size) for a set amount of irradiation time, regardless of the intervals over which that irradiation is applied, if NP size evolution is not occurring when the samples are protected from light. To test whether our photocatalytic method can achieve this “turn-on, turn-off” performance, we exposed reaction mixtures to a set amount of irradiation time, but changed the intervals of irradiation. For example, we irradiate the reaction mixture for 10 minutes (tx = 10 min, Fig. 3, purple box) and then turn off the irradiation source and protect the solution from light and heat for 24 h (tx + 24 h dark, Fig. 3, light blue box). This solution is then removed from the dark and reintroduced to irradiation for 23 h and 50 minutes for a total irradiation time of 24 h (tx + 24 h dark + ty, where tx = 10 min and ty = 23 h 50 min, Fig. 3, orange box). We compare these noncontinuous irradiation samples to samples irradiated for 24 h continuously (tx = 24 h, Fig. 3, purple box). We also perform this experiment for samples where tx = 1 and 4 h, in addition to the 10 min experiment discussed above. In all cases, we observe good agreement in the NP size between the samples with interrupted irradiation intervals, and the continuous 24 h irradiation results (Fig. 3), indicating metal reduction and NP formation only occur during irradiation. These findings demonstrate the ability to suspend and reinitiate the NP formation reaction with minimal impact on NP morphology.
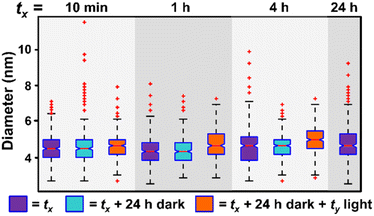 | ||
| Fig. 3 Box and whisker plot analysis of NP diameter as a function of irradiation interval. In samples represented by purple boxes, the sample is irradiated for tx amount of time, where tx = 10 min, 1 h, 4 h, or 24 h (24 h is the control). The NPs are then washed and analyzed by extinction spectroscopy and their diameter measured by TEM. In samples represented by light blue boxes, each sample is irradiated for tx amount of time and then held in the dark until a total of 24 h. At 24 h, these samples are washed and analyzed. In samples represented by orange boxes, NPs have been irradiated for tx amount of time, held for 24 h in the dark, and then irradiated for the corresponding amount of time (ty) such that total irradiation time equals 24 h for all samples (i.e. tx + ty = 24 h). For TEM micrographs and size histograms of all time points, see Fig. S5 and S6.† | ||
Thus far, we have shown the photocatalytic reduction synthesis approach yields a NP formation process that is consistent with a continuous nucleation pathway. This pathway offers the unique ability to control NP concentration using irradiation time, which allows for the continuous production of NPs as long as the reaction is exposed to the irradiation source, regardless of the intervals of irradiation. While NP size remains constant throughout our reactions, the rate of NP formation changes as a function of irradiation time, until the concentration plateaus ∼16 h (Fig. 2B). We hypothesized that this decrease in nucleation rate was due to the depletion of a reagent. To test this hypothesis, the reaction vials were spiked with additional reagents (TEOA, PS, and Au3+) at 4 h and 16 h of irradiation to see if the initial reaction rate could be recovered. While the addition of TEOA and PS alone did not result in an increase in NP formation rate (Fig. S8†), the addition of Au3+ solution led to a full rate recovery (Fig. 4A and B). This finding reveals that the formation rate is limited by Au3+ concentration under our reaction conditions. Further demonstrating the temporal versatility of this reaction, we measured similar final NP concentrations for each experiment containing the same Au3+ concentration, regardless of whether the additional Au3+ was added at 4 hours of irradiation or 16 hours of irradiation (Fig. 4).
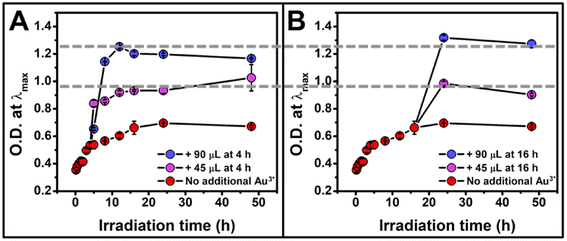 | ||
| Fig. 4 Optical density at λmax for the reaction as a function of irradiation time for a total irradiation time of 48 h when additional Au3+ is added at (A) 4 h of irradiation and (B) 16 h of irradiation showing a recovery of reaction rate after the addition of metal precursor, as well as an O.D. determined by the total concentration of Au3+ added, regardless of the timing of addition. The reaction containing no additional Au3+ is represented in red, the addition of 45 μL in purple, and 90 μL in blue. Each point represents the average of three independent trials, error bars represent the standard error. For TEM micrographs, size histograms, and extinction spectra, see Fig. S9–S11.† | ||
While the addition of Au3+ recovers the reaction rate and controls the concentration of NPs formed, some NP growth is observed (Fig. 5), unlike in the initial experiments where the concentration of Au is held constant, and the only observable process is homogeneous nucleation and no observable NP growth. The detection of heterogeneous nucleation upon addition of more metal precursor is reassuring because it is the thermodynamically favored process, and should compete with homogeneously nucleated new NPs. Indeed, the ability to initiate heterogeneous nucleation with the addition of more metal precursor is an exciting component of this synthesis, as it can be leveraged as a post-synthetic modifier to access more complex NP architectures, though these experiments are outside the scope of this report.
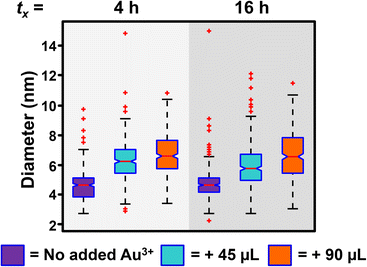 | ||
| Fig. 5 Box and whisker plot analysis of the diameter of Au NPs after no additional Au3+ is added (purple box), 45 μL of Au3+ is added at tx irradiation time (tx = 4 or 16 h, light blue box), and 90 μL of Au3+ is added at tx irradiation time (orange box). Total irradiation time equals 8 h when tx = 4 h and 24 h when tx = 16 h. For TEM micrographs, size histograms, and extinction spectra, see Fig. S9–S11.† | ||
A first step toward accessing more complex NP architectures is to test the substrate versatility of this synthetic method. To begin, nine bimetallic combinations were chosen for analysis: Au/Cd, Au/Fe, Au/Co, Au/Ni, Au/Cu, Au/Ag, Au/Pt, Au/Pd, and Ag/Pt (Fig. 6). Au and Ag-based bimetallics were used because their synthesis and composition architectures have been well studied.38–40 To synthesize this suite of NPs, metal ion precursors were used in a 1![[thin space (1/6-em)]](https://www.rsc.org/images/entities/char_2009.gif) :
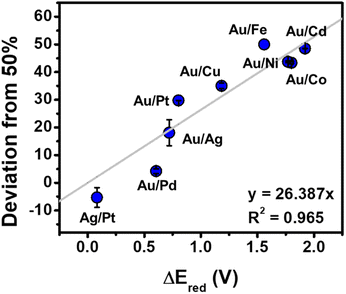
:![[thin space (1/6-em)]](https://www.rsc.org/images/entities/char_2009.gif) 1 molar ratio. After the addition of all reagents to the vials, the vials were irradiated in the photoreactor for 1 h. NPs were observed in all cases, and the resulting NPs were characterized by extinction spectroscopy, TEM, and inductively coupled plasma optical emission spectroscopy (ICP-OES), (Fig. S12–S14 and Table S1†). Sizes were composition dependent, with average diameters ranging from 2.4 ± 0.4 to 5.6 ± 1.1 nm (see Fig. S13 and S14† for TEM analysis and size histograms for each composition). As expected from conventional syntheses, we observed good agreement between metal incorporation and the difference in reduction potential of the two metal precursors (ΔEred) (Fig. 7).
1 molar ratio. After the addition of all reagents to the vials, the vials were irradiated in the photoreactor for 1 h. NPs were observed in all cases, and the resulting NPs were characterized by extinction spectroscopy, TEM, and inductively coupled plasma optical emission spectroscopy (ICP-OES), (Fig. S12–S14 and Table S1†). Sizes were composition dependent, with average diameters ranging from 2.4 ± 0.4 to 5.6 ± 1.1 nm (see Fig. S13 and S14† for TEM analysis and size histograms for each composition). As expected from conventional syntheses, we observed good agreement between metal incorporation and the difference in reduction potential of the two metal precursors (ΔEred) (Fig. 7).
 | ||
| Fig. 6 Colloidal solutions of Au/Cd, Au/Fe, Au/Co, Au/Ni, Au/Cu, Au/Ag, Au/Pt, Au/Pd, and Ag/Pt prepared via photocatalytic reduction and corresponding TEM micrographs. Scale bar represents 2 nm. For full extinction spectra, wide-field TEM, size histograms, and ICP-OES, see Fig. S12–S14 and Table S1.† | ||
The evolution of NP stoichiometry and size as a function of irradiation time was examined in order to determine whether a continuous nucleation mechanism also occurs in the bimetallic NP systems. For example, in the Au/Pt system, we observe an increase in Pt incorporation as a function of increasing irradiation time (Fig. 8A) with no observable change in NP diameter (Fig. 8B). The increase in Pt concentration over time can be attributed to the difference in the reduction potentials of the metals (ΔEred = 0.802 V (ref. 41)). Because Au3+ has a higher reduction potential than Pt4+, it reduces at a faster rate,42 and as a result, the concentration of Au in solution is depleted faster than Pt. This depletion allows more Pt incorporation at longer irradiation times by definition of available concentrations of reduced metal atoms. Here, both the consistency of NP size over irradiation time, and the relative metal incorporation values as a function of irradiation time suggest NP formation via continuous nucleation, and this trend was also observed in the other metal combinations analyzed (i.e., Au/Cu, Au/Ag, Au/Pd, Au/Co, and Ag/Pt, Fig. S15†).
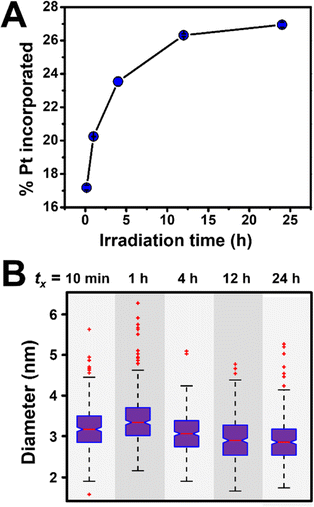 | ||
Fig. 8 (A) Pt incorporation measured by ICP-OES as a function of irradiation time for Au/Pt NPs synthesized via photocatalytic reduction in a 1![[thin space (1/6-em)]](https://www.rsc.org/images/entities/char_2009.gif) : :![[thin space (1/6-em)]](https://www.rsc.org/images/entities/char_2009.gif) 1 initial molar ratio. Each point represents the average of three independent trials, error bars represent the standard error. (B) Corresponding box and whisker plot where tx = total irradiation time (10 min, 1 h, 4 h, 12 h, or 24 h). For TEM micrographs and size histograms for all time points, see Fig. S16 and S17.† 1 initial molar ratio. Each point represents the average of three independent trials, error bars represent the standard error. (B) Corresponding box and whisker plot where tx = total irradiation time (10 min, 1 h, 4 h, 12 h, or 24 h). For TEM micrographs and size histograms for all time points, see Fig. S16 and S17.† | ||
Conclusions
In summary, we report a synthetic method for the preparation of metallic NPs using photocatalytic reduction via the excitation of a molecular PS with visible light. We show that by combining the benefits of visible-light driven reactions with catalytic reactions, we can generate a synthesis with several intriguing aspects. First, the reaction follows a continuous nucleation pathway, which allows for the opportunity to control NP formation as a function of time. Second, because the reaction is photo-driven, NP nucleation can be turned on and off using only light without impacting NP size. Third, the concentration of metal precursor added during the reaction changes the amount of NP growth, which can be leveraged in future studies to access more complex NP morphologies. Finally, these results, including continuous NP formation, were observed in a variety of bimetallic NP systems as well, showing reasonable substrate versatility.Data availability
Supporting and additional data can be found in the ESI† including extended TEM, extinction spectroscopy, and ICP-OES analyses and control experiments.Author contributions
The manuscript was written through contributions of all authors. All authors have given approval to the final version of the manuscript.Conflicts of interest
There are no conflicts to declare.Acknowledgements
This work was supported in part by the University of Pittsburgh and Carnegie Mellon University. This research was supported by the U.S. Department of Energy, Office of Science, Office of Basic Energy Sciences, Data Science for Knowledge Discovery for Chemical and Materials Research program, under Award DE-SC0020392. We are also grateful to Leo B. and Teresa Y. Wegemer for their generous support.Notes and references
- J. A. Nelson, The Physics of Solar Cells, World Scientific Publishing Company, 2003 Search PubMed.
- J. J. Yoo, G. Seo, M. R. Chua, T. G. Park, Y. Lu, F. Rotermund, Y.-K. Kim, C. S. Moon, N. J. Jeon and J.-P. Correa-Baena, Nature, 2021, 590, 587–593 CrossRef CAS PubMed.
- Y. H. Jang, Y. J. Jang, S. Kim, L. N. Quan, K. Chung and D. H. Kim, Chem. Rev., 2016, 116, 14982–15034 CrossRef CAS PubMed.
- S. Gunes, Chem. Rev., 2003, 107, 1324–1338 CrossRef PubMed.
- C. K. Prier, D. A. Rankic and D. W. MacMillan, Chem. Rev., 2013, 113, 5322–5363 CrossRef CAS PubMed.
- N. A. Romero and D. A. Nicewicz, Chem. Rev., 2016, 116, 10075–10166 CrossRef CAS PubMed.
- S. P. Pitre and L. E. Overman, Chem. Rev., 2021, 122, 1717–1751 CrossRef PubMed.
- R. Jin, Y. Charles Cao, E. Hao, G. S. Métraux, G. C. Schatz and C. A. Mirkin, Nature, 2003, 425, 487–490 CrossRef CAS PubMed.
- J. Qiu, Y.-C. Wu, Y.-C. Wang, M. H. Engelhard, L. McElwee- White and W. D. Wei, J. Am. Chem. Soc., 2013, 135, 38–41 CrossRef CAS PubMed.
- Y. Zhai, J. S. DuChene, Y.-C. Wang, J. Qiu, A. C. Johnston- Peck, B. You, W. Guo, B. DiCiaccio, K. Qian and E. W. Zhao, Nat. Mater., 2016, 15, 889–895 CrossRef CAS PubMed.
- M. Maillard, P. Huang and L. Brus, Nano Lett., 2003, 3, 1611–1615 CrossRef CAS.
- C. Xue, G. S. Métraux, J. E. Millstone and C. A. Mirkin, J. Am. Chem. Soc., 2008, 130, 8337–8344 CrossRef CAS PubMed.
- R. Kamarudheen, G. Kumari and A. Baldi, Nat. Commun., 2020, 11, 1–10 CrossRef PubMed.
- R. Kamarudheen, G. W. Castellanos, L. P. Kamp, H. J. Clercx and A. Baldi, ACS Nano, 2018, 12, 8447–8455 CrossRef CAS PubMed.
- P. Zhang, H. Liu and X. Li, Appl. Surf. Sci., 2021, 535, 147720 CrossRef CAS.
- G. Wei, L. Wang, L. Sun, Y. Song, Y. Sun, C. Guo, T. Yang and Z. Li, J. Phys. Chem. C, 2007, 111, 1976–1982 CrossRef CAS.
- Z. C. Simon, E. M. Lopato, M. Bhat, P. J. Moncure, S. M. Bernhard, J. R. Kitchin, S. Bernhard and J. E. Millstone, ChemCatChem, 2022, 14, e202101551 CrossRef CAS.
- E. M. Lopato, E. A. Eikey, Z. C. Simon, S. Back, K. Tran, J. Lewis, J. F. Kowalewski, S. Yazdi, J. R. Kitchin, Z. W. Ulissi, J. E. Millstone and S. Bernhard, ACS Catal., 2020, 10, 4244–4252 CrossRef CAS.
- M. Bhat, E. M. Lopato, Z. C. Simon, J. E. Millstone, S. Bernhard and J. R. Kitchin, React. Chem. Eng., 2022, 7, 599–608 RSC.
- M. A. Watzky and R. G. Finke, J. Am. Chem. Soc., 1997, 119, 10382–10400 CrossRef CAS.
- W. W. Laxson and R. G. Finke, J. Am. Chem. Soc., 2014, 136, 17601–17615 CrossRef CAS PubMed.
- V. K. LaMer and R. H. Dinegar, J. Am. Chem. Soc., 1950, 72, 4847–4854 CrossRef CAS.
- V. K. LaMer, Ind. Eng. Chem., 1952, 44, 1270–1277 CrossRef CAS.
- H. N. Kagalwala, D. N. Chirdon and S. Bernhard, Solar Fuel Generation: Structural and Functional Evolution of Iridium Photosensitizers, 2017 Search PubMed.
- P. N. Curtin, L. L. Tinker, C. M. Burgess, E. D. Cline and S. Bernhard, Inorg. Chem., 2009, 48, 10498–10506 CrossRef CAS PubMed.
- L. E. Marbella, C. M. Andolina, A. M. Smith, M. J. Hartmann, A. C. Dewar, K. A. Johnston, O. H. Daly and J. E. Millstone, Adv. Funct. Mater., 2014, 24, 6532–6539 CrossRef CAS.
- L. E. Marbella, D. M. Chevrier, P. D. Tancini, O. Shobayo, A. M. Smith, K. A. Johnston, C. M. Andolina, P. Zhang, G. Mpourmpakis and J. E. Millstone, J. Am. Chem. Soc., 2015, 137, 15852–15858 CrossRef CAS PubMed.
- A. M. Smith, L. E. Marbella, K. A. Johnston, M. J. Hartmann, S. E. Crawford, L. M. Kozycz, D. S. Seferos and J. E. Millstone, Anal. Chem., 2015, 87, 2771–2778 CrossRef CAS PubMed.
- K. Yu, G. You, L. Polavarapu and Q.-H. Xu, J. Phys. Chem. C, 2011, 115, 14000–14005 CrossRef CAS.
- S. Creager, in Handbook of electrochemistry, Elsevier, 2007, pp. 57–72 Search PubMed.
- A. C. Brooks, K. Basore and S. Bernhard, Inorg. Chem., 2013, 52, 5794–5800 CrossRef CAS PubMed.
- L. L. Tinker, N. D. McDaniel, P. N. Curtin, C. K. Smith, M. J. Ireland and S. Bernhard, Chem.–Eur. J., 2007, 13, 8726–8732 CrossRef CAS PubMed.
- S. DiLuzio, T. U. Connell, V. Mdluli, J. F. Kowalewski and S. Bernhard, J. Am. Chem. Soc., 2022, 144, 1431–1444 CrossRef CAS PubMed.
- N. R. Jana, L. Gearheart and C. J. Murphy, Langmuir, 2001, 17, 6782–6786 CrossRef CAS.
- J. Turkevich, P. C. Stevenson and J. Hillier, Discuss. Faraday Soc., 1951, 11, 55–75 RSC.
- S. Peng, Y. Lee, C. Wang, H. Yin, S. Dai and S. Sun, Nano Res., 2008, 1, 229–234 CrossRef CAS.
- B. M. McMurtry, K. Qian, J. K. Teglasi, A. K. Swarnakar, J. De Roo and J. S. Owen, Chem. Mater., 2020, 32, 4358–4368 CrossRef CAS.
- M. A. Bratescu, O. Takai and N. Saito, J. Alloys Compd., 2013, 562, 74–83 CrossRef CAS.
- R. Ferrando, J. Jellinek and R. L. Johnston, Chem. Rev., 2008, 108, 845–910 CrossRef CAS PubMed.
- K. D. Gilroy, A. Ruditskiy, H.-C. Peng, D. Qin and Y. Xia, Chem. Rev., 2016, 116, 10414–10472 CrossRef CAS PubMed.
- W. M. Haynes, D. R. Lide and T. J. Bruno, CRC Handbook of Chemistry and Physics: A Ready-Reference Book of Chemical and Physical Data, CRC Press, 2011 Search PubMed.
- A. J. Bard, L. R. Faulkner and H. S. White, Electrochemical methods: fundamentals and applications, John Wiley & Sons, 2022 Search PubMed.
Footnote |
| † Electronic supplementary information (ESI) available. See DOI: https://doi.org/10.1039/d2sc06980f |
| This journal is © The Royal Society of Chemistry 2023 |

