 Open Access Article
Excited state energy landscape of phosphorescent group 14 complexes†
Philipp
Sikora
,
Robert
Naumann
 ,
Christoph
Förster
 * and
Katja
Heinze
 *
*
Johannes Gutenberg University Mainz, Duesbergweg 10-14, 55128 Mainz, Germany. E-mail: christoph.foerster@uni-mainz.de; katja.heinze@uni-mainz.de
First published on 30th January 2023
Abstract
Great progress has been achieved on phosphorescent or photoactive complexes of the Earth-abundant transition metals, while examples for phosphorescent heavy main group element complexes are rare, in particular for group 14 complexes in the oxidation state +II. The known compounds often show only weak phosphorescence with fast non-radiative deactivation. The underlying photophysical processes and the nature of the phosphorescent electronic states have remained essentially unexplored. The present combined photophysical and theoretical study on tin(II) and lead(II) complexes E(bpep) with the dianionic tridentate ligand bpep2− (E = Sn, Pb; H2bpep = 2-[1,1-bis(1H-pyrrol-2-yl)ethyl]pyridine) provides unprecedented insight in the excited state energy landscape of tetrel(II) complexes. The tin complex shows green intraligand charge transfer (ILCT) phosphorescence both in solution and in the solid state. In spite of its larger heavy-atom effect, the lead complex only shows very weak red phosphorescence from a strongly distorted ligand-to-metal charge transfer (LMCT) state at low temperatures in the solid state. Detailed (TD-)DFT calculations explain these observations and delineate the major path of non-radiative deactivation via distorted LMCT states. These novel insights provide rational design principles for tetrel(II) complexes with long-lived phosphorescence.
1 Introduction
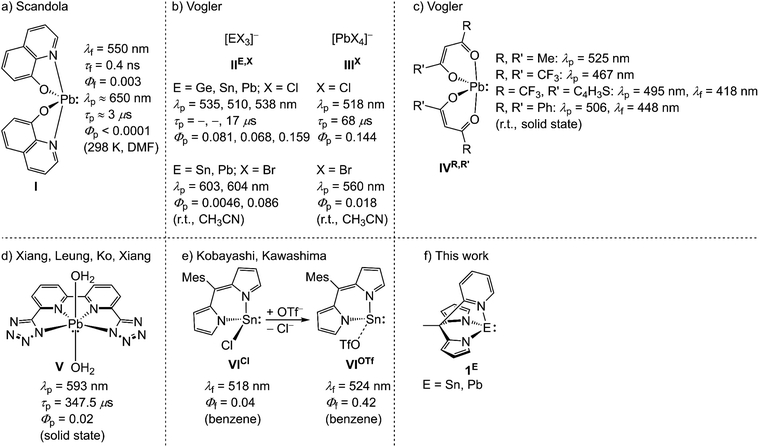
Photoluminescent, in particular phosphorescent and photoactive transition metal complexes (TMCs) of the Earth-abundant elements, mainly 3d elements, evolved to a potential alternative to the precious elements, e.g. ruthenium, iridium or platinum.1–5 The key prerequisite for applications in bimolecular photochemical reactions is a sufficiently long lifetime of the photoactive excited state (ES). This can be achieved for ESs with different spin multiplicities to the ground state (GS), rendering non-radiative and radiative processes between ES and GS spin-forbidden, thus extending the ES lifetime.6 In order to access ESs of different spin multiplicity to the GS and the initially populated Franck–Condon state, intersystem crossing (ISC) must be effective. ISC rates increase for ES's wavefunctions with high metal character invoking spin–orbit coupling (SOC) by a heavy-atom effect or by effective spin–vibronic coupling.7 The research on photoactive 3d or 4d TMCs envisaged mainly weakly distorted metal-to-ligand (MLCT) or ligand-to-metal charge transfer (LMCT) and intraconfigurational spin-flip states as potential photoactive states to invoke a high metal character for fast ISC.1–3 In pseudo-octahedral 3dn TMCs (n = 1–9) the high density of low-lying strongly distorted metal-centered (MC) states typically enables fast non-radiative deactivation of CT states.1–3 For photoactive pseudo-tetrahedral d10 copper(I) complexes, the flattening distortion of the photoluminescent 3MLCT states, can facilitate fast non-radiative deactivation.8–10 The photoluminescence lifetimes of pseudo-tetrahedral copper(I) complexes are also very sensitive to coordinating solvents and anions in the flattened 3MLCT states.9,11 This illustrates the interplay between ES ordering and ES distortion, which depends on the coordination geometry and rigidification of the complex. For 3d TMCs, the underlying photophysical processes are well understood and ground-breaking progress was achieved in the last few years.1–5Examples of heavy main group complexes, mainly group 14 and 15, showing beside conventional fluorescence,12,13 phosphorescence and/or thermally activated delayed fluorescence (TADF),10,14–16 are rare.17–19 Emission is often limited to frozen solutions or even to the solid state, precluding bimolecular reactivity.13,17–19 Complexes of group 15 elements, in particular bismuth(III) with 6s2 electron configuration, can show phosphorescence.20–28 The oxidation state +IV dominates in tetrel group 14 complexes with potentially photoactive triplet states29–35 and fluorescent or photoluminescent states of yet unknown character.36–44 Photoluminescent tetrel(II) complexes are very scarce. Scandola and co-workers reported for Pb(QO)2I (QOH = 8-hydroxyquinoline) a weak green fluorescence and an even weaker red phosphorescence from intraligand (IL) states in N,N-dimethylformamide (DMF, 298 K; λf = 550 nm, τf = 0.4 ns, Φf ≈ 0.003; λp ≈ 650 nm, τp ≈ 3 μs, Φp < 0.0001) and glassy ethanol (77 K; λf = 510 nm, τf < 20 ns; λp ≈ 610 nm, τp = 180 μs), respectively (Scheme 1a).45 The triplet state of the Pb complex I is efficiently quenched by energy transfer (EnT) in a bimolecular reaction with [Cr(CN)6]3− in DMF with a quenching rate constant of kq = 3.7 × 10⁸ M−1 s−1.45 Studies by Vogler and co-workers on photoluminescent halido germanium(II), tin(II) and lead(II) complexes [EX3]−IIE,X (E = Ge–Pb: X = Cl; E = Sn, Pb: X = Br) and [PbX4]2−IIIX (X = Cl, Br) revealed phosphorescence from MC states at 510–604 nm after excitation with UV light in fluid acetonitrile solution (Scheme 1b).46,47 The population of the emissive triplet state with a s1p1 electron configuration, is accompanied with large structural reorganization from C3v to D3h symmetry for [EX3]− ions.46 This distortion enables efficient non-radiative deactivation of the triplet state. In the series [EX3]− (E = Ge–Pb, X = Cl, Br), the Sn complexes exhibit short photoluminescence lifetimes below the detection limit and the lowest quantum yields (Φp = 0.068 (Cl); Φp = 0.0046 (Br)) compared to Ge (Φp = 0.081 (Cl)) and Pb (τp = 17 μs, Φp = 0.159 (Cl); Φp = 0.086 (Br)).46,47 Despite the short photoluminescence lifetime, [SnCl3]− undergoes bimolecular photo-oxidation reactions to SnOCl2 with oxygen after excitation with UV-C light (λex = 254 nm).48
Bis(β-diketonato) lead(II) complexes IVR,R′ prepared by Vogler and co-workers show blue to green intraligand (IL) phosphorescence in the solid state. The phosphorescence is diminished in ethanol solution at r.t. The respective hexafluoroacetylacetonato tin(II) complex is not photoluminescent (Scheme 1c).27,49 The very weak phosphorescence of the β-diketonato lead(II) complexes is attributed to a large geometric reorganization leading to fast non-radiative relaxation.49 Unfortunately, no photoluminescence lifetimes and quantum yields were reported for these compounds. A series of coordination polymers of lead(II) with polydentate tetrazolato ligands are phosphorescent from 3IL, 3MC and 3MLCT states with admixed 3XLCT (halide-to-ligand CT) character. The photoluminescence lifetimes amount up to τp = 1.55 ms and a maximum quantum yield of Φp = 0.165 in the solid state.50 The molecular congener V with 6,6′-bis(1H-tetrazol-5-yl)-2,2′-bipyridine as proligand shows 3MLCT phosphorescence with significantly lower photoluminescence quantum yield in the solid state (λp = 593 nm, τp = 347.5 μs, Φp = 0.02; Scheme 1d).50 Substituting a chlorido ligand with a weakly coordinating triflato (OTf−) ligand, increases the fluorescence quantum yield of a dipyrromethene tin(II) complex from 0.04 (VICl) to 0.42 (VIOTf) with a slight bathochromic shift of the fluorescence from λf = 518 nm to λf = 524 nm (Scheme 1e).51 The significant increase in quantum yield is ascribed on the basis of an inspection of the GS molecular orbitals from density functional theory (DFT) calculations to a shift of a non-photoluminescent MLCT state to higher energies upon stabilising the occupied non-bonding tin-centered orbital after Cl−/OTf− exchange.51
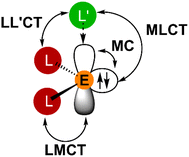
Heavy tetrel(II) complexes are related to tetrylenes, the heavier carbene homologues.52–56 The singlet ground state of heavier tetrylenes is described by a metal-centered occupied orbital with high s-character and a vacant or donor stabilised orbital with high p-character (Fig. 1).52–56 Clearly, MC, IL, LMCT, MLCT and ligand-to-ligand charge transfer (LL'CT) states with their respective ES distortions must be considered in exploring the energy landscape of electronic states with the focus on photoluminescent and in particular phosphorescent properties (Fig. 1).
To the best of our knowledge, no combined experimental and quantum chemical studies are reported on the energy ordering and geometric distortions of excited states of photoluminescent tetrel(II) complexes. This study aims to shed more light on the underlying photophysical processes. The tripodal ligand bpep2− (H2bpep = 2-[1,1-bis(1H-pyrrol-2-yl)ethyl]pyridine)57 with electron-rich pyrrolato and electron-poor pyridine donors in combination with the heaviest tetrels Sn and Pb for a large heavy-atom effect and fast ISC was chosen for this initial study (SOC constants: ζ(Sn) = 1855 cm−1, ζ(Pb) = 5089 cm−1).58 SnII(bpep) 1Sn shows phosphorescence in the solid state and in solution, while the lead congener PbII(bpep) 1Pb with its larger heavy-atom effect is only very weakly photoluminescent. The elucidation of the different emission properties is supported by UV/vis absorption and variable-temperature steady-state and time-resolved emission spectroscopy as well as with detailed time-dependent (TD) DFT calculations.
2 Results and discussion
2.1. Synthesis, structural and spectroscopic properties
The tetrylenes EII(bpep) (E = Sn 1Sn, Pb 1Pb) are synthesised via a transamination of H2bpep57 with bis[bis(trimethylsilyl)amido]tetrel(II) compounds EII[N(SiMe3)2]2 (ref. 59) in dichloromethane as colourless, moisture sensitive solids in 74% and 63% yields, respectively (Scheme 2). Complexes 1E are poorly soluble in most organic solvents. 1Sn is well soluble in tetrahydrofuran (THF) and sparsely in toluene, while 1Pb is only soluble in dimethylsulfoxide (DMSO) among the tested solvents. 1Sn and 1Pb are fully characterised by elemental analysis, ESI+ mass spectrometry (ESI, Fig. S1 and S2†) and multinuclear (1H, 13C, 119Sn, 207Pb) NMR spectroscopy (ESI, Fig. S3–S14†). The 119Sn resonance of 1Sn appears in the similar chemical shift range of other donor stabilised dipyrrolato stannylenes (ESI, Fig. S5†).60 The solids of 1E are free of coordinating solvents, which could coordinate to the Sn or Pb atoms, as determined by 1H NMR spectroscopy and elemental analyses. This speciation is important for the discussion of the photoluminescent properties in solution and in the solid state (ESI, Fig. S3 and S9†).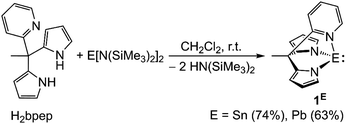 | ||
| Scheme 2 Syntheses of stannylene and plumbylene EII(bpep) (E = Sn 1Sn, Pb 1Pb) via transamination from E[N(SiMe3)2]2 and H2bpep, yields given in parentheses. | ||
Crystals of 1Sn, suitable for X-ray diffraction analyses were obtained from hot toluene. 1Sn crystallises in the trigonal space group R3 with two independent molecules 1Sn,A and 1Sn,B in the asymmetric unit (Fig. 2a; ESI, Fig. S15 and Table S1†). 1Sn,B is disordered with a pyrrolato/pyridine site occupation, so that the more precise structural parameters of 1Sn,A are discussed. Both molecules feature a distorted trigonal pyramidal coordination of the Sn atom. A further solid state structure of 1Sn could be determined from crystals, obtained from slow diethylether diffusion to a solution of 1Sn in a 1![[thin space (1/6-em)]](https://www.rsc.org/images/entities/char_2009.gif) :
:![[thin space (1/6-em)]](https://www.rsc.org/images/entities/char_2009.gif) 1 mixture of 1,4-dioxane
1 mixture of 1,4-dioxane![[thin space (1/6-em)]](https://www.rsc.org/images/entities/char_2009.gif) :
:![[thin space (1/6-em)]](https://www.rsc.org/images/entities/char_2009.gif) tetrahydrofuran. Here, 1Sn forms a centrosymmetric 1,4-dioxane (diox) bridged dimer (1Sn)2(diox) (monoclinic space group I2/a) leading to a four-coordinate tin(II) ion (Fig. 2b; ESI, Table S1†). This solid state structure indicates that 1Sn will likely form solvates in THF and THF/1,4-dioxane solutions. The 1,4-dioxane coordination with a Sn–O distance of 2.547(2) Å elongates the tin–nitrogen(pyridine) (Sn–Npy) bond from 2.317(5) Å (1Sn) to 2.375(2) Å ((1Sn)2(diox)). This Sn–Npy bond weakening arises from the competing interactions of the pyridine and 1,4-dioxane donors with the tetrel p-type orbital (Fig. 1; ESI Table S1†). This will also influence the photophysical properties of 1Sn (vide infra). The much lower solubility of 1Pb in most organic solvents prohibited growing single crystals suitable for X-ray diffraction analysis, but the NMR spectroscopic, mass spectrometric and analytical data confirm the composition and purity.
tetrahydrofuran. Here, 1Sn forms a centrosymmetric 1,4-dioxane (diox) bridged dimer (1Sn)2(diox) (monoclinic space group I2/a) leading to a four-coordinate tin(II) ion (Fig. 2b; ESI, Table S1†). This solid state structure indicates that 1Sn will likely form solvates in THF and THF/1,4-dioxane solutions. The 1,4-dioxane coordination with a Sn–O distance of 2.547(2) Å elongates the tin–nitrogen(pyridine) (Sn–Npy) bond from 2.317(5) Å (1Sn) to 2.375(2) Å ((1Sn)2(diox)). This Sn–Npy bond weakening arises from the competing interactions of the pyridine and 1,4-dioxane donors with the tetrel p-type orbital (Fig. 1; ESI Table S1†). This will also influence the photophysical properties of 1Sn (vide infra). The much lower solubility of 1Pb in most organic solvents prohibited growing single crystals suitable for X-ray diffraction analysis, but the NMR spectroscopic, mass spectrometric and analytical data confirm the composition and purity.
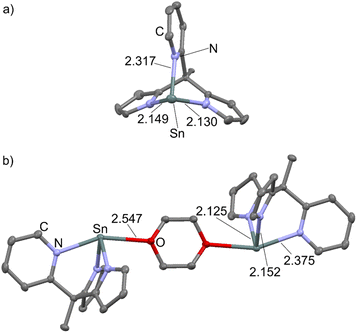 | ||
| Fig. 2 Molecular structures of (a) 1Sn and (b) of the 1,4-dioxane bridged dimer (1Sn)2(diox) with selected structural parameters in Å. H atoms omitted, thermal ellipsoids at 50% probability level. | ||
The structures of 1Sn, 1Sn(thf) and 1Pb were optimised by DFT (CPCM-(THF)-RIJCOSX-B3LYP-D3BJ-ZORA/def2-TZVPP/old-ZORA-TZVPP(Sn)/SARC-ZORA-TZVPP(Pb)). The structural parameters are well reproduced by the DFT geometry optimised structures of 1Sn (Sn–Npy: 2.341 Å) and 1Sn(thf) (Sn–Othf: 2.606 Å, Sn–Npy: 2.441 Å) as a model for (1Sn)2(diox) (Fig. 3; ESI, Table S1†). To probe the presence of different tetrahydrofuran adducts, DFT calculations on 1Sn(thf)2 were additionally performed. Two isomers cis-1Sn(thf)2 and trans-1Sn(thf)2 could be localised as local minima on the potential energy surface as van-der-Waals adducts between two and one THF molecules and 1Sn (ESI, Fig. S16†). The THF dissociation is exergonic with Gibbs free energies at 298 K for cis-/trans-1Sn(thf)2 (cis: ΔG298 = −38 kJ mol−1, trans: ΔG298 = −47 kJ mol−1) to 1Sn(thf) and THF and slightly exergonic for dissociation of 1Sn(thf) (ΔG298 = −11 kJ mol−1). This indicates that the solvent-free complex 1Sn is the dominant species in solution. An exergonic Gibbs free dissociation energy of ΔG298 = −31 kJ mol−1 was experimentally determined for the THF dissociation of a cyclic dialkylstannylene THF adduct, supporting the present DFT results.61
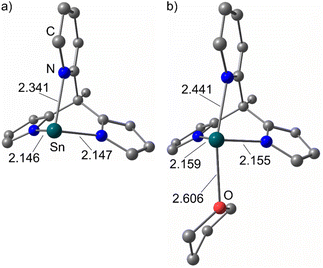 | ||
| Fig. 3 DFT optimised structures of (a) 1Sn and (b) 1Sn(thf) in the singlet ground state with selected structural parameters in Å (CPCM-(THF)-RIJCOSX-B3LYP-D3BJ-ZORA/def2-TZVPP/old-ZORA-TZVPP(Sn)). | ||
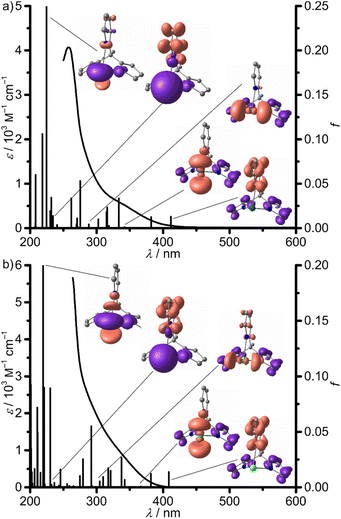
The UV/vis absorption spectra of 1Sn and 1Pb in THF and dimethylsulfoxide (DMSO), respectively, show several intense, broad, overlapping absorptions in the UV region tailing into the visible region with extinction coefficients ε > 500 M−1 cm−1 with λ < 350 nm (Fig. 4). TD-DFT calculations reveal several spin-allowed low-energy 1ILCT transitions (412–303 nm) with significant oscillator strength between the electron-rich pyrrolato and electron-poor pyridine moieties for 1Sn (Fig. 4a; ESI, Fig. S17†). In addition, pyrrolato → Sn 1LMCT (342, 288, 275 and 272 nm) transitions at similar energies are observed, which might play a role in the dynamics of 1Sn (vide infra). Sn → pyridine 1MLCT (271 and 234 nm) and mixed 1(ILCT/LMCT) (319 and 316 nm) transitions, as well as 1MC (225 nm) transitions are found at higher energies at the Franck–Condon geometry. The TD-DFT spectrum of 1Pb features 1ILCT transitions (409–305 nm) at very similar energies as found for 1Sn, indicating that the central ion does not significantly affect these ligand-centered 1CT transitions. 1LMCT and mixed 1(ILCT/LMCT) transitions of 1Pb are found at lower energies with 367 and 342 nm, respectively, closer to the lowest 1ILCT transitions (Fig. 4b; ESI, Fig. S18,†1MLCT (237 nm), 1MC (220 nm)). The lower 1LMCT transition energies of 1Pb are attributed to weaker Pb–Npy and lead–nitrogen(pyrrolato) bonds Pb–Npyr, associated with a lowering of the vacant σ*-orbitals (LUMO+1, LUMO+3) with high p(Pb)-character with respect to the derivative 1Sn (LUMO+2, LUMO+3, Fig. 1; ESI, Fig. S19, S20 and Tables S1, S2†).
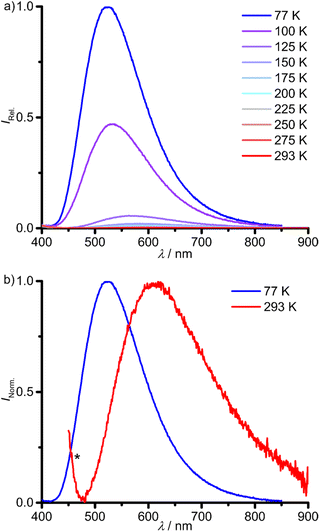
The investigation of the emission properties revealed a very weak photoluminescence of 1Sn at λem,293 = 611 nm after excitation at λexc = 325 nm in 2-methyl-tetrahydrofuran (2-Me-THF) solution at 293 K (Fig. 5 and Table 1). Unfortunately, unidentified impurities in different batches of commercial spectroscopic grade 2-Me-THF and THF show photoluminescence in the UV with λem < 400 nm tailing into the weak emission of 1Sn after excitation at the same wavelength (Fig. 5b; ESI, Fig. S21†). Variable-temperature emission spectra of 1Sn in 2-Me-THF in a temperature range of 293–77 K show a significant increase in emission intensity and a blue-shift of the emission maximum from λem,293 = 611 nm in fluid solution at 293 K to λem,77 = 523 nm in frozen solution at 77 K (Fig. 5 and Table 1). This is probably a consequence of a rigidochromic effect.62 The excitation spectra at 293 and 77 K largely follow the absorption spectrum at the low energy part (Fig. 4; ESI, Fig. S22†). Due to the weak photoluminescence, high concentrations had to be used, which cause spectral distortion in the high energy range. The photoluminescence lifetime measurements of 1Sn in fluid solution in the 125–293 K range gives ambiguous results due to the contribution of the photoluminescent impurity in 2-Me-THF. The determined lifetimes in the nanosecond range coincide with the emission of the unidentified impurity in 2-Me-THF (τem = 8 ns at 125 K). Hence, the photoluminescence lifetime of 1Sn might be in a similar or smaller order of magnitude as rough estimate (ESI, Fig. S23†). The fluorescent impurity in 2-Me-THF, the very weak emission of 1Sn at room temperature and the low solubility of 1Sn in other solvents prevented the photoluminescence quantum yield determination in solution.
The photoluminescence lifetime of 1Sn drastically increases to the millisecond range in frozen solution. The emission decay trace at 77 K is described with three lifetimes in the millisecond range (τ1 = 2.0 ms, τ2 = 0.5 ms, τ3 = 0.1 ms; Table 1). At 100 K, the lifetimes drop by one order of magnitude with τ3 vanishing in the instrument response function (IRF, τ1 = 0.1 ms, τ2 = 0.03 ms; Table 1; ESI, Fig. S24†). The strong temperature dependence of the photoluminescence lifetimes is associated to thermally activated non-radiative deactivation processes, which become dominant at elevated temperatures, even in frozen solution. Competing photophysical processes of different 1Sn(2-Me-thf)n adducts with varying number of coordinated 2-Me-THF molecules in (frozen) solution might account for a bi- or triexponential photoluminescence decay. The very long photoluminescence lifetime at 77 K assigns the emission to a phosphorescence process, i.e. emission from a triplet state. According to DFT calculations, phosphorescence occurs from a rather nested 3ILCT state (vide infra).
Solid donor solvent-free 1Sn emits at shorter wavelength λp,293 = 535 nm (293 K) and with a similar band shape as in solution (Fig. 5, 6a and Table 1). The emission blue-shifts to λp,77 = 504 nm upon cooling to 77 K (Fig. 6a and Table 1). The phosphorescence lifetimes from monoexponential fits and the photoluminescence quantum yields are determined to τp,293 = 14 ns, Φp,293 = 0.005 and τp,77 = 3.6 ms, Φp,77 = 0.58 at 293 and 77 K, respectively (Table 1; ESI, Fig. S25†).
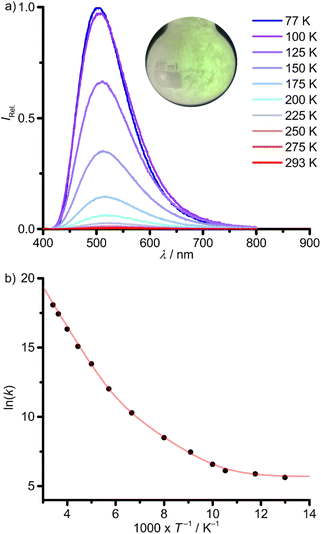 | ||
| Fig. 6 (a) Temperature-dependent photoluminescence spectra of 1Sn in the solid state between 77 K (blue) and 293 K (red) with λexc = 350 nm (inset: photograph of the green photoluminescence at ca. 77 K) and (b) Arrhenius plot of the photoluminescence rate constants (k(T) = 1/τp(T), T = 77–293 K) with fit (red curve), according to eqn (1). | ||
The strong temperature dependence of the photoluminescence lifetime and yield is attributed to thermally activated non-radiative processes. According to the high phosphorescence quantum yield at 77 K, 1ES → 3ES ISC should be very efficient. Hence, non-radiative ES deactivation occurs mainly from the triplet ES. An Arrhenius plot of the photoluminescence rate constants (k(T) = 1/τp(T)) is fitted as a sum of three rate constants k0/k1/k2 (eqn (1) and Fig. 6b).63k0 includes non-thermally activated radiative and non-radiative processes, while k1(T) and k2(T) are temperature dependent, expressed as Arrhenius equations with frequency factors A1/A2 and activation energies Ea1/Ea2 (eqn (1)).
 | (1) |
The obtained fit parameters indicate two thermally activated processes depopulating the photoluminescent state with barriers of Ea1 = 0.25 eV (2000 cm−1), dominating the high temperature regime and Ea2 = 0.10 eV (810 cm−1), dominant in the low temperature regime (Fig. 6b and Table 2).
| 1Sn | 1Pb | |
|---|---|---|
| k 0/s−1 | 298 | 3.77 × 10⁶ |
| E a1/eV (cm−1) | 0.25 (2000) | 0.11 (890) |
| E a2/eV (cm−1) | 0.10 (810) | 0.02 (200) |
| A 1/s−1 | 1.57 × 10¹² | 1.88 × 10¹¹ |
| A 2/s−1 | 6.14 × 10⁷ | 2.62 × 10⁸ |
Thermally activated depopulation of the photoluminescent state via two non-emissive ESs at similar activation energies has been observed for RhIII complexes.63
In contrast, 1Pb shows no photoluminescence in fluid DMSO solution at r.t. The low solubility of 1Pb in glass forming solvents prevented the investigation of the photoluminescence properties in solution at low temperatures. Yet, 1Pb shows a weak phosphorescence with λp,77 = 700 nm in the solid state at 77 K. Raising the temperature shifts the emission to lower energies with a strong loss of intensity (λp,200 = 720 nm, Fig. 7a). A minor impurity, below the NMR detection limit, with λem = 500 nm is ascribed to hydrolysis or oxidation products of 1Pb, indicated by an asterisk in Fig. 7a. This assignment was verified by measuring the sample again after contact to air, showing a decrease of the band at ≈700 nm and an increase of the band at ≈500 nm (ESI, Fig. S26†).
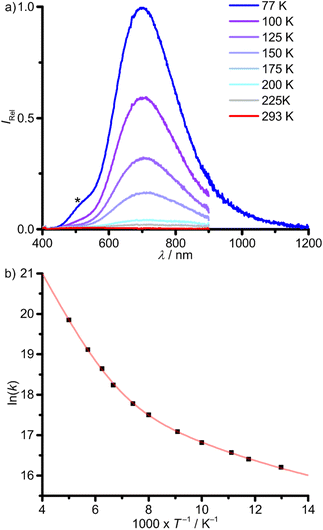 | ||
| Fig. 7 (a) Temperature-dependent photoluminescence spectra of 1Pb in the solid state between 77 K (blue) and 200 K (red) with λexc = 350 nm. The spectrum at 77 K is composed of two spectra, measured with different detectors. The asterisk denotes the photoluminescence of an unidentified minor impurity (oxidation or solvolysis product of 1Pb). (b) Arrhenius plot of the photoluminescence rate constants (k(T) = 1/τp(T), T = 77–200 K) with fit (red curve), according to eqn (1). | ||
The photoluminescence lifetimes of 1Pb determined from monoexponential fits drop from τp,77 = 92 ns to τp,200 = 2.4 ns upon warming from 77 to 200 K, respectively, with a very small photoluminescence quantum yield of Φp,77 = 0.0024 at 77 K (ESI, Fig. S27†). Two activation barriers Ea1 = 0.11 eV (890 cm−1) and Ea2 = 0.02 eV (200 cm−1) could be extracted from an Arrhenius plot of the photoluminescence rate constants (k(T) = 1/τp(T), eqn (1), Fig. 7b and Table 2). The much larger rate constant k0 of 1Pb (3.77 × 10⁶ s−1) vs.1Sn (298 s−1) includes non-thermally activated radiative and non-radiative processes and will be discussed in the context of DFT calculations (vide infra). The phosphorescence of 1Pb in the solid state at 77 K (λp,77 = 700 nm, 14![[thin space (1/6-em)]](https://www.rsc.org/images/entities/char_2009.gif) 300 cm−1) occurs at significantly lower energy as that of 1Sn (λp,77 = 504 nm, 19
300 cm−1) occurs at significantly lower energy as that of 1Sn (λp,77 = 504 nm, 19![[thin space (1/6-em)]](https://www.rsc.org/images/entities/char_2009.gif) 800 cm−1), despite the very similar absorption spectra (Fig. 4, 6a and 7a). Hence, the emissive states must be of different nature. DFT calculations serve to assign the different emissive states (vide infra).
800 cm−1), despite the very similar absorption spectra (Fig. 4, 6a and 7a). Hence, the emissive states must be of different nature. DFT calculations serve to assign the different emissive states (vide infra).
2.2. Quantum chemical investigations
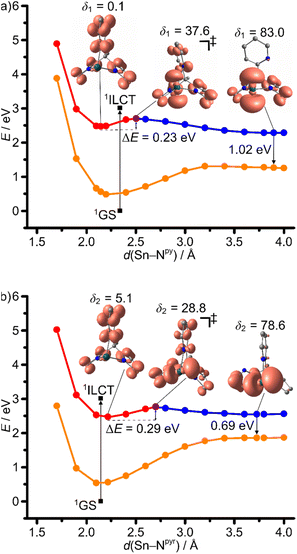
From the TD-DFT analysis, it becomes clear that excitation with 325 and 350 nm as used in the experimental setups populates a number of singlet states with different character in the Franck–Condon region, including 1ILCT and 1LMCT states (Fig. 4). It is likely that ISC is very fast and efficient due to the primary heavy atom effect via very large SOC of Sn and Pb (SOC constants: ζ(Sn) = 1855 cm−1, ζ(Pb) = 5089 cm−1).58 Consequently, we focus in the following discussion on the triplet states of 1Sn and 1Pb only. In order to shed light onto the divergent emission properties of the tin and lead complexes, DFT calculations were performed on the triplet states (CPCM-(THF)-RIJCOSX-UB3LYP-D3BJ-ZORA/def2-TZVPP/old-ZORA-TZVPP(Sn)/SARC-ZORA-TZVPP(Pb)). In both cases, three triplet states with distinct structural features could be located, namely 3ILCT, 3LMCTpy and 3LMCTpyr states. The 3ILCT state is essentially nested with the 1GS. The major 1GS to 3ILCT state geometric reorganization is an E–Npy bond contraction with a slight E–Npyr elongation with parallel decrease of the angle between the pyrrolate mean-square planes from 130° to 106° (ESI, Tables S1 and S2†). The 3LMCTpy and 3LMCTpyr states (py = pyridine and pyr = pyrrolato) are strongly distorted with broken E–Npy and E–Npyr bonds, respectively, in addition to a tilting of the respective heterocyclic pyridine or pyrrolate rings (Fig. 8–10). The 3LMCTpy state possesses the lowest energy in both complexes. The next higher state is 3ILCT and 3LMCTpyr for the tin and lead derivatives, respectively (Table 3).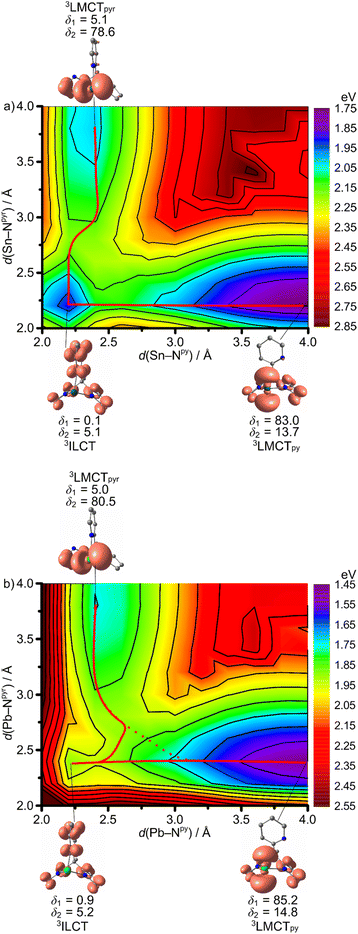 | ||
| Fig. 10 Contour plots of 2D relaxed potential energy surface scans as projection along the E–Npy and E–Npyr stretching modes on the triplet hypersurface 31E with selected geometry optimised molecular structures with spin densities (isosurface value: 0.005 a.u.) of (a) 1Sn and (b) 1Pb. Selected E–Npy/pyr–Cpy/pyr–Cbackbone dihedral angles δ1/δ2 in deg. are indicated and the graphically determined, estimated minimum energy paths for 3ILCT → 3LMCTpy/3LMCTpyr (red lines) and 3LMCTpy/3LMCTpyr internal conversion (dotted line). Energies are given vs. the 1GS energy (ESI, Fig. S28†). CPCM-(THF)-RIJCOSX-UB3LYP-D3BJ-ZORA/def2-TZVPP/old-ZORA-TZVPP(Sn)/SARC-ZORA-TZVPP(Pb). | ||
| 1Sn | 1Pb | |
|---|---|---|
| a For Gibbs free energies, see: ESI, Table S3. b Relaxed geometry. c 1GS at relaxed 3ILCT, 3LMCTpy and 3LMCTpyr geometry, respectively. d Relative energy to the relaxed 3LMCTpy state. | ||
| 3ILCT | 0 | 0 |
| 3LMCTpy | −0.19 | −0.43 |
| 3LMCTpyr | +0.08 | −0.15 |
| 1GSrelaxedb | −2.47 | −2.49 |
| 1GS3ILCT-geomc | −1.91 | −1.94 |
| 1GS3LMCTpy-geomc | −1.21 | −1.42 |
| 1GS3LMCTpyr-geomc | −0.61 | −0.95 |
| TS(3ILCT → 3LMCTpy) | +0.23 | +0.06 |
| TS(3ILCT → 3LMCTpyr) | +0.29 | — |
| TS(3LMCTpy → 3LMCTpyr)d | — | +0.46 |
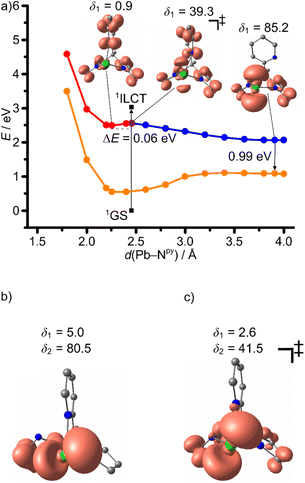
3ILCT → 3LMCTpy and 3ILCT → 3LMCTpyr DFT optimized transition states were located for 1Sn giving activation barriers of 0.23 and 0.29 eV, respectively (Table 3 and Fig. 8). A much lower 3ILCT → 3LMCTpy activation barrier of 0.06 eV was found for 1Pb, while no 3ILCT → 3LMCTpyr transition state could be located in this case (Fig. 9a). 2D maps of the triplet surfaces projected along the E–Npy and E–Npyr modes were calculated on a lower level of theory for 1Sn and 1Pb (Fig. 10). The map of 1Sn clearly shows two trajectories from the 3ILCT state to the 3LMCT states along minimum energy paths (Fig. 10a). In contrast, the map of 1Pb discloses only a single minimum energy trajectory from the 3ILCT state towards the 3LMCTpy state, but suggests a (higher energy) path from the 3LMCTpy to the 3LMCTpyr state (Fig. 10b). This excited state landscape explains the failure to locate a 3ILCT → 3LMCTpyr transition state for 1Pb.
Assuming that the dynamics after ISC on the triplet surface start at the respective relaxed 3ILCT states, the different barriers to the 3LMCT states of 0.23/0.29 eV and 0.06 eV for 1Sn and 1Pb, respectively, will determine the following dynamics (Table 3). Without emphasising the calculated numbers too strongly, we note that for 1Sn an experimental barrier of Ea1 = 0.25 eV has been determined close the calculated values (Tables 2 and 3). As the 3LMCTpyr state lies above the 3ILCT state, we assign the observed temperature-dependent emission of 1Sn at 535 nm to the 3ILCT state and the observed barrier to the 3ILCT → 3LMCTpy population transfer. Consequently, the emission of 1Sn is a non-Kasha emission due to a significant barrier to the lower energy triplet state (3LMCTpy).
On the other hand, the very small 3ILCT → 3LMCTpy barrier calculated for 1Pb suggests that rapid evolution to the 3LMCTpy state occurs along with Pb–Npy bond elongation and dissociation. This strongly distorted state at low energy can rapidly decay back to the 1GS, which fits to the experimental observations of a weak, short-lived, low-energy emission of 1Pb (Table 1). The 3LMCTpyr state of 1Pb lies above the 3LMCTpy state and the 3LMCTpy → 3LMCTpyr barrier of 0.46 eV impedes its significant population leading to the assignment of the observed low-energy emission as originating from the 3LMCTpy state (Table 3 and Fig. 9b, c). The other small barriers of 0.02–0.11 eV observed in the photoluminescence decays of 1Sn and 1Pb might be associated to other modes that promote the ISC from the triplet states to the 1GS (Table 2). These enabling modes are not covered in our calculations (Table 3).
It is to note, in the frame of these DFT calculations the rigid environment of a solid with constrained geometric reorganisation is not fully described and the barriers and ES energies might be higher due to externally forced rigidification. Yet, distinct geometric flexibility in the solid state has been discussed for photo-switches64 and photoluminescent copper(I) complexes.65 On the other hand, rigidification by aggregation significantly impacts the GS and ES potential energy surfaces, e.g. raising the energy of conical intersections and surface crossing points, which leads to aggregation-induced emission66,67 and in particular, aggregation-induced phosphorescence.18,68 The molecular flexibility in the solid state of 1Sn and in particular of 1Pb might be sufficient for thermally activated depopulation of the 3ILCT state via the lower-lying 3LMCT states. However, the lifetime and energy of the 3LMCTpy state are sufficiently high to observe the very weak phosphorescence of 1Pb at low temperatures (Fig. 7).
The experimental rate constant k0 = 298 s−1 of 1Sn is much smaller than k0 = 3.77 × 10⁶ s−1 of 1Pb. This finding might be associated with the different vertical energy gaps of 1.91 and 0.99 eV between the emissive states 3ILCT/3LMCTpy and the 1GS (Fig. 8a, 9a and Table 3) and the different SOC contribution promoting ISC to the 1GS in the 3ILCT (smaller SOC) and 3LMCT (higher SOC) states, respectively, together with the smaller heavy-atom effect for Sn, compared to Pb.
The excited state dynamics of 1Sn in frozen 2-Me-THF might additionally be affected by solvent coordination during freezing and hence the presence of different solvates in the frozen sample, e.g.1Sn(2-Me-thf)n, which might account for the multiple emission lifetimes. Consequently, TD-DFT calculations were performed on 1Sn(thf). Similar to 1Sn, the lowest Franck–Condon states are of 1ILCT character, slightly shifted to higher energies (ESI, Fig. S29–31†).
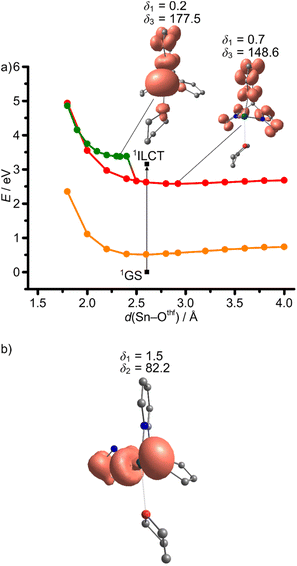
The Sn–Othf distance of 2.606 Å in the 1GS increases to 2.925 Å in the 3ILCT state, while the Sn–N distances are essentially unchanged, according to DFT calculations (Fig. 3b and 11a; ESI, Table S1†). This suggests that the initially populated 3ILCT state of the adduct 1Sn(thf) is strongly distorted. The deactivation of the 3ILCT state occurs preferentially via the 3LMCTpy state suggested by a 2D relaxed triplet surface scan as a projection along the Sn–Othf and Sn–Npy modes (Fig. 12). The trajectory for 3ILCT/3LMCTpy internal conversion follows the Sn–Othf coordinate with THF dissociation, forming donor-free 1Sn within the 3ILCT state and then converts to the 3LMCTpy state along the Sn–Npy coordinate (Fig. 12). The 3LMCTpy state is slightly destabilised relative to the 3ILCT in the loose van-der-Waals adduct between THF and 1Sn in 1Sn(thf) (Tables 3 and 4; ESI, Tables S3 and S4†). A relaxed surface scan on the 3ILCT surface along the Sn–Othf stretching mode shows that THF dissociation is essentially barrierless (Fig. 11a). Additionally, a 3MLCT and a 3LMCTpyr state with dissociated pyrrolato moiety and THF, could be located as local minima for the THF adduct 1Sn(thf) at higher energies (Fig. 11; ESI, Table S1†). The geometries of the relaxed 3MLCT and 3ILCT states mainly differ by their Sn–Othf distances and Npy–Sn–Othf angles δ3, in accordance to the valence shell electron pair repulsion model as simplest explanation (Fig. 11a; ESI, Table S1†). Due to their comparably high energy, these 3MLCT and 3LMCTpyr states should not play a significant role in the deactivation of the phosphorescent 3ILCT state (Table 4; ESI, Table S4†).
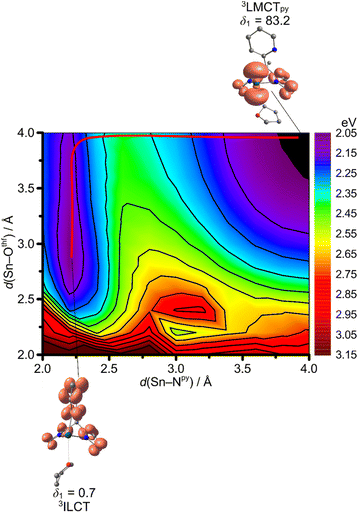 | ||
| Fig. 12 Contour plot of a 2D relaxed potential energy surface scan as projection along the Sn–Npy and Sn–Othf stretching modes on the triplet hypersurface 31Sn(thf) with selected geometry optimised molecular structures with spin densities (isosurface value: 0.005 a.u.). Selected E–Npy–Cpy–Cbackbone dihedral angles δ1 in deg. are indicated and the graphically determined, estimated minimum energy path for 3ILCT → 3LMCTpy (red line) internal conversion. Energies are given vs. the 1GS energy (ESI, Fig. S32†). CPCM-(THF)-RIJCOSX-UB3LYP-D3BJ-ZORA/def2-TZVPP/old-ZORA-TZVPP(Sn). | ||
In summary, the calculations suggest that donor-free 1Sn shows emission from a weakly distorted 3ILCT state (non-Kasha behavior) due to high enough barriers to the 3LMCT states, while 1Pb efficiently evolves from the initially populated nested 3ILCT state to the dissociative, low-energy, weakly emissive 3LMCTpy state. Compared to the often weakly distorted CT states of photoluminescent TMCs,1–3 the low-energy 3LMCT states observed here are highly distorted. Clearly, this arises from the rather non-bonding character of the involved transition metal d-orbitals, while 3LMCT states of 1Sn and 1Pb are characterised by the population of σ*(E–X) orbitals leading to large distortions and even donor moiety dissociation (pyridine or pyrrolato). Excited states of 3MLCT nature involving the non-bonding tetrel-centered lone-pair of high s character would be less distorted. Such 3MLCT states indeed exist, yet at higher energies than the dissociative 3LMCT states in 1Sn and 1Pb (Fig. 1 and 4; ESI, Fig. S17 and S18†). 3LMCT states involving the empty p-type orbital in non-donor stabilised tetrylenes might provide another weakly distorted and potentially emissive CT state in tetrylenes.
3 Conclusions
SnII(bpep) 1Sn shows phosphorescence from an 3ILCT state (non-Kasha behavior) in solution and in the solid state. The phosphorescence quantum yield and the photoluminescence lifetime drastically increase from τp,293 = 14 ns, Φp,293 = 0.005 to τp,77 = 3.6 ms, Φp,77 = 0.58 from 293 to 77 K in the solid state. In contrast, PbII(bpep) 1Pb shows very weak short-lived phosphorescence at 77 K (τp,77 = 92 ns, Φp,77 = 0.0024) with strong decrease in lifetime to τp,200 = 2.4 ns at 200 K. This photoluminescence arises from a 3LMCT state, populated via IC from the initially populated 3ILCT state. The strong temperature dependence is attributed to two thermally activated processes with experimentally determined barriers of Ea1 = 0.25 eV and Ea2 = 0.10 eV for 1Sn and Ea1 = 0.11 eV and Ea2 = 0.02 eV for 1Pb. Two strongly distorted, dissociative 3LMCT states, according to (2D) relaxed potential energy surface scans by DFT calculations, open up pathways for fast (non-radiative) deactivation of the nested 3ILCT state. The corresponding barrier is significantly lower for 1Pb (0.06/0.06 eV) than for 1Sn (0.23/0.25 eV, DFT SCF/Gibbs free energies). ISC is fast despite the weak contribution of the Sn and Pb atoms to the excited state wavefunctions of the initially populated 1ILCT state. The expectedly larger heavy-atom effect, leading to faster ISC of the lead compound 1Pb, is compensated by the much faster deactivation due to the significantly smaller barriers, obtained from variable-temperature photoluminescence lifetime measurements and supported by DFT calculations. In solution, the population of the 3ILCT state of the THF adduct 1Sn(thf) is accompanied with solvent decoordination and formation of 1Sn.In order to obtain phosphorescent tetrel(II) complexes, the focus should not be kept solely on the heavy-atom effect, invoking effective SOC to enable fast singlet-to-triplet ISC, but also on the ES ordering, enabling fast non-radiative deactivation of potential phosphorescent ESs. Geometric excited state reorganisation and solvent (de-)coordination seems to play a more pronounced role for tetrylenes than for pseudo-octahedral TMCs, but seems comparable to pseudo-tetrahedral CuI complexes with their ES flattening distortion, prone to solvent or anion coordination.
With the energy landscape of 1E (E = Sn, Pb), obtained from this initial study, a rational optimisation of the photoluminescent properties emerges. (1) The 3ILCT state should be pushed to energies below the 3LMCT states with electron-withdrawing substituents on the pyridine moieties. (2) The 3LMCT states could be pushed to higher energies with the lighter homologues germanium and silicon, probably with higher 3ILCT/3LMCT barriers by decreased molecular flexibility. (3) Rigidification of the pyridine moiety with bulky substituents could prevent the dissociation and torsional motion of the pyridine. (4) Lowering the energy of the tentatively weakly distorted 3MLCT states below the 3ILCT and 3LMCT states to obtain 3MLCT phosphorescence. (5) Mitigating the dissociative character of the 3LMCT states in non-donor stabilised tetrylenes. Current investigations in these directions are in progress.
Data availability
All experimental and computational data are available in the ESI.† Crystallographic data have been deposited in the Cambridge Crystallographic Data Centre under accession numbers CCDC 2211125 and 2211126.Author contributions
P. S. performed the synthesis and characterisation as well as (TD-)DFT calculations. R. N. and P. S. measured and interpreted the emission data. C. F. solved the single crystal structures. C. F. conceived and designed the project. C. F. wrote the manuscript with contributions of all authors. K. H. supervised and C. F. co-supervised the project.Conflicts of interest
There are no conflicts to declare.Acknowledgements
This work has been financially supported by the Deutsche Forschungsgemeinschaft (DFG) under grant INST 247/1018-1 (K. H.). Parts of this research were conducted using the supercomputer Elwetritsch and advisory services offered by the University of Kaiserslautern-Landau (https://hpc.rz.rptu.de), which is a member of the AHRP and the Gauss Alliance e.V. We thank Dr Dieter Schollmeyer for collecting the XRD data and Dr Mihail Mondeshki for 119Sn and 207Pb NMR measurements.References
- C. Wegeberg and O. S. Wenger, JACS Au, 2021, 1, 1860–1876 CrossRef CAS PubMed.
- C. Förster and K. Heinze, Chem. Soc. Rev., 2020, 49, 1057–1070 RSC.
- O. S. Wenger, Chem.–Eur. J., 2019, 25, 6043–6052 CrossRef CAS PubMed.
- B. M. Hockin, C. Li, N. Robertson and E. Zysman-Colman, Catal. Sci. Technol., 2019, 9, 889–915 RSC.
- C. B. Larsen and O. S. Wenger, Chem.–Eur. J., 2018, 24, 2039–2058 CrossRef CAS PubMed.
- V. Balzani, P. Ceroni and A. Juris, Photochemistry and Photophysics. Concepts, Research, Applications, Wiley-VCH, Weinheim, 1st edn, 2014 Search PubMed.
- T. J. Penfold, E. Gindensperger, C. Daniel and C. M. Marian, Chem. Rev., 2018, 118, 6975–7025 CrossRef CAS PubMed.
- M. Iwamura, S. Takeuchi and T. Tahara, Acc. Chem. Res., 2015, 48, 782–791 CrossRef CAS PubMed.
- N. Armaroli, Chem. Soc. Rev., 2001, 30, 113–124 RSC.
- C. Sandoval-Pauker, M. Santander-Nelli and P. Dreyse, RSC Adv., 2022, 12, 10653–10674 RSC.
- Y. Zhang, M. Schulz, M. Wächtler, M. Karnahl and B. Dietzek, Coord. Chem. Rev., 2018, 356, 127–146 CrossRef CAS.
- S. A. Patra, G. Sahu, P. D. Pattanayak, T. Sasamori and R. Dinda, Inorg. Chem., 2022, 61, 16914–16928 CrossRef CAS PubMed.
- J. C. Berrones-Reyes, C. C. Vidyasagar, B. M. Muñoz Flores and V. M. Jiménez-Pérez, J. Lumin., 2018, 195, 290–313 CrossRef CAS.
- D. S. M. Ravinson and M. E. Thompson, Mater. Horiz., 2020, 7, 1210–1217 RSC.
- H. Yersin, R. Czerwieniec, M. Z. Shafikov and A. F. Suleymanova, ChemPhysChem, 2017, 18, 3508–3535 CrossRef CAS PubMed.
- H. Yersin, A. F. Rausch, R. Czerwieniec, T. Hofbeck and T. Fischer, Coord. Chem. Rev., 2011, 255, 2622–2652 CrossRef CAS.
- S. Arunkumar, D. Ghosh and G. R. Kumar, Results Chem., 2022, 4, 100399 CrossRef CAS.
- S. M. Parke and E. Rivard, Isr. J. Chem., 2018, 58, 915–926 CrossRef CAS.
- S. M. Parke, M. P. Boone and E. Rivard, Chem. Commun., 2016, 52, 9485–9505 RSC.
- L. A. Maurer, O. M. Pearce, F. D. R. Maharaj, N. L. Brown, C. K. Amador, N. H. Damrauer and M. P. Marshak, Inorg. Chem., 2021, 60, 10137–10146 CrossRef CAS PubMed.
- A. K. Adcock, R. L. Ayscue, L. M. Breuer, C. P. Verwiel, A. C. Marwitz, J. A. Bertke, V. Vallet, F. Réal and K. E. Knope, Dalton Trans., 2020, 49, 11756–11771 RSC.
- S. M. Parke, E. Hupf, G. K. Matharu, I. de Aguiar, L. Xu, H. Yu, M. P. Boone, G. L. C. de Souza, R. McDonald, M. J. Ferguson, G. He, A. Brown and E. Rivard, Angew. Chem., Int. Ed. Engl., 2018, 57, 14841–14846 CrossRef CAS PubMed.
- S. M. Parke, M. A. B. Narreto, E. Hupf, R. McDonald, M. J. Ferguson, F. A. Hegmann and E. Rivard, Inorg. Chem., 2018, 57, 7536–7549 CrossRef CAS PubMed.
- O. Toma, M. Allain, F. Meinardi, A. Forni, C. Botta and N. Mercier, Angew. Chem., Int. Ed., 2016, 55, 7998–8002 CrossRef CAS PubMed.
- O. Toma, N. Mercier, M. Allain, A. Forni, F. Meinardi and C. Botta, Dalton Trans., 2015, 44, 14589–14593 RSC.
- O. Toma, N. Mercier and C. Botta, Eur. J. Inorg. Chem., 2013, 1113–1117 CrossRef CAS.
- A. Strasser and A. Vogler, Inorg. Chem. Commun., 2004, 7, 528–530 CrossRef CAS.
- Y. Kang, D. Song, H. Schmider and S. Wang, Organometallics, 2002, 21, 2413–2421 CrossRef CAS.
- D. Temerova, T.-C. Chou, K. S. Kisel, T. Eskelinen, N. Kinnunen, J. Jänis, A. J. Karttunen, P.-T. Chou and I. O. Koshevoy, Inorg. Chem., 2022, 61, 19220–19231 CrossRef CAS PubMed.
- A. S. Gowda, T. S. Lee, M. C. Rosko, J. L. Petersen, F. N. Castellano and C. Milsmann, Inorg. Chem., 2022, 61, 7338–7348 CrossRef CAS PubMed.
- M. Kocherga, J. Castaneda, M. G. Walter, Y. Zhang, N.-A. Saleh, L. Wang, D. S. Jones, J. Merkert, B. Donovan-Merkert, Y. Li, T. Hofmann and T. A. Schmedake, Chem. Commun., 2018, 54, 14073–14076 RSC.
- D. Maeda, H. Shimakoshi, M. Abe and Y. Hisaeda, Inorg. Chem., 2009, 48, 9853–9860 CrossRef CAS PubMed.
- A. Endo, M. Ogasawara, A. Takahashi, D. Yokoyama, Y. Kato and C. Adachi, Adv. Mater., 2009, 21, 4802–4806 CrossRef CAS PubMed.
- W.-L. Jia, Q.-D. Liu, R. Wang and S. Wang, Organometallics, 2003, 22, 4070–4078 CrossRef CAS.
- M. Gouterman, F. P. Schwarz, P. D. Smith and D. Dolphin, J. Chem. Phys., 1973, 59, 676–690 CrossRef CAS.
- M. Kocherga, K. M. Boyle, J. Merkert, T. A. Schmedake and M. G. Walter, Mater. Adv., 2022, 3, 2373–2379 RSC.
- J. Hoffmann, I.-M. Ramirez Y Medina, M. Hissler and A. Staubitz, Dalton Trans., 2021, 50, 6213–6221 RSC.
- M. Gon, K. Tanaka and Y. Chujo, Chem.–Eur. J., 2021, 27, 7561–7571 CrossRef CAS PubMed.
- I.-M. Ramirez Y Medina, M. Rohdenburg, W. Kipke, E. Lork and A. Staubitz, Molecules, 2020, 25, 4993 CrossRef PubMed.
- I.-M. Ramirez Y Medina, M. Rohdenburg, E. Lork and A. Staubitz, Chem. Commun., 2020, 56, 9775–9778 RSC.
- W. Ki, K. Ngo, P. Ghosh, B. Averkiev, G. T. Reeves, I. Ailes, B. C. Pemberton, K. Zhu and J. Li, Chem. Commun., 2020, 56, 9648–9650 RSC.
- M. Yamamura, M. Albrecht, M. Albrecht, Y. Nishimura, T. Arai and T. Nabeshima, Inorg. Chem., 2014, 53, 1355–1360 CrossRef CAS PubMed.
- K. Takano, M. Takahashi, T. Fukushima, M. Takezaki, T. Tominaga, H. Akashi, H. Takagi and T. Shibahara, Bull. Chem. Soc. Jpn., 2012, 85, 1210–1221 CrossRef CAS.
- S. M. Crawford, A. Al-Sheikh Ali, T. S. Cameron and A. Thompson, Inorg. Chem., 2011, 50, 8207–8213 CrossRef CAS PubMed.
- R. Ballardini, G. Varani, M. T. Indelli and F. Scandola, Inorg. Chem., 1986, 25, 3858–3865 CrossRef CAS.
- H. Nikol, A. Becht and A. Vogler, Inorg. Chem., 1992, 31, 3277–3279 CrossRef CAS.
- K. Oldenburg and A. Vogler, Z. Naturforsch., B: J. Chem. Sci., 1993, 48, 1519–1523 CrossRef CAS.
- A. Becht and A. Vogler, Z. Naturforsch., B: J. Chem. Sci., 1994, 49, 778–780 CrossRef CAS.
- A. Strasser and A. Vogler, J. Photochem. Photobiol., A, 2004, 165, 115–118 CrossRef CAS.
- L.-X. Wang, J. Xiang, D. Xiang, S.-C. Cheng, C.-F. Leung and C.-C. Ko, Inorg. Chem., 2022, 61, 16831–16840 CrossRef CAS PubMed.
- J. Kobayashi, T. Kushida and T. Kawashima, J. Am. Chem. Soc., 2009, 131, 10836–10837 CrossRef CAS PubMed.
- J.-D. Guo, D. J. Liptrot, S. Nagase and P. P. Power, Chem. Sci., 2015, 6, 6235–6244 RSC.
- Y. Mizuhata, T. Sasamori and N. Tokitoh, Chem. Rev., 2009, 109, 3479–3511 CrossRef CAS PubMed.
- K. W. Klinkhammer, in The Chemistry of Organic Germanium, Tin and Lead Compounds, ed. Z. Rappoport, John Wiley Sons Ltd, Chichester, 2nd edn, 2002, vol. 2, pp. 283–357 Search PubMed.
- N. Tokitoh and R. Okazaki, Coord. Chem. Rev., 2000, 210, 251–277 CrossRef CAS.
- P. P. Power, Chem. Rev., 1999, 99, 3463–3504 CrossRef CAS PubMed.
- G. Gao, I. Korobkov and S. Gambarotta, Inorg. Chem., 2004, 43, 1108–1115 CrossRef CAS PubMed.
- M. Montalti and S. L. Murov, Handbook of Photochemistry, CRC/Taylor & Francis, Boca Raton, 3rd edn, 2006 Search PubMed.
- M. J. S. Gynane, D. H. Harris, M. F. Lappert, P. P. Power, P. Rivière and M. Rivière-Baudet, Dalton Trans., 1977, 2004–2009 RSC.
- J. D. Parish, M. W. Snook, A. L. Johnson and G. Kociok-Köhn, Dalton Trans., 2018, 47, 7721–7729 RSC.
- M. Kira, S. Ishida, T. Iwamoto, R. Yauchibara and H. Sakurai, J. Organomet. Chem., 2001, 636, 144–147 CrossRef CAS.
- A. J. Lees, Comments Inorg. Chem., 1995, 17, 319–346 CrossRef CAS.
- F. Barigelletti, D. Sandrini, M. Maestri, V. Balzani, A. von Zelewsky, L. Chassot, P. Jolliet and U. Maeder, Inorg. Chem., 1988, 27, 3644–3647 CrossRef CAS.
- A. Gonzalez, E. S. Kengmana, M. V. Fonseca and G. Han, Mater. Today Adv., 2020, 6, 100058 CrossRef.
- C. L. Linfoot, M. J. Leitl, P. Richardson, A. F. Rausch, O. Chepelin, F. J. White, H. Yersin and N. Robertson, Inorg. Chem., 2014, 53, 10854–10861 CrossRef CAS PubMed.
- S. Suzuki, S. Sasaki, A. S. Sairi, R. Iwai, B. Z. Tang and G.-I. Konishi, Angew. Chem., Int. Ed., 2020, 59, 9856–9867 CrossRef CAS PubMed.
- R. Crespo-Otero, Q. Li and L. Blancafort, Chem.–Asian J., 2019, 14, 700–714 CrossRef CAS PubMed.
- L. Ravotto and P. Ceroni, Coord. Chem. Rev., 2017, 346, 62–76 CrossRef CAS.
Footnote |
| † Electronic supplementary information (ESI) available: Experimental procedures, spectral details, (TD-)DFT results. CCDC 2211125 and 2211126. For ESI and crystallographic data in CIF or other electronic format see DOI: https://doi.org/10.1039/d2sc06984a |
| This journal is © The Royal Society of Chemistry 2023 |

