 Open Access Article
Three-dimensional heterogeneity in liquid electrolyte structures promotes Na ion transport and storage performance in Na-ion batteries†
Mengying
Ma‡
a,
Binbin
Chen‡
acd and
Huilin
Pan
 *ab
*ab
aDepartment of Chemistry, Zhejiang University, Hangzhou, 310012, China. E-mail: panhuilin@zju.edu.cn
bState Key Laboratory of Clean Energy Utilization, Zhejiang University, Hangzhou, 310012, China
cInstitute of Bioengineering, College of Chemical and Biological Engineering, Zhejiang University, Hangzhou, 310027, China
dZJU-Hangzhou Global Scientific and Technological Innovation Center, Hangzhou, 311200, China
First published on 16th May 2023
Abstract
Unlike solid materials, the molecular structure and chemical distribution in electrolyte solutions have been considered in isotropic states. Herein, we reveal controllable regulation of solution structures in electrolytes by manipulating solvent interactions for Na-ion batteries. Low-solvation fluorocarbons as diluents in concentrated phosphate electrolytes induce adjustable heterogeneity in electrolyte structures through variable intermolecular forces between high-solvation phosphate and diluents. An optimal trifluorotoluene (PhCF3) diluent weakens the solvation strength around Na+ and spontaneously leads to a locally enlarged Na+ concentration and global 3D continuous Na+ transport path thanks to the appropriate electrolyte heterogeneity. Besides, strong correlations between the solvation structure and the Na+ storage performance and interphases are demonstrated. PhCF3 diluted concentrated electrolyte enables superior operations of Na-ion batteries at both room temperature and a high temperature of 60 °C. A hard carbon anode exhibits a reversible capacity of 300 mA h g−1 at 0.2C and excellent life over 1200 cycles without decay.
Introduction
Electrolytes in batteries dictate the interfacial properties and overall cell performance regarding energy density, power, lifetime, safety, etc.1–3 In the past few decades, electrolyte optimizations have mainly focused on optimizing electrolyte compositions under a “standard” one molar (1 M) concentration typically for Li-ion batteries.4–6 Development of new battery chemistries such as high-energy Li-ion and low-cost Na-ion batteries has driven researchers to explore new concepts of electrolytes beyond the conventional “standard”.7–9 Highly concentrated electrolytes (HCEs) recently provided an effective approach to regulating the solvation structure of cations with more anions and minimizing uncoordinated solvents, leading to greatly improved electrochemical stability and cell performance.9–11 In recent times, diluent solvents with relatively low permittivity and donor ability have been further introduced into HCEs, resulting in a new kind of electrolyte, i.e., diluted HCE (DHCE).12,13 It is generally considered that diluents are well miscible with solvating solvents but “inert” for cation coordination.14,15 Therefore, DHCEs provide a promising compromise solution to retain similar solvation structures to HCEs while alleviating certain drawbacks of HCEs, e.g. high viscosity and sluggish kinetics in practical use.14,16The reversed salt/solvent ratios in HCEs and DHCEs bring dramatic changes in bulk liquid structures, ion transport, and interfacial and interphasial properties. Unusual ion transport phenomena, e.g., cation hopping and solvent/ligand-assisted cation transport have been reported in HCEs or DHCEs.17–19 Besides, the anion-involved solvation structures of HCE and DHCE might facilitate the formation of anion-derived solid electrolyte interphases (SEIs) to mitigate parasitic reactions in cells.20–22 Recent theoretical studies revealed that the diluents in DHCEs could regulate the solution network and generate structural heterogeneity in electrolytes.23,24 DHCEs even exhibit improved ionic conductivity and higher cation transfer numbers than “standard” electrolytes and HCEs.25–27 However, the general strategies for developing high-performance DHCEs still rely on empirical concepts (a typical mixture of low-solvation fluorinated solvents) instead of a rigorous molecular-level understanding of the interaction mechanisms of electrolyte components. Undoubtedly, a deep understanding of the roles of diluents and the correlations between specific electrolyte solvation structures and the physiochemical properties of electrolytes and cell performances should be dedicatedly explored to guide the electrolyte design.
Recent studies have indicated that diluents could influence the inner solvation structure through different types of weak interactions.28–31 It is found that diluent molecules could result in a low-dielectric environment or through solvent-diluent dipole–dipole interactions to regulate the cation–solvent and cation–anion interactions.28,30 Nevertheless, previous investigations have mainly focused on the internal solvation structure of cations in electrolytes while the external solvation structure and long-range electrolyte structure are rarely discussed. A previous study demonstrated that the solvent reorganization from optimal intermolecular interactions reinforced the long-range solution network and thus enabled the improved performance of Na-ion batteries.32 Currently, fundamental understandings of solvation structures are largely lacking for Na-ion batteries, which restricts the development of high-performance Na-ion batteries. In this work, we demonstrate the effective modification of internal and external solvation structures via distinctive solvent–solvent interactions between solvating solvents and diluent solvents. Such solvent–solvent interactions induced by diluents delicately regulate the global solution structures of electrolytes and consequently optimize global Na+ transport flux homogeneity. In addition, an optimal diluent weakens the coordination capability of solvating solvents and anions in the solvation structure, thus regulating the electrochemical stability of electrolytes and interphasial properties. The degree of influence depends on the type of diluents.
Results and discussion
Effect of diluents on the solvation structure of electrolytes
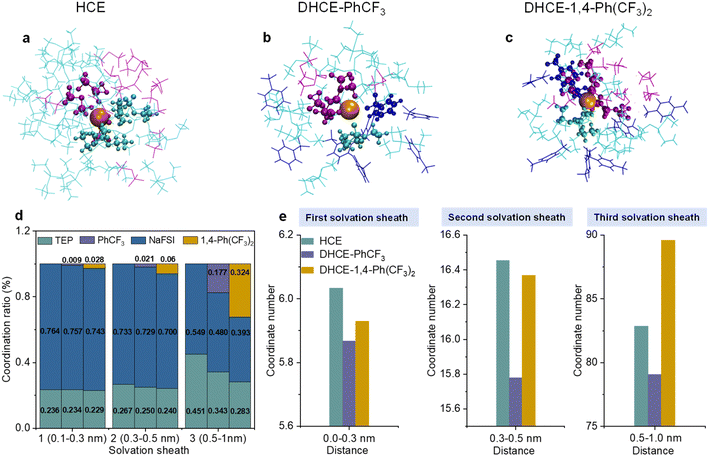
Triethyl phosphate (TEP) with non-flammability and a high donor number and sodium bis(fluorosulfonyl)imide (NaFSI) are employed as the solvating solvent and the salt for HCE, respectively. Fluorocarbons with different F contents (PhCF3 and 1,4-bis(trifluoromethyl)benzene (1,4-Ph(CF3)2)) are used as diluents for DHCEs. The effects of diluent on the internal and external solvation structures and coordination number of Na+ are thoroughly explored using classical molecular dynamics (MD) simulations. It is consistent with a previous publication that both TEP and FSI− participate in the primary solvation sheaths of Na+ in HCE and DHCEs (Fig. 1a–c).15 In HCE, TEP and FSI− take over 23.6% and 76.4% respectively in the first solvation sheath (Fig. 1d). In DHCE-PhCF3 and DHCE-1,4-Ph(CF3)2, the Na+ mainly binds to TEP and FSI− and exhibits emerging new coordination with F atoms from fluorocarbon diluents (0.9% and 2.8% in the first solvation sheath), as shown in Fig. 1b–d. It is not surprising that 1,4-Ph(CF3)2 with more F atoms exhibits more participation in the inner coordination shell due to more coordination sites.The MD simulation results show that the participation of fluorocarbons regulates the solvation structures. The fluorocarbon diluents exclude substantial TEP solvents and FSI− from different solvation shells with decreased participation ratios of TEP and FSI− (Fig. 1d). Moreover, it is found that fluorocarbon diluents change the coordination number of Na+ within a distance of 1 nm from centered Na+ (Fig. 1e). In the first (0–0.3 nm) and second (0.3–0.5 nm) solvation sheaths, the solvated fluorocarbon diluents induce a lower solvation environment around Na+ and exhibit impacts on reducing the coordination numbers of Na+ in these two sheaths. This suggests that low-solvation fluorocarbon diluents play subtle roles in weakening the inner coordination capability of TEP solvents and FSI− (Table S1†). It could be found that the participation ratio of low-solvation diluents in the inner coordination sheaths is limited because the high-solvation TEP solvent and FSI− still dominate the coordination with Na+ in this region (Fig. 1d), while the strong interactions between the diluent molecule and TEP solvent (Fig. S1†) allow the diluent to tailor the outer coordination sheath. The 1,4-Ph(CF3)2 diluent with more F atoms is intensively involved in the third coordination shell (0.5–1 nm), resulting in DHCE-1,4-Ph(CF3)2 showing a much higher coordination number of Na+ than the other two electrolytes (Fig. 1e). The intensive participation of 1,4-Ph(CF3)2 in the third coordination of Na+ leads to a strengthened external solvation structure. In contrast, the PhCF3 diluent with fewer F atoms exhibits the lowest coordination numbers of Na+ from inner to outer coordination sheaths in the DHCE-PhCF3 electrolyte, suggesting a loose solvation network generated by PhCF3. The weakened solvation network could promote easy Na+ transport from one solvation cluster to the adjacent.
Electrolyte solution structure and Na+ transport kinetics
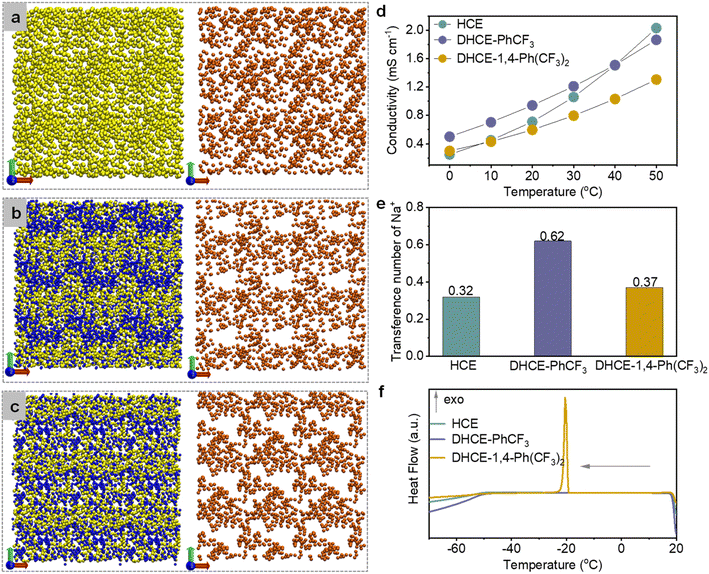
To clearly elaborate the influence of diluents on the solution structure, we use the P atom (P![[double bond, length as m-dash]](https://www.rsc.org/images/entities/char_e001.gif) O) to replace the entire TEP molecule and the F atom (–CF3) to present the whole diluent molecule (PhCF3 or 1,4-Ph(CF3)2 in the DHCEs). Neither of these two diluents has the ability to dissolve NaFSI (Fig. S2†). Fig. 2a–c depict the overall composition distribution in HCE, DHCE-PhCF3, and DHCE-1,4-Ph(CF3)2, respectively. The yellow, blue, and orange balls represent the TEP, fluorocarbon diluents, and Na+, respectively (note that the distribution of FSI− anions is not shown here due to their mostly overlapping with Na+ cations, see Fig. S3†). It could be found that the HCE exhibits a basically uniform spatial distribution of TEP and Na+ in the extended solution structures (Fig. 2a), while low-solvation fluorocarbons remarkably “disconnect” the consecutive distribution of solvating TEP clusters. This phenomenon is consistent with a previous report on solvent reorganization between high-solvation TEP and low-solvation fluorocarbon based on their strong interactions.32 The heteronomous distribution of solvating solvents consequently results in heterogeneous and localized Na+ distribution in long-range space as shown in Fig. 2b and c. The stronger solvent–solvent interaction between 1,4-Ph(CF3)2 and TEP strengthens the solvation strength of Na+ and leads to locally trapped Na+, thus prohibiting continuous long-range Na+ transport flux (Fig. 2c). However, DHCE-PhCF3 with appropriate TEP-PhCF3 interaction enhances the local concentration of Na+ while still preserving long-range 3D Na+ transport pathways (Fig. 2b).
O) to replace the entire TEP molecule and the F atom (–CF3) to present the whole diluent molecule (PhCF3 or 1,4-Ph(CF3)2 in the DHCEs). Neither of these two diluents has the ability to dissolve NaFSI (Fig. S2†). Fig. 2a–c depict the overall composition distribution in HCE, DHCE-PhCF3, and DHCE-1,4-Ph(CF3)2, respectively. The yellow, blue, and orange balls represent the TEP, fluorocarbon diluents, and Na+, respectively (note that the distribution of FSI− anions is not shown here due to their mostly overlapping with Na+ cations, see Fig. S3†). It could be found that the HCE exhibits a basically uniform spatial distribution of TEP and Na+ in the extended solution structures (Fig. 2a), while low-solvation fluorocarbons remarkably “disconnect” the consecutive distribution of solvating TEP clusters. This phenomenon is consistent with a previous report on solvent reorganization between high-solvation TEP and low-solvation fluorocarbon based on their strong interactions.32 The heteronomous distribution of solvating solvents consequently results in heterogeneous and localized Na+ distribution in long-range space as shown in Fig. 2b and c. The stronger solvent–solvent interaction between 1,4-Ph(CF3)2 and TEP strengthens the solvation strength of Na+ and leads to locally trapped Na+, thus prohibiting continuous long-range Na+ transport flux (Fig. 2c). However, DHCE-PhCF3 with appropriate TEP-PhCF3 interaction enhances the local concentration of Na+ while still preserving long-range 3D Na+ transport pathways (Fig. 2b).
The different global solution structures and Na+ distribution would lead to differential Na+ transport kinetics in the electrolytes. Fig. 2d exhibits the ionic conductivity of HCE, DHCE-PhCF3, and DHCE-1,4-Ph(CF3)2 in a temperature range of 0–50 °C. Though with a practical lower overall salt molarity, DHCE-PhCF3 exhibits higher ionic conductivity than the HCE below 40 °C (purple and cyan curves in Fig. 2d). In contrast, DHCE-1,4-Ph(CF3)2 presents the lowest ionic conductivity at all temperatures, which agrees well with the unfavorable global distribution of Na+ shown in Fig. 2c. The temperature dependence of ionic conductivity obviously deviates from the Arrhenius feature for both HCEs and DHCEs, suggesting obvious deviation in ion transport phenomena from conventional dilute solution. Empirical Vogel–Tammann–Fulcher (VTF) correlation is employed to fit the temperature-dependent ionic conductivity as shown in Fig. S4.† The HCE, DHCE-PhCF3, and DHCE-1,4-Ph(CF3)2 exhibit activation energies of 0.062, 0.058, and 0.082 eV, and DHCE-PhCF3 exhibits the easiest diffusion of Na+. Besides, the transference number (τ) provides informative Na+ transport properties in electrolytes.33Fig. 2e presents the Na+ transference number in different electrolytes, showing a sequence of DHCE-PhCF3 (0.62) > DHCE-1,4-Ph(CF3)2 (0.37) > HCE (0.32). The details for the measurements of the Na+ transference number are shown in Fig. S5.† It can be found that low-solvation fluorocarbon diluents increase the Na+ transference number of DHCEs. The PhCF3 diluent has appropriate interactions with solvating solvents, which effectively loosens the internal solvation structure of Na+ and builds locally high Na+ concentrations with continuous Na+ flux for the fastest Na+ transport (Fig. 2b). Nevertheless, the 1,4-Ph(CF3)2 diluent exhibits too strong interactions with solvating solvent and cannot effectively enhance the transport properties of Na+ due to less-mobile Na+ ions being trapped in the strong solvation network and blocked by the “disconnected” Na+ transport pathway (Fig. 2c).
Besides, the different global solution networks in HCE and DHCEs are expected to cause varied thermal stability of the electrolytes. Differential scanning calorimetry (DSC) measurements are performed as shown in Fig. 2f and S6.† Both HCE and DHCE-PhCF3 could retain a liquid state until −50 °C during the cooling stage, showing a glass transition temperature of about −50 °C, while DHCE-1,4-Ph(CF3)2 exhibits an exotherm crystallization peak at −20.16 °C, which could be correlated to the strong solvation network induced by TEP-1,4-Ph(CF3)2 interaction, thus bringing forward early liquid–solid phase transition during the cooling stage. Besides, during the following heating process from −70 to 20 °C, only DHCE-PhCF3 could keep the liquid phase (Fig. S6†). The wide liquid temperature range should be related to the appropriate TEP-PhCF3 interaction and delicate solution structure of DHCE-PhCF3.
Thermodynamic properties of electrolytes
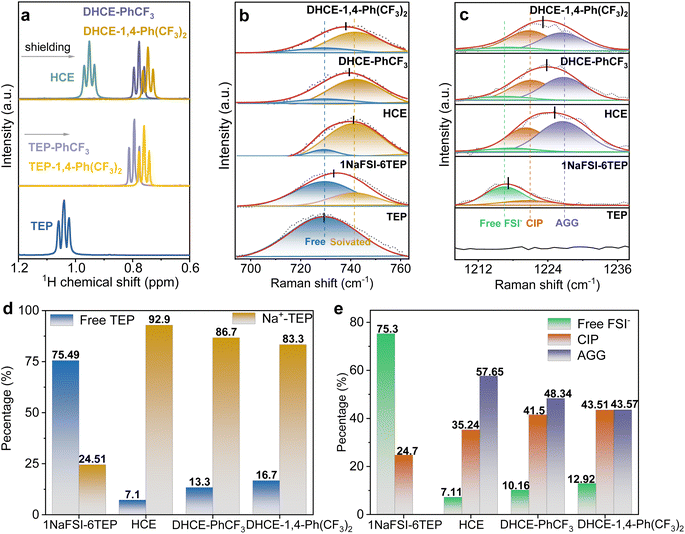
The role of diluents in the DHCEs is further studied through various spectroscopy and electrochemical methods. Nuclear magnetic resonance (NMR) spectroscopy is employed to investigate the interactions between TEP and diluents (Fig. 3a and S7†). With the addition of diluents, the 1H NMR spectrum of TEP solvent shows obvious high-field shifts, which could be attributed to dipole–dipole interactions between TEP and diluents.30 Moreover, the 1H NMR spectrum of TEP in the TEP-1,4-Ph(CF3)2 mixture solvent experiences a larger shift than in the TEP-PhCF3 mixture solvent. This result indicates that 1,4-Ph(CF3)2 has a stronger interaction with TEP than PhCF3, which agrees well with the MD simulation results shown in Fig. S1.† Meanwhile, the corresponding downfield shifts of the 1H signal of fluorocarbon diluents are observed as shown in Fig. S7.† Notably, the interactions between low-solvation diluents and high-solvation TEP solvent could be basically reserved after the dissolution of NaFSI, showing the negligible shifts of 1H of TEP after adding salts (Fig. 3a).Raman spectra are used to further elucidate the effects of diluents on solvation structures. As shown in Fig. 3b, the Raman peak at 729.6 cm−1 corresponds to the stretching vibration of P–O–C in free TEP solvent.34 A new Raman peak at 741.6 cm−1 from solvated TEP emerges after adding NaFSI salt (1NaFSI-6TEP). As shown in Fig. 3d, the increased salt concentration in HCE (1NaFSI-1.5TEP) significantly improves the ratio of solvated TEP![[thin space (1/6-em)]](https://www.rsc.org/images/entities/char_2009.gif) :
:![[thin space (1/6-em)]](https://www.rsc.org/images/entities/char_2009.gif) free TEP (92.9
free TEP (92.9![[thin space (1/6-em)]](https://www.rsc.org/images/entities/char_2009.gif) :
:![[thin space (1/6-em)]](https://www.rsc.org/images/entities/char_2009.gif) 7.1). Moreover, fluorocarbon diluents reduce the overall salt molarity but still retain high ratios of solvated TEP
7.1). Moreover, fluorocarbon diluents reduce the overall salt molarity but still retain high ratios of solvated TEP![[thin space (1/6-em)]](https://www.rsc.org/images/entities/char_2009.gif) :
:![[thin space (1/6-em)]](https://www.rsc.org/images/entities/char_2009.gif) free TEP in DHCEs (86.7
free TEP in DHCEs (86.7![[thin space (1/6-em)]](https://www.rsc.org/images/entities/char_2009.gif) :
:![[thin space (1/6-em)]](https://www.rsc.org/images/entities/char_2009.gif) 13.3 and 83.3
13.3 and 83.3![[thin space (1/6-em)]](https://www.rsc.org/images/entities/char_2009.gif) :
:![[thin space (1/6-em)]](https://www.rsc.org/images/entities/char_2009.gif) 16.7 for DHCE-PhCF3 and DHCE-1,4-Ph(CF3)2, respectively). Besides, the Raman peaks for the stretching vibration of S
16.7 for DHCE-PhCF3 and DHCE-1,4-Ph(CF3)2, respectively). Besides, the Raman peaks for the stretching vibration of S![[double bond, length as m-dash]](https://www.rsc.org/images/entities/char_e001.gif) O (FSI−) exhibit enhanced peaks for contact ion pairs (CIPs) and aggregated ion pairs (AGG) in HCE and DHCEs compared to the diluted electrolyte (Fig. 3c and e). According to the detailed analysis of Raman spectra, the addition of diluent solvents into HCE subtly regulates the first solvation sheath of Na+ in the following ways: (1) the ratios of AGG reduce as the CIP ratios increase in DHCEs; (2) the free TEP solvent and FSI− are slightly increased with introducing diluents (please see detailed fitting ratios in Fig. 3d and e). Besides, the Raman results indicate that the diluent with more F atoms (1,4-Ph(CF3)2) is more likely to release TEP and FSI− from the inner coordination sheath of Na+. This is consistent with MD simulations which show that the ratios of the diluent solvent with more F atoms increase and the solvated TEP and FSI− decrease in the primary solvation sheath as discussed above.
O (FSI−) exhibit enhanced peaks for contact ion pairs (CIPs) and aggregated ion pairs (AGG) in HCE and DHCEs compared to the diluted electrolyte (Fig. 3c and e). According to the detailed analysis of Raman spectra, the addition of diluent solvents into HCE subtly regulates the first solvation sheath of Na+ in the following ways: (1) the ratios of AGG reduce as the CIP ratios increase in DHCEs; (2) the free TEP solvent and FSI− are slightly increased with introducing diluents (please see detailed fitting ratios in Fig. 3d and e). Besides, the Raman results indicate that the diluent with more F atoms (1,4-Ph(CF3)2) is more likely to release TEP and FSI− from the inner coordination sheath of Na+. This is consistent with MD simulations which show that the ratios of the diluent solvent with more F atoms increase and the solvated TEP and FSI− decrease in the primary solvation sheath as discussed above.
Based on the above discussion, the spectroscopic characterization and theoretical results agree well, which confirms that the chemical environment formed by the fluorocarbon diluents is not “ideally inert”. Instead, the diluents intensively regulate the local and global solution structures and thus remarkably tailor the Na+ transport phenomenon in electrolytes.
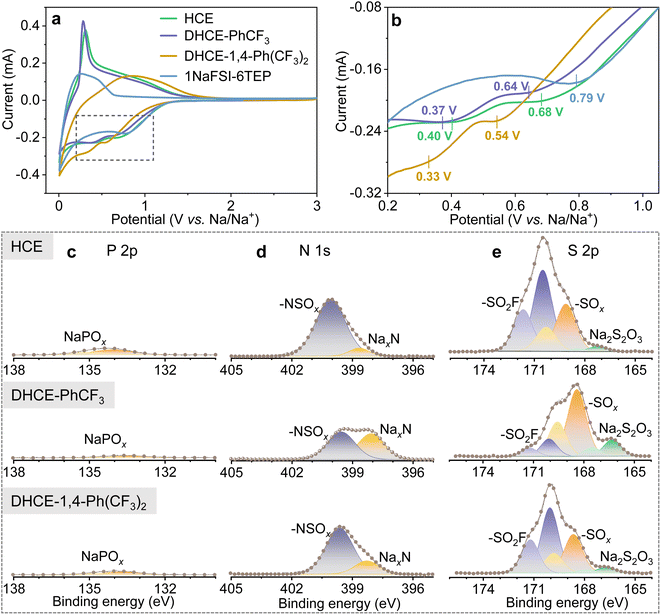
The fluorocarbon diluents play substantial roles in regulating the global and local electrolyte solution structure and the TEP–Na+–FSI− solvation strength. Therefore, it is expected that the diluent would modulate the reduction and oxidation voltages and kinetics of TEP solvent and FSI− during the SEI/CEI layer formation. Fig. 4a, b and S8† show the initial and following cyclic voltammetry (CV) curves of hard carbon (HC) anodes in different electrolytes. It can be found that HCE and DHCEs effectively limit the reduction of TEP solvents at low voltage. SEI layer formation of HCE and DHCEs is mainly contributed by the decomposition of NaFSI salt, which is confirmed by X-ray photoelectron spectroscopy (XPS) characterization of HC anodes as shown in Fig. 4c–e. Limited P 2p signals from the decomposition of TEP and obvious N 1s and S 2p peaks from the decomposition of NaFSI are observed in both HCE and DHCEs.
Furthermore, it can be found that all initial CV curves exhibit reduction peaks (mainly from NaFSI) in a broad voltage range in both HCE and DHCEs (Fig. 4b). Two reduction peaks centered at 0.68 V and 0.40 V are observed in HCE. For the DHCEs, the two reduction peaks both shift to more negative voltage sides (0.64/0.37 V for DHCE-PhCF3 and 0.54/0.33 V for DHCE-1,4-Ph(CF3)2). The different reduction voltages for NaFSI salt in different electrolytes confirm variable decomposition pathways and kinetics of electrolytes, which is closely associated with electrolyte structures in different DHCEs. The loosened solvation structure in DHCE-PhCF3 allows a much more complete decomposition of NaFSI salt with higher contents of NaxN, NaxSOy, and Na2S2O3 observed in the SEI (Fig. 4d and e). While the strengthened external solvation structure in DHCE-1,4-Ph(CF3)2 postpones the reduction of FSI− in the solvation sheaths and causes incomplete reduction products of FSI− which could not effectively suppress the subsequent electrolyte decomposition. This is evidenced by the irreversible intercalation/deintercalation of Na+ in the HC anode from the CV curves (yellow curve in Fig. 4a and S8d†) of this electrolyte. The complete decomposition of NaFSI in DHCE-PhCF3 benefits the formation of an effective SEI on the HC anode and allows reversible Na+ storage in the HC anode. This is evidenced by the well-overlapped following CV curves in these two electrolytes (Fig. S8b and c†). Besides, a similar trend is observed with NaCu1/9Ni2/9Fe1/3Mn1/3O2 (CNFM) cathodes. Fig. S9† shows the CNFM cathodes exhibiting well-overlapped CV curves in HCE and DHCE-PhCF3 while the dilute electrolyte and DHCE-1,4-Ph(CF3)2 could not allow reversible Na+ storage in the CNFM cathode. This notes that DHCE-PhCF3 shows greatly enhanced reduction/oxidation peaks for the CNFM cathode, suggesting faster Na+ storage kinetics, which is consistent with the improved Na+ transport properties discussed above. Therefore, the solvation structure of Na+ could be used to engineer the properties of the SEI/CEI layers35 and furthermore, modify the performance of Na-ion batteries (which will be further discussed later).
Electrochemical performance
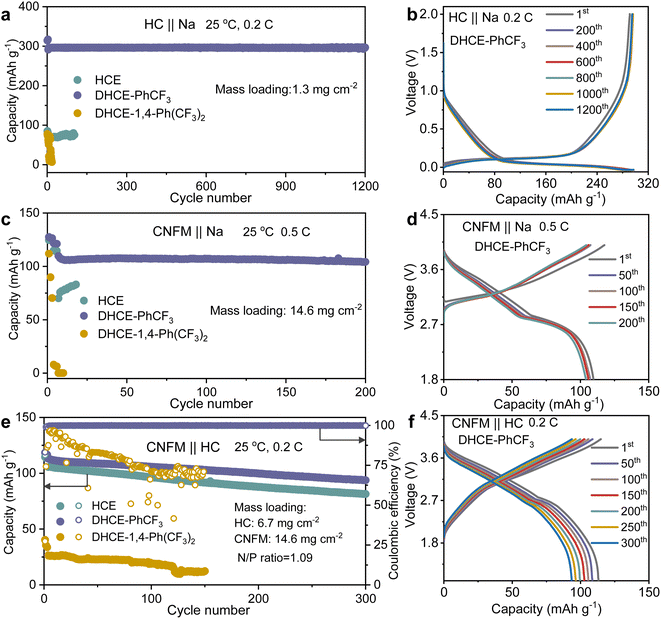
The electrochemical performance of the studied electrolytes is comprehensively evaluated to establish the fundamental correlation between the electrolyte structure and cell performance. The compatibilities of the anode and cathode in Na-ion batteries in these studied electrolytes are systematically assessed with HC‖Na, CNFM‖Na half cells and CNFM‖HC full cells. It could be found that the HC anode demonstrates relatively stable cycling at 0.2C in HCE but with a limited Na+ storage capacity of 85 mA h g−1 in the initial cycle (cyan curve in Fig. 5a and S10a†). This phenomenon could be ascribed to the sluggish Na+ transport kinetics as discussed earlier in this work. Besides, DHCE-1,4-Ph(CF3)2 also demonstrates poor reversible Na+ storage in the HC anode and shows fast capacity decay during cycling (yellow curve in Fig. 5a and S10a†). In sharp contrast, DHCE-PhCF3 exhibits a very stable Na+ storage capacity of 300 mA h g−1 at 0.2C over 1200 cycles. Well-overlapped charge–discharge curves with negligible polarization increases are demonstrated in Fig. 5b. In addition, the CNFM‖Na half cells exhibit a similar phenomenon to the HC anodes. DHCE-PhCF3 still exhibits the best Na+ storage kinetics with a high reversible capacity of 125.6 mA h g−1 at 0.1C (Fig. S10b†). Besides, the CNFM‖Na half cells show a significant improvement in cycling stability with a capacity retention of 94.2% over 200 cycles at 0.5C with overlapped charge–discharge curves (Fig. 5c and d). However, the HCE and DHCE-1,4-Ph(CF3)2 show significantly deteriorated Na+ storage capacity and kinetics for the CNFM cathodes. CNFM‖Na suddenly failed within 20 cycles in HCE and DHCE-1,4-Ph(CF3)2 even could not enable the operation of CNFM‖Na at 0.5C initially (Fig. 5c and S10b†). Additionally, DHCE-PhCF3 exhibits the best rate performance for both transition metal oxides and phosphate-based cathodes in Na-ion batteries (Fig. S11†).CNFM‖HC full cells are further evaluated for these electrolytes. As shown in Fig. 5e, the CNFM‖HC full cell could demonstrate a reversible capacity of 105.6 mA h g−1 at 0.2C and a capacity retention of 77% over 300 cycles in the HCE. Noticeably, the introduction of PhCF3 and 1,4-Ph(CF3)2 diluents in the HCE brings a significant difference in the electrochemical performance of the CNFM‖HC full cells. With DHCE-1,4-Ph(CF3)2, the CNFM‖HC full cell exhibits the lowest initial capacity of 37.6 mA h g−1 and significantly reduced coulombic efficiency (∼86% after 30 cycles at 0.2C) (Fig. 5e and S12†). In sharp contrast, the CNFM‖HC full cell using DHCE-PhCF3 presents a greatly improved reversible capacity of 113.1 mA h g−1 at 0.2C and capacity retention of 82.7% after 300 cycles (Fig. 5e). The charge–discharge curves of the CNFM‖HC full cell with DHCE-PhCF3 also exhibit minimal changes over 300 cycles (Fig. 5f). Additionally, the high-temperature performances of the DHCE-PhCF3 are further evaluated. As shown in Fig. S13,† the HC‖Na, CNFM‖Na, and CNFM‖HC cells all demonstrate robust cycling stability at a high temperature of 60 °C. These results indicate that the electrochemical performances of cells are highly correlated with solvation structures at the molecular level of the electrolytes. Appropriate optimization of the internal and external solvation structures via diluents could provide a potential approach for future goal-oriented electrolyte design for different battery chemistries.
Characterization of the electrode interphase
The interphase properties of electrode materials from CNFM‖HC full cells are further investigated to understand the role of different diluents. High-resolution transmission electron microscopy (HRTEM) is employed to study the SEI and CEI morphology on HC anodes and CNFM cathodes. It can be found that HCE generates very thin and non-uniformly covered morphology for both the SEI on the HC anode (Fig. 6a) and CEI on the CNFM cathode (Fig. S14a†). These could be the major reasons for the relatively fast capacity decay of the CNFM‖HC full cell using HCE. In the case of DHCE-PhCF3, XPS analyses indicate that both the SEI layer on the HC anode and the CEI layer on the CNFM cathode contain abundant NaF, –NOx, and –SOx inorganic compounds in an organic matrix, which is beneficial for the effective protection of electrodes (Fig. 4c–e, S15 and S16†). It could be found that the SEI layer formed on the HC anode is uniform in thickness with complete coverage (Fig. 6b). A highly uniform and compact CEI layer could also be observed on the CNFM cathode (Fig. S14b†). The electrode interphase with stable structures and chemistries should account for the excellent electrochemical cell performance in DHCE-PhCF3.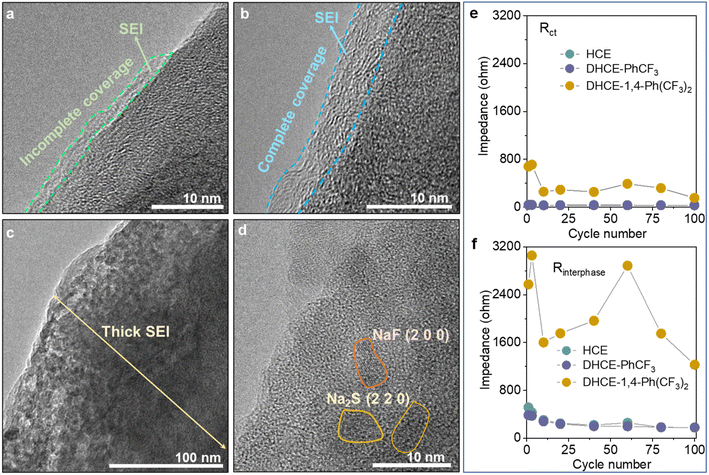 | ||
| Fig. 6 HRTEM images of the HC anodes cycled in (a) HCE, (b) DHCE-PhCF3, and (c and d) DHCE-1,4-Ph(CF3)2. The evolution of (e) Rct and (f) Rinterphase during cycling in the studied electrolytes. | ||
Though 1,4-Ph(CF3)2 has a similar molecular structure to PhCF3, DHCE-1,4-Ph(CF3)2 fails to form a stable interphase on the HC anode and CNFM cathode due to the less stable interfacial layers obtained on electrodes (Fig. 6c). The HRTEM image further demonstrates that the thick SEI layer is filled with many electrolyte by-products, which consist of nanocrystals such as nano-NaF and Na2S particles imbedded in the amorphous base (Fig. 6d). A severe phase change of CNFM from a layered to a rock salt phase and dendritic CEI products are observed on CNFM (Fig. S14c†). Operando-electrochemical impedance spectroscopy (operando-EIS) is further used to study the charge transport kinetics across the interphase in the Na-ion batteries. As shown in Fig. 6e, f and S17,† DHCE-PhCF3 could retain greatly reduced charge transfer resistance (Rct) and interphase resistance (Rinterphase) and present excellent interphasial stability during its long cycle life.
Conclusion
In summary, the roles of diluent solvents in regulating electrolyte structures and chemistry distributions and their correlations with the electrochemical performance of Na-ion batteries are comprehensively investigated. Notably, PhCF3 and 1,4-Ph(CF3)2 as diluent solvents exhibit a delicate difference in regulation in internal and external electrolyte solvation structures due to varied and controllable intermolecular forces between low-solvation and high-solvation solvents. DHCE-PhCF3 appropriately decouples the local and global electrolyte structures, thus enabling fast Na+ transport kinetics and a robust interphase spontaneously, which leads to excellent cycling stability of the HC anode and CNFM cathode in Na-ion batteries. It can be concluded that the electrolyte solvation structure demonstrates a strong correlation to the final Na+ storage and interphase chemistry from thermodynamic and kinetics aspects in the Na-ion batteries.Data availability
The data that support the findings of this study are available within the article and its ESI,† or from the corresponding author on reasonable request.Author contributions
H. P. and M. M. conceived the idea for this work. M. M. carried out the experimental design, characterization and electrochemical measurement. B. C. conducted MD calculations. M. M. and B. C. wrote the draft manuscript. H. P. revised the manuscript. All authors participated in the analysis of the experimental data, the discussions of the results and the preparation of the paper.Conflicts of interest
There are no conflicts of interest to declare.Acknowledgements
This research was supported by the National Natural Science Foundation of China (Grant No. U21A2075), the Zhejiang Provincial Natural Science Foundation of China under Grant No. LR23B030003, the Startup Foundation for Hundred-Talent Program of Zhejiang University and the program of the State Key Laboratory of Clean Energy Utilization (ZJUCEU2020005).References
- C. Bommier and X. Ji, Small, 2018, 14, 1703576–1703596 CrossRef PubMed.
- A. Ponrouch, D. Monti, A. Boschin, B. Steen, P. Johansson and M. R. Palacín, J. Mater. Chem. A, 2015, 3, 22–42 RSC.
- K. Xu, Chem. Rev., 2014, 114, 11503–11618 CrossRef CAS PubMed.
- K. Xu, Chem. Rev., 2004, 104, 4303–4414 CrossRef CAS PubMed.
- D. Aurbach, Y. Talyosef, B. Markovsky, E. Markevich, E. Zinigrad, L. Asraf, J. S. Gnanaraj and H.-J. Kim, Electrochim. Acta, 2004, 50, 247–254 CrossRef CAS.
- A. M. Haregewoin, A. S. Wotango and B.-J. Hwang, Energy Environ. Sci., 2016, 9, 1955–1988 RSC.
- M. Li, C. Wang, Z. Chen, K. Xu and J. Lu, Chem. Rev., 2020, 120, 6783–6819 CrossRef CAS PubMed.
- L. Suo, Y.-S. Hu, H. Li, M. Armand and L. Chen, Nat. Commun., 2013, 4, 1481–1490 CrossRef PubMed.
- O. Borodin, J. Self, K. A. Persson, C. Wang and K. Xu, Joule, 2020, 4, 69–100 CrossRef CAS.
- J. Wang, Y. Yamada, K. Sodeyama, E. Watanabe, K. Takada, Y. Tateyama and A. Yamada, Nat. Energy, 2017, 3, 22–29 CrossRef.
- J. Wang, Y. Yamada, K. Sodeyama, C. H. Chiang, Y. Tateyama and A. Yamada, Nat. Commun., 2016, 7, 12032–12041 CrossRef CAS PubMed.
- X. Cao, H. Jia, W. Xu and J.-G. Zhang, J. Electrochem. Soc., 2021, 168, 010522–010536 CrossRef CAS.
- K. Takada, Y. Yamada and A. Yamada, ACS Appl. Mater. Interfaces, 2019, 11, 35770–35776 CrossRef CAS PubMed.
- X. Ren, S. Chen, H. Lee, D. Mei, M. H. Engelhard, S. D. Burton, W. Zhao, J. Zheng, Q. Li, M. S. Ding, M. Schroeder, J. Alvarado, K. Xu, Y. S. Meng, J. Liu, J.-G. Zhang and W. Xu, Chem, 2018, 4, 1877–1892 CAS.
- S. Chen, J. Zheng, L. Yu, X. Ren, M. H. Engelhard, C. Niu, H. Lee, W. Xu, J. Xiao, J. Liu and J.-G. Zhang, Joule, 2018, 2, 1548–1558 CrossRef CAS.
- T. Doi, Y. Shimizu, M. Hashinokuchi and M. Inaba, J. Electrochem. Soc., 2017, 164, A6412–A6416 CrossRef CAS.
- Y. Yamada, J. Wang, S. Ko, E. Watanabe and A. Yamada, Nat. Energy, 2019, 4, 269–280 CrossRef CAS.
- M. Okoshi, C. P. Chou and H. Nakai, J. Phys. Chem. B, 2018, 122, 2600–2609 CrossRef CAS PubMed.
- K. Dokko, D. Watanabe, Y. Ugata, M. L. Thomas, S. Tsuzuki, W. Shinoda, K. Hashimoto, K. Ueno, Y. Umebayashi and M. Watanabe, J. Phys. Chem. B, 2018, 122, 10736–10745 CrossRef CAS PubMed.
- Z. Zeng, V. Murugesan, K. S. Han, X. Jiang, Y. Cao, L. Xiao, X. Ai, H. Yang, J.-G. Zhang, M. L. Sushko and J. Liu, Nat. Energy, 2018, 3, 674–681 CrossRef CAS.
- Z. Yang, J. He, W. H. Lai, J. Peng, X. H. Liu, X. X. He, X. F. Guo, L. Li, Y. Qiao, J. M. Ma, M. Wu and S. L. Chou, Angew Chem., Int. Ed., 2021, 60, 27086–27094 CrossRef CAS PubMed.
- X. Zhang, L. Zou, Y. Xu, X. Cao, M. H. Engelhard, B. E. Matthews, L. Zhong, H. Wu, H. Jia, X. Ren, P. Gao, Z. Chen, Y. Qin, C. Kompella, B. W. Arey, J. Li, D. Wang, C. Wang, J. G. Zhang and W. Xu, Adv. Energy Mater., 2020, 10, 2000368–2000379 CrossRef CAS.
- Z. Yu, N. P. Balsara, O. Borodin, A. A. Gewirth, N. T. Hahn, E. J. Maginn, K. A. Persson, V. Srinivasan, M. F. Toney, K. Xu, K. R. Zavadil, L. A. Curtiss and L. Cheng, ACS Energy Lett., 2021, 7, 461–470 CrossRef.
- S. Perez Beltran, X. Cao, J.-G. Zhang and P. B. Balbuena, Chem. Mater., 2020, 32, 5973–5984 CrossRef CAS.
- K. Ueno, J. Murai, K. Ikeda, S. Tsuzuki, M. Tsuchiya, R. Tatara, T. Mandai, Y. Umebayashi, K. Dokko and M. Watanabe, J. Phys. Chem. C, 2016, 120, 15792–15802 CrossRef CAS.
- T. Sudoh, K. Shigenobu, K. Dokko, M. Watanabe and K. Ueno, Phys. Chem. Chem. Phys., 2022, 24, 14269–14276 RSC.
- S. Lin, H. Hua, P. Lai and J. Zhao, Adv. Energy Mater., 2021, 11, 2101775–2101785 CrossRef CAS.
- F. Ren, Z. Li, J. Chen, P. Huguet, Z. Peng and S. Deabate, ACS Appl. Mater. Interfaces, 2022, 14, 4211–4219 CrossRef CAS PubMed.
- Y. Wu, A. Wang, Q. Hu, H. Liang, H. Xu, L. Wang and X. He, ACS Cent. Sci., 2022, 8, 1290–1298 CrossRef CAS PubMed.
- Q. Sun, Z. Cao, Z. Ma, J. Zhang, H. Cheng, X. Guo, G.-T. Park, Q. Li, E. Xie, L. Cavallo, Y.-K. Sun and J. Ming, ACS Energy Lett., 2022, 7, 3545–3556 CrossRef CAS.
- S. Perez Beltran, X. Cao, J.-G. Zhang, P. Z. El-Khoury and P. B. Balbuena, J. Mater. Chem. A, 2021, 9, 17459–17473 RSC.
- M. Ma, B. Chen, X. Yang, Y. Liu, S. Dai, X. Qi, Y.-S. Hu and H. Pan, ACS Energy Lett., 2022, 8, 477–485 CrossRef.
- N. M. Vargas-Barbosa and B. Roling, ChemElectroChem, 2020, 7, 367–385 CrossRef CAS.
- H. Nakagawa, M. Ochida, Y. Domi, T. Doi, S. Tsubouchi, T. Yamanaka, T. Abe and Z. Ogumi, J. Power Sources, 2012, 212, 148–153 CrossRef CAS.
- Y.-S. Hu and H. Pan, ACS Energy Lett., 2022, 7, 4501–4503 CrossRef CAS.
Footnotes |
| † Electronic supplementary information (ESI) available. See DOI: https://doi.org/10.1039/d3sc01453c |
| ‡ These authors contributed equally to this work. |
| This journal is © The Royal Society of Chemistry 2023 |

