 Open Access Article
Azacrown-calixpyrrole isosteres: receptors and sensors for anions†
Austin R.
Sartori‡
,
Aco
Radujević‡
,
Sandra M.
George
and
Pavel
Anzenbacher
Jr
 *
*
Bowling Green State University, Center for Photochemical Sciences, Bowling Green, Ohio 43403, USA. E-mail: pavel@bgsu.edu
First published on 15th June 2023
Abstract
Calix[4]pyrroles (CPs) and polyammonium azacrowns (ACs) are well-known receptors for anions. CPs bind anions by directional hydrogen bonds that do not always work well for aqueous analytes. The positive charge in polyammonium ACs allows for a stronger but non-directional anion-ammonium electrostatic attraction but lack selectivity. Bridging the gap between CPs and ACs could increase affinity and potentially preserve the selectivity of anion binding. We have synthesized a flexible calixpyrrole-azacrown near isosteric receptor and incorporated an environmentally sensitive dansyl fluorophore to enable fluorescence measurements. Anion binding was evaluated using NMR and fluorescence titrations. The isosteric receptor shows a strong affinity for aqueous phosphates and phosphonates (Na+ salts) in the order HAsO42− > H2PO4− > H2P2O72− > glyphosate2− > AMP− > methylphosphonate− ≫ ADP2− or ATP3− but does not bind halides. This is in stark contrast to CP which shows a strong preference for halides over oxyanions. The anion binding by the new receptor was accompanied by analyte-specific changes in fluorescence intensity and spectral width and by a wavelength shift. These parameters were used in qualitative and quantitative sensing of aqueous anions. By applying machine-learning algorithms, such as linear discriminant analysis and support vector machine linear regression, this one sensor can differentiate between 10 different analytes and accurately quantify herbicide glyphosate and methylphosphonate, a product of sarin, soman or cyclosarin hydrolysis. In fact, glyphosate can be quantified even in the presence of competing anions such as orthophosphate (LODs were ≤ 1 μM).
Introduction
Anion recognition, binding, and sensing is an important research endeavour spurred by the need for materials and devices useful for the detection and quantitation of anions for biochemical, environmental, agricultural, and industrial applications.1,2 These applications encompass a wide range of areas, including homeostasis monitoring, drug development, studies of phosphate-caused eutrophication, and the application of pesticides and herbicides. Here, small anions such as orthophosphate (Pi), pyrophosphate (PPi), and small-molecule phosphonates such as alkyl-phosphonates (e.g., methylphosphonate or phosphonomethyl glycine, also known as glyphosate – an active ingredient of herbicide Roundup™) are difficult to recognize in water as they display a high energy of hydration of −473, −1089, and −2753 kJ mol−1 for H2PO4−, HPO42−, and PO43−, respectively.3,4 As a result, the solvation of phosphates is extensive, and even the simplest of such anions, orthophosphates, form hydrates with up to 40 water molecules (∼11 for H2PO4−, ∼20 HPO42−, and ∼39 PO43−).4 This, together with complex protonation equilibria and the structural diversity of phosphate anions, makes the design and preparation of phosphate receptors difficult.5 Nevertheless, current reviews6–9 show that progress has been made in the area of recognition of phosphate-type anions. However, there are still many challenges associated with phosphate oligomerization10,11 and selectivity (or cross-reactivity)12,13 of artificial phosphate receptors that impact sensing applications.
Thus, sensors for anions that are capable of distinguishing and quantifying phosphates such as (di)hydrogen phosphate (Pi), pyrophosphate (PPi), as well as nucleotide phosphates and related compounds such as phosphonates are sought after.14 Among the artificial receptors for small oxyanions, three main approaches have emerged: one utilizing hydrogen-bonding arrays as it is, for example, in cyanostars,15 macrocyclic amides,16 or calixpyrroles (CPs),17,18 receptors utilizing metal ion-phosphate coordination,19–22 and poly-ammonium azacrown (AC) receptors.23–26 Each of these approaches provide distinct advantages but also shortcomings. For example, the hydrogen bond receptors are weaker and may not work well in strongly competitive aqueous media but offer hydrogen-bond directionality and fast kinetics. On the other hand, metal-anion coordination offers high anion affinities and a certain predesigned topology stemming from coordination geometry but may suffer from slower dissociation kinetics. Finally, polyammonium azacrown receptors also display an affinity for oxyanions, but the non-directional nature of electrostatic attraction may negatively impact their anion selectivity.
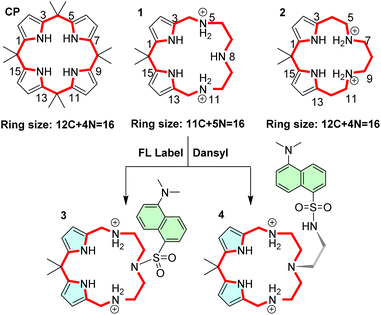
To improve the anion binding capabilities of hydrogen bonding-based receptors such as calixpyrroles (CPs), we have decided to replace two of the four pyrrole hydrogen bond donors with ammonium moieties of an azacrown (AC). Protonation of the AC amines was to deliver an ammonium functionality to enhance the anion binding, while conserving the two remaining pyrroles was expected to preserve selectivity. The overall size of the receptor was maintained to generate isosteres or near-isosteric receptors, i.e., a molecule with similar shape and electronic properties. Two hybrid isosteric macrocycles, 1 and 2, were devised (Fig. 1). Trans-isosteres with the pyrrole moieties positioned across the ring are also possible. However, the preliminary calculations suggested that 1 and 2 will be better receptors as they conserve half of the CP and half of the AC moieties.
The CP isosteres 1 and 2 can be converted to their fluorescent congeners comprising a fluorescent label. In our proof-of-principle experiment, we decided to build on the molecular framework 1 as this macrocycle provides the easiest entry to the structurally close fluorescent sensors 3 and 4.
Results
Design and synthesis of fluorescent imine macrocycles
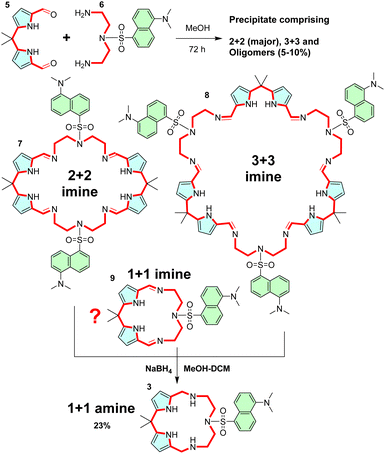
To explore the above concept, we chose structure 3. The condensation of dipyrromethane dialdehyde 5 (ref. 27) and diamine 6 (ref. 28) yields the corresponding Schiff base (imine) macrocycle, which is reduced to 3 by treatment with NaBH4 (Scheme 1). Alternatively, TREN-derived dansyl diamine29 yields sensor 4. Reacting dialdehyde and diamine precursors in methanol yields a precipitate comprising imine oligomers, and 2 + 2 and 3 + 3 imine macrocycles 7 and 8, respectively. Unfortunately, no appreciable amounts of 1 + 1 imine macrocycle 9 (direct precursor of 3) were observed in the MALDI-MS spectra of this mixture. This could be due to the low stability of the relatively strained 1 + 1 imine 9 or due to the dynamic covalent nature of the imine bond30,31 which may not survive the conditions (highly protic matrices) used to obtain the MALDI-MS spectra. Unfortunately, NMR did not provide a deeper insight into the composition of reaction mixtures either.Importantly, when the crude condensation mixture is reduced with sodium borohydride, the 1 + 1 diamine macrocycle 3 is isolated from the mixture as a major product in 23% yield. For the proof of principle investigation, we chose 3, because it does not have a lariat moiety like 4, which would preclude a direct comparison with CP.
NMR solution studies of anion binding by sensor 3
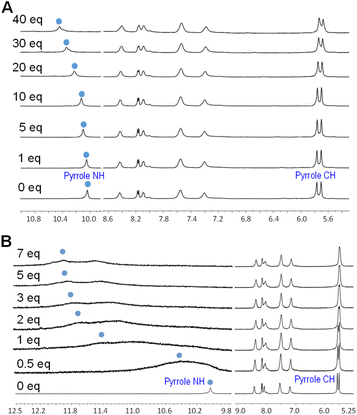
It is well known that calix[4]pyrrole (CP), i.e., the 16-membered ring compound (Fig. 1), binds anions with a marked preference for F− over other putative anionic guests Cl−, Br−, H2PO4− and HSO4− in that order.32 However when 3 was tested for binding of anions, an entirely different pattern emerged. NMR studies showed that 3 does not bind halides but binds oxyanions such as phosphates, arsenate, and even phosphonates (Fig. S7–S9†). In general, the anion binding by 3 results in the expected large down-field shifts of the pyrrole NH resonances due to direct hydrogen-bonding with the anion and the small magnitude up-field shifts of the pyrrole β-CHs associated with macrocycle conformational changes together with a signal broadening and very small shifts of the naphthalene signals (Fig. 3). The resonances associated with the aliphatic AC portion of the macrocycle are obscured by the signals from the TBA cation. However, by comparing the course of NMR titration experiments of CP and 3 it is immediately obvious that both receptors behave in a very different way (Fig. 3A and S7†). For example, CP binds chloride (1![[thin space (1/6-em)]](https://www.rsc.org/images/entities/char_2009.gif) :
:![[thin space (1/6-em)]](https://www.rsc.org/images/entities/char_2009.gif) 1 stoichiometry) with a high affinity, as shown by the down-field shift of pyrrole NHs from 9.23 to 10.98, the pyrrole β-H up-field shift from 5.67 to 5.42 (ppm, DMSO-d6) and the calculated Kasoc = 1000 ± 62 M−1.33 This is in stark contrast to 3, which does not show appreciable binding of Cl− as evidenced by the shift of the pyrrole NH signals from 10.03 to 10.41 and a small pyrrole β-H shift from 5.53 to 5.50 (ppm, DMSO-d6). Finally, the saturation behaviour was not observed even at 60 equiv. of Cl− (Fig. 3A) (Kasoc < 10 M−1). A similar, albeit slightly more complex behaviour was observed with F− (Fig. S8†). Finally, 3 does not bind Br−.
1 stoichiometry) with a high affinity, as shown by the down-field shift of pyrrole NHs from 9.23 to 10.98, the pyrrole β-H up-field shift from 5.67 to 5.42 (ppm, DMSO-d6) and the calculated Kasoc = 1000 ± 62 M−1.33 This is in stark contrast to 3, which does not show appreciable binding of Cl− as evidenced by the shift of the pyrrole NH signals from 10.03 to 10.41 and a small pyrrole β-H shift from 5.53 to 5.50 (ppm, DMSO-d6). Finally, the saturation behaviour was not observed even at 60 equiv. of Cl− (Fig. 3A) (Kasoc < 10 M−1). A similar, albeit slightly more complex behaviour was observed with F− (Fig. S8†). Finally, 3 does not bind Br−.
On the other hand, 3 was found to bind H2PO4− and other phosphorus oxyanions (1![[thin space (1/6-em)]](https://www.rsc.org/images/entities/char_2009.gif) :
:![[thin space (1/6-em)]](https://www.rsc.org/images/entities/char_2009.gif) 1 stoichiometry) with a high affinity. This is illustrated by a significant broadening and the down-field shift of the NH peak from 10.05 to 12.10 ppm, a significantly larger shift compared to the one observed for halides (Fig. 3B). The splitting of the NH signals into 12.10 and 11.64 ppm suggests that each NH moiety interacts with a different oxygen of the phosphate. This hypothesis is supported by DFT calculations (Fig. 2) and by the β-H shift from 5.53 to 5.49 ppm. This behaviour differs from CP, which generally does not bind phosphate with high affinity.18,32,34 Taken together, the NMR measurements strongly indicate that the halide-phosphate anion-binding selectivity is reversed in 3. The binding affinities for anions were further investigated by fluorescence spectroscopy. Fig. 2 shows the DFT model of sensor 3 in the resting state: two pyrrole moieties are oriented up and down as in the alternate conformation of CP,35 while ammonium N–Hs are pointing into-and-slightly-above the cavity of the macrocycle. In the complex with dihydrogen phosphate, both the pyrrole NHs and the ammonium NHs are engaged in the hydrogen bonding to the phosphate oxygens.
1 stoichiometry) with a high affinity. This is illustrated by a significant broadening and the down-field shift of the NH peak from 10.05 to 12.10 ppm, a significantly larger shift compared to the one observed for halides (Fig. 3B). The splitting of the NH signals into 12.10 and 11.64 ppm suggests that each NH moiety interacts with a different oxygen of the phosphate. This hypothesis is supported by DFT calculations (Fig. 2) and by the β-H shift from 5.53 to 5.49 ppm. This behaviour differs from CP, which generally does not bind phosphate with high affinity.18,32,34 Taken together, the NMR measurements strongly indicate that the halide-phosphate anion-binding selectivity is reversed in 3. The binding affinities for anions were further investigated by fluorescence spectroscopy. Fig. 2 shows the DFT model of sensor 3 in the resting state: two pyrrole moieties are oriented up and down as in the alternate conformation of CP,35 while ammonium N–Hs are pointing into-and-slightly-above the cavity of the macrocycle. In the complex with dihydrogen phosphate, both the pyrrole NHs and the ammonium NHs are engaged in the hydrogen bonding to the phosphate oxygens.
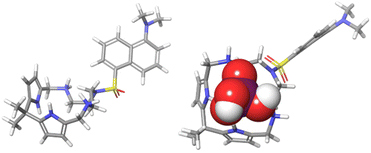 | ||
| Fig. 2 Optimized geometries of 32+ (left), and H2PO4− ⊂ 32+ (right) in DMSO (PCM) at the pbepbe/def2svp level of theory in DMSO (PCM). The computational details are provided in the ESI.† | ||
UV-vis and fluorescence titration studies
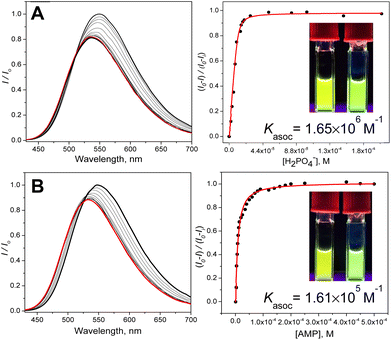
The NMR experiments suggest that sensor 3 shows the ability to bind anions while displaying a different selectivity compared to that of the CP parent, a feature that would be advantageous for sensing. To explore the potential of this new isostere macrocycle for anion sensing, we have attached a fluorophore that enables observation of anion binding using fluorescence titration experiments. To this end, we introduced a dansyl fluorophore, one of the simplest environmentally sensitive fluorophores. We reasoned that if the proof-of-principle experiments work out, better, more sensitive, or more emissive fluorophores may be used.36,37 We have chosen an environmentally sensitive fluorophore because it can respond to the change in local polarity induced by the bound anion and associated solvate water. The UV-vis spectrum of dansyl displays an intramolecular charge transfer (ICT) band at ca. 290–420 nm and π–π* absorption below 290 nm (Fig. S10†).The fluorescence comes predominantly from the ICT excited state (λem ∼540 nm), potentially with a small blue-shifted contribution from the local excited (LE) state (∼485 nm).38 The relative contributions of these two excited states (I485/I540) change with the polarity of the medium.38 We reasoned that a formation of a static complex anion ⊂ 32+, depending on the difference in charge density and solvation, could induce an anion (analyte)-specific change in fluorescence intensity accompanied by a shift in the emission wavelength signals that could be harnessed for the identification and quantitation of the anions (Fig. 4, S11–S24†).
The fluorescence sensing experiments were then performed by recording the anion-induced changes in the fluorescence spectra characterized by three parameters: a change in fluorescence intensity, the width of the emission band (FWHM), and the spectral wavelength shift. The analytes were added as sodium salts in pure water to the solution of the sensor in 15% water–DMSO. As expected from the NMR experiments, the addition of halides (NaF, NaCl, and NaBr), NaNO3 and NaHSO4 did not yield appreciable changes in fluorescence, and we conclude that these anions do not interact with 3 (Fig. S18, S19 and S24†). On the other hand, small phosphate anions interact strongly with 3. These include NaH2PO4 (Pi), Na2H2P2O7 (PPi), and AMP (disodium salt), but also the structurally similar Na2HAsO4. Fig. 4 shows examples of anion-induced changes in the fluorescence spectra of 3. Interestingly, while appearing to be relatively small, the changes are clearly observable by the naked eye.
Furthermore, some phosphonates, particularly disodium phosphonomethyl glycine (glyphosate, GlyP), an active ingredient in a widely used herbicide (Roundup™) and sodium methylphosphonate (MPA), show a strong affinity for sensor 3. Sodium phenylphosphonate (PhPA) and ethyl ester of methylphosphonic acid (EMPA) did not show an appreciable affinity for 3.
Table 1 summarizes the calculated affinity constants together with the degree of quenching (%), the width (FWHM) of the fluorescence peak (nm), and a shift of the maxima (nm). The highest binding constants were obtained for phosphate (Fig. 5 and Table 1) and a structurally similar arsenate. The slightly higher affinity for arsenate is presumably due to the di-anionic nature of hydrogen arsenate and dihydrogen pyrophosphate (compared to that of monoanionic dihydrogen phosphate). Finally, AMP displays a lower affinity for the sensor, perhaps due to the steric penalty incurred by the ribose-adenine moiety. Overall, the data in Table 1 clearly show that strong binding of small phosphates is associated with stronger fluorescence quenching and larger blue-shifts in the emission spectra.
| Anion | K asoc | Quench (%) | FWHM (nm) | Shift (nm) |
|---|---|---|---|---|
| a The Kasoc values were calculated based on the change in fluorescence intensity upon an incremental addition of each anion (sodium salts in water). All fitting errors were <15%. λexc = 370 nm. The association constants were calculated using non-linear least-square fitting. NR – no appreciable response was observed. b ND – not determined due to what appears to be a partial deprotonation of the sensor and the ensuing complex equilibria. c K asoc was not determined due to the biphasic nature of the isotherm. | ||||
| F− | NDb | 5 | 119 | 0 |
| Cl− | <10 | 6 | 113 | 6 |
| Br− | <10 | 3 | 113 | 0 |
| NO3− | NR | +2 | 120 | 0 |
| HSO4− | NR | 0 | 118 | 0 |
| CH3CO2− | <100b | +7 | 115 | 12 |
| H2PO4− | 1.65 × 10⁶ | 18 | 113 | 14 |
| H2P2O72− | 5.82 × 10⁵ | 24 | 113 | 14 |
| HAsO42− | 3.55 × 10⁶ | 25 | 116 | 12 |
| AMP | 1.61 × 10⁵ | 12 | 111 | 18 |
| ADP | <100c | 9 | 117 | 6 |
| ATP | <100c | 7 | 120 | 6 |
| GlyP | 2.70 × 10⁵ | 12 | 119 | 9 |
| MPA | 8.20 × 10⁴ | 8 | 115 | 10 |
| PhPA | <100 | 0 | 116 | 14 |
| EMPA | <100 | +2 | 119 | 6 |
The analysis of the data in Table 1 suggests that sensor 3 is cross-reactive, as it binds and responds to multiple different analytes. The important question is, however, whether the response is analyte-specific and allows for differentiation among individual analytes. To address this question, we have analysed the sensor responses using the three parameters that characterize the overall spectral response: the change in fluorescence intensity (degree of quenching), the width of the emission band (full width at half maximum, FWHM) and the blue-shift of the fluorescence maximum. The reason for considering these factors comes from the fact that the dansyl emission reflects the balance between the LE and ICT excited states, which determines the intensity, shift, and spectral width of the emission. This LE/ICT balance is affected by the charge and polarity of the environment surrounding the fluorophore, i.e., the charge of the anion as well as the dipole of the hydrate sphere.
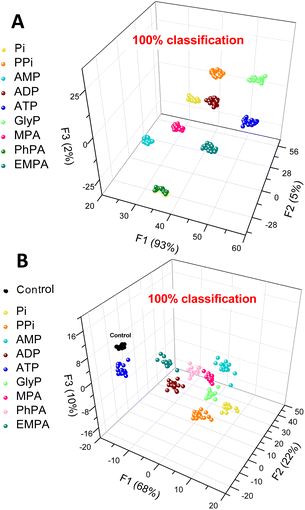
To prove this hypothesis, we subjected the above three parameters to linear discriminant analysis (LDA),39,40 a pattern recognition method that utilizes machine learning to perform multivariate analysis of the data and classification of the data points into classes corresponding to each of the anions tested. The graphical output then allows for a simpler interpretation of the observed changes in fluorescence. The LDA analysis (Fig. 5A) clearly shows that sensor 3 can differentiate between 9 aqueous phosphate and phosphonate analytes (Pi, PPi, AMP, ADP, ATP, GlyP, and MPA) and a control (water), and even the phosphonates (PhPA and EMPA) that elicit only a weak response were all classified with 100% accuracy. Conversely, the halides (NaF, NaCl, and NaBr), NaNO3, and NaHSO4 have not been included in the panel as sensor 3 does not bind these anions. This experiment (Fig. 5A) provided an unambiguous confirmation that the spectral behaviour is analyte-specific and provides enough information (variance) to allow for differentiation among the anions.
Finally, we aimed to illustrate the potential practical utility of sensor 3 for quantitative sensing of anions in water. For this purpose, we selected methylphosphonate (MPA) and glyphosate (GlyP). Both are important anions for their own reasons: MPA is a product of hydrolysis of nerve agents of the G series (e.g., sarin, soman or cyclosarin) by environmental humidity.41 GlyP is a widely used herbicide, and its health risks, environmental impact, and potential toxicity are being investigated. Both anions are successfully detected and quantified by sensor 3. The quantitative LDA of GlyP and MPA shows that each concentration of the anion gives a distinctive cluster corresponding to the analyte type and concentration.
A clear isotherm-like evolution of each analyte and their corresponding clusters results in a smooth concentration-dependent trend going from the lowest to the highest concentration. This indicates a predictable behaviour of the sensor responses and strongly suggests that sensor 3 can differentiate between the concentrations of the phosphate analytes, a feature that may be leveraged in further analyses of phosphate and phosphonate analytes of interest.
Fig. 6 shows the results of the quantitative analysis using LDA as well as a support vector machine (SVM) linear regression method.42,43 The SVM regression develops calibration models to predict the behaviour of the data corresponding to the unknown concentrations of the analytes (red dot  in Fig. 6B and D). The unknown concentrations were predicted correctly with errors (root mean square error for prediction, RMSEP) of only 1.8 and 6.4% for GlyP and MPA, respectively. This attests to the excellent ability of 3 to quantify the levels of these anions in samples of unknown concentrations.
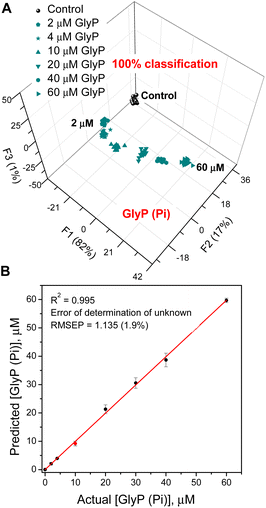
The final experiment shows that sensor 3 can quantify GlyP even in the presence of competing analytes such as Pi, as may happen in an agricultural setting where both Pi and GlyP could be present at the same time (Fig. 7). Sensor 3 binds Pi with Kasoc = 1.65 × 10⁶ M−1 while the Kasoc for GlyP is 2.70 × 10⁵ M−1. To illustrate this, we chose Pi (6.0 μM) as a competitive interferent and varied the GlyP levels between 0 and 60 μM. Fig. 7 shows the results of the quantitative LDA, the results of the corresponding SVM regression, and the determination of an unknown concentration. The data in Fig. 7A show that even though more than 50% of the sensor molecules are engaged in binding to the competing Pi anion, the sensor can still provide an accurate analysis of GlyP. These results suggest that the use of artificial neural networks (ANNs) would allow for the simultaneous determination of concentrations of both phosphate and glyphosate.44
Finally, the detection limits determined for phosphate (Pi), glyphosate (GlyP), and methyl phosphonate (MPA) were 0.6 μM, 0.7 μM, and 1.0 μM, respectively.
Conclusion
In summary, we confirmed the hypothesis that an isosteric receptor in which hydrogen bond donors work in synergy with azacrown-like ammonium moieties would display an improved affinity for anions and a different selectivity profile. We prepared a calix[4]pyrrole isostere comprising two pyrrole hydrogen bond donors and two secondary ammonium moieties. The anion binding by this new macrocycle was investigated by NMR and fluorescence spectroscopy. Leveraging the synergy between the hydrogen-bond donors (pyrrolic NH) and electrostatic attraction allows for strong binding (Kasoc ∼ 105–106 M−1) and sensing of the sodium salts of phosphates and phosphonates added to the sensor as a solution in water. The observed binding affinity order was H2PO4− > H2P2O72− > AMP > ADP > ATP. Interestingly, phosphonomethyl glycine (herbicide glyphosate) and methylphosphonate were also found to interact with the sensor (Kasoc = 105 and 104 M−1, respectively). At the same time, this calix[4]pyrrole isostere sensor does not show appreciable binding of halides (NaF, NaCl, and NaBr), NaNO3, NaHSO4, or carboxylates. This is in stark contrast to the parent calix[4]pyrrole, which preferentially binds halides and does not show an appreciable affinity for oxyanions, and can be used only in organic solvents. The presence of an environmentally sensitive dansyl fluorophore displays a fluorescence response specific to each studied anion. These information-rich responses were analysed by linear discriminant analysis and enabled the unambiguous identification of 10 different analytes using only one sensor molecule. By concurrently applying machine-learning algorithms (LDA and SVM), we were able to accurately quantify glyphosate and methylphosphonate anions. Glyphosate can be accurately quantified even in the presence of an orthophosphate interferent with higher binding affinity. Our results confirm that the isostere approach may be utilized to update old receptors to generate new receptors and sensors for anions with improved affinity and selectivity in the future.Data availability
We have the cartesian coordinates for our computational DFT models (Fig. 2) listed in our ESI† on pages 24 through 30.Author contributions
The project was conceived and conceptualized by Pavel Anzenbacher, Jr. The sythesis, NMR studies, and theoretical calculations were performed by Aco Radujević. The fluorescence titrations were performed jointly by Aco Radujević and Austin R. Sartori. The qualitative and quantitative analyses were performed by Austin R. Sartori. The supporting information was prepared by Austin R. Sartori and Sandra M. George. The manuscript was written by Pavel Anzenbacher, Jr, Austin R. Sartori, and Sandra M. George.Conflicts of interest
There are no conflicts to declare.Acknowledgements
This work was supported by the National Science Foundation (NSF CHE 2102581 to PA) and Bowling Green State University (Building Strength Award, Project no. 3300368 to PA).References
- K. Bowman-James, A. Bianchi and E. García-España, Anion coordination chemistry, Wiley-VCH, Weinheim, 2012 Search PubMed.
- J. L. Sessler, P. Gale, W.-S. Cho, J. F. Stoddart, S. J. Rowan, T. Aida and A. E. Rowan, Anion Receptor Chemistry, Royal Society of Chemistry, 2006 Search PubMed.
- Y. Marcus, Biophys. Chem., 1994, 51, 111–127 CrossRef CAS.
- A. Eiberweiser, A. Nazet, G. Hefter and R. Buchner, J. Phys. Chem. B, 2015, 119, 5270–5281 CrossRef CAS PubMed.
- P. D. Beer and P. A. Gale, Angew. Chem., Int. Ed., 2001, 40, 486–516 CrossRef CAS PubMed.
- A. E. Hargrove, S. Nieto, T. Zhang, J. L. Sessler and E. V. Anslyn, Chem. Rev., 2011, 111, 6603–6782 CrossRef CAS PubMed.
- S. Pal, T. K. Ghosh, R. Ghosh, S. Mondal and P. Ghosh, Coord. Chem. Rev., 2020, 405, 213128 CrossRef CAS.
- J. Wongkongkatep, A. Ojida and I. Hamachi, Top. Curr. Chem., 2017, 375, 30 CrossRef PubMed.
- S.-I. Tamaru and I. Hamachi, Struct. Bonding, 2008, 129, 95–125 CrossRef CAS.
- W. Zhao, A. H. Flood and N. G. White, Chem. Soc. Rev., 2020, 49, 7893–7906 RSC.
- Q. He, P. Tu and J. L. Sessler, Chem, 2018, 4, 46–93 CAS.
- J. J. Lavigne and E. V. Anslyn, Angew. Chem., Int. Ed. Engl., 2001, 40, 3118–3130 CrossRef CAS PubMed.
- M. A. Palacios, R. Nishiyabu, M. Marquez and P. Anzenbacher Jr, J. Am. Chem. Soc., 2007, 129, 7538–7544 CrossRef CAS PubMed.
- (a) A. Radujević, A. Penavic, R. Z. Pavlović, J. D. Badjić and P. Anzenbacher Jr, Chem, 2022, 8, 2228–2244 CrossRef; (b) G. E. Sergeant, V. E. Zwicker and K. A. Jolliffe, Analysis Sensing, 2022, e202200089 Search PubMed; (c) V. E. Zwicker, G. E. Sergeant, E. J. New and K. A. Jolliffe, Org. Biomol. Chem., 2021, 19, 1017–1021 RSC; (d) S. H. Hewitt, G. Macey, R. Mailhot, M. R. J. Elsegood, F. Duarte, A. M. Kenwright and S. J. Butler, Chem. Sci., 2020, 11, 3619–3628 RSC; (e) R. Mailhot, T. Traviss-Pollard, R. Pal and S. J. Butler, Chem.–Eur. J., 2018, 24, 10745–10755 CrossRef CAS PubMed; (f) A. Ojida, Y. Miyahara, J. Wongkongkatep, S. Tamaru, K. Sada and I. Hamachi, Chem.–Asian J., 2006, 1, 555–563 CrossRef CAS PubMed.
- S. Lee, C. H. Chen and A. A. Flood, Nat. Chem., 2013, 5, 704–710 CrossRef CAS PubMed.
- K. Choi and A. D. Hamilton, J. Am. Chem. Soc., 2003, 125, 10241–10249 CrossRef CAS PubMed.
- I. A. Rathera, S. A. Wagaya, M. S. Hasnain and R. Ali, RSC Adv., 2019, 9, 38309–38344 RSC.
- P. A. Gale, P. Anzenbacher Jr and J. L. Sessler, Coord. Chem. Rev., 2001, 222, 57–102 CrossRef CAS.
- M. V. Ramakrishnam Raju, S. M. Harris and V. C. Pierre, Chem. Soc. Rev., 2020, 49, 1090–1108 RSC.
- J. W. Steed, Chem. Soc. Rev., 2009, 38, 506–519 RSC.
- D. J. Mercera and S. J. Loeb, Chem. Soc. Rev., 2010, 39, 3612–3620 RSC.
- S. J. Butler and D. Parker, Chem. Soc. Rev., 2013, 42, 1652–1666 RSC.
- B. Dietrich, M. W. Hosseini, J. M. Lehn and R. B. Sessions, J. Am. Chem. Soc., 1981, 103, 1282–1283 CrossRef CAS.
- C. Bazzicalupi, A. Bencini, A. Bianchi, M. Cecchi, B. Escuder, V. Fusi, E. Garcia-España, C. Giorgi, S. V. Luis, G. Maccagni, V. Marcelino, P. Paoletti and B. Valtancoli, J. Am. Chem. Soc., 1999, 121, 6807–6815 CrossRef CAS.
- S. O. Kang, J. M. Llinares and V. W. D. K. Bowman-James, Chem. Soc. Rev., 2010, 39, 3980–4003 RSC.
- E. García-España, P. Díaz, J. M. Llinares and A. Bianchi, Coord. Chem. Rev., 2006, 250, 2952–2986 CrossRef.
- S. P. Mahanta, B. S. Kumar, S. Baskaran, C. Sivasankar and P. K. Panda, Org. Lett., 2012, 14, 548–551 CrossRef CAS PubMed.
- R. G. Upendar, R. Lo, S. Roy, T. Banerjee, B. Ganguly and A. Das, Chem. Commun., 2013, 49, 9818–9820 RSC.
- L. Prodi, M. Montalti, N. Zaccheroni, F. Dallavalle, G. Folesani and M. Lanfranchi, Helv. Chim. Acta, 2001, 84, 690–706 CrossRef CAS.
- Y. Jin, C. Yu, R. J. Denmana and W. Zhang, Chem. Soc. Rev., 2013, 42, 6634–6654 RSC.
- Dynamic Covalent Chemistry: Principles, Reactions, and Applications, ed. W. Zhang and Y. Jin, John Wiley & Sons, 2017 Search PubMed.
- P. A. Gale, J. L. Sessler and V. Král, Chem. Commun., 1998, 1–8 RSC.
- R. Nishiyabu, M. A. Palacios, W. Dehaen and P. Anzenbacher Jr, J. Am. Chem. Soc., 2006, 128, 11496–11504 CrossRef CAS PubMed.
- I. Saha, J. T. Lee and C.-H. Lee, Eur. J. Org. Chem., 2015, 3859–3885 CrossRef CAS.
- P. Anzenbacher Jr, A. C. Try, H. Miyaji, K. Jursíková, V. M. Lynch, M. Marquez and J. L. Sessler, J. Am. Chem. Soc., 2000, 122, 10268–10272 CrossRef.
- A. S. Klymchenko, Acc. Chem. Res., 2017, 50, 366–375 CrossRef CAS PubMed.
- R. Miao, J. Li, C. Wang, X. Jiang, Y. Gao, X. Liu, D. Wang, X. Li, X. Liu and Y. Fang, Adv. Sci., 2022, 9, 2104609 CrossRef CAS PubMed.
- S. Mocanu, G. Ionita and I. Matei, Spectrochim. Acta, Part A, 2020, 237, 118413 CrossRef CAS PubMed.
- P. Anzenbacher Jr, P. Lubal, P. Buček, M. A. Palacios and M. E. Kozelkova, Chem. Soc. Rev., 2010, 39, 3954–3979 RSC.
- L. Mitchell, E. J. New and C. S. Mahon, ACS Appl. Polym. Mater., 2021, 3, 506–530 CrossRef CAS.
- B. Li, J. Wei, J. Kong, M. Qin, L. Yang and C. Li, Int. J. Mass Spectrom., 2021, 116513 CrossRef CAS.
- L. Hamel, Knowledge Discovery with Support Vector Machines, Wiley, Hoboken, NJ, 2009 Search PubMed.
- N. Cristianini and J. Shawe-Taylor, An Introduction to Support Vector Machines and Other Kernel-based Learning Methods, Cambridge University Press, Cambridge, 2000 Search PubMed.
- E. G. Shcherbakova, V. Brega, V. M. Lynch, T. D. James and P. Anzenbacher Jr, Chem.–Eur. J., 2017, 23, 10222–10229 CrossRef CAS PubMed.
Footnotes |
| † Electronic supplementary information (ESI) available: Synthetic and spectroscopic data, NMR, UV-vis, fluorescence spectroscopy binding studies, and ESI-MS as well as output data of qualitative and quantitative microchip array experiments. See DOI: https://doi.org/10.1039/d3sc01970e |
| ‡ Both authors contributed equally to this work. |
| This journal is © The Royal Society of Chemistry 2023 |

