 Open Access Article
Chemical sensors for imaging total cellular aliphatic aldehydes in live cells†
Rachel
Wills‡
 a,
Jonathan
Farhi‡
 b,
Patrick
Czabala
 a,
Sophia
Shahin
 a,
Jennifer
M. Spangle
 b and
Monika
Raj
 *a
*a
aDepartment of Chemistry, Emory University, Atlanta, GA, USA. E-mail: monika.raj@emory.edu
bDepartment of Radiation Oncology, Winship Cancer Institute of Emory University School of Medicine, Atlanta, GA, USA
First published on 19th July 2023
Abstract
Aliphatic aldehydes are reactive electrophilic carbonyls that cross-link with DNA and proteins leading to cellular toxicity and disease pathogenesis. This toxicity is due to the cooperative effect of multiple aldehydes via a common mechanism. Therefore, live-cell imaging of total aliphatic aldehydes, small-to-long chain (C1–C10), is highly desired to decipher their physiological and pathological functions. However, sensors for imaging total cellular aliphatic aldehydes are currently lacking despite their high concentrations (∼80 to >500 μM) inside cells. Herein, we report chemical sensors that generate a benzimidazole moiety upon reaction with aliphatic aldehydes of different chain lengths (C1–C10), resulting in turn-on fluorescence. These sensors exhibit high quantum yields, high dynamic range, and enable the quantification of changes in both the exogenous administration of aldehydes and endogenous real-time formation of aliphatic aldehydes in live mammalian cells. This tool has great potential to transform aldehyde research by illuminating cellular metabolites that have remained elusive in living systems.
Introduction
There is a broad presence of aliphatic aldehydes in the environment that humans are exposed to on daily basis.1 Additionally, cellular processes including the metabolism of amino acids, carbohydrates, lipids, steroids, and vitamins, and oxidative stress generate a variety of small-to-long (C1–C10) chain aliphatic aldehydes.2 The half-lives of these aldehydes range from minutes to hours and their free diffusion in cells contributes to cytotoxicity. This is due to their rapid reactivity with various biological nucleophiles including lipids, proteins, enzymes, and DNA.3 The physiological abundance of aliphatic aldehydes varies from ∼80 to >500 μM and can lead to effects on metabolic and cellular processes.4 Pathological levels of these aldehydes vary from low to high millimolar (∼100 mM) and have been increasingly appreciated in various diseases.4 For example, aldehydes can directly crosslink with DNA, causing DNA damage in the form of mutations (e.g., G-to-T transversion), reduction of DNA repair capacity, and chromosomal aberrations. The damage to DNA by aldehydes is cytotoxic and carcinogenic and is known to contribute to cardiovascular and neurological disorders such as Alzheimer's disease (AD).5 As a result of their cytotoxicity, the abundance of many aldehydes is tightly regulated by enzymes in the aldehyde dehydrogenase (ALDH) superfamily, which convert them into nontoxic acids.6 However, disease states or mutations in ALDH enzymes can lead to the accumulation of toxic aldehydes. For example, a missense mutation (E487K) in ALDH2, designated as the ALDH2*2 allele, leads to a significant decrease in the enzymatic ability to convert aldehydes into nontoxic acids and affects approximately >600 million people worldwide. The mutation that causes the defective ALDH2*2 enzyme is more common than other highly studied genetic missense mutations, including those that cause sickle cell anemia, cystic fibrosis, and glucose-6-phosphate dehydrogenase (G6PD) deficiency.7 For this reason, it is imperative to develop tools to accurately monitor aldehydes in a biological environment. However, a major challenge in deciphering the biological and pathological roles of aliphatic aldehydes is the real-time measurement of their concentrations, longevity, and subcellular localization in living cells.Cellular aldehydes are traditionally quantified using cell lysate by mass-coupled gas or liquid chromatography8 and colorimetric/fluorometric kits.9 These methods require the lysis of cellular membranes to release the aldehydes. Destruction of the membrane creates three issues: first, it decreases the aldehyde levels due to the volatile nature of short chain aliphatic aldehydes.10 Second, it increases the production of aldehydes due to the oxidative stress that occurs during cell death.2 Lastly, it results in the loss of spatio-temporal information. These limitations lead to the inaccurate analysis of cellular aldehyde levels, precluding the detection of cell-to-cell variability in aldehyde concentrations and the real time monitoring of aldehyde levels in live cells.
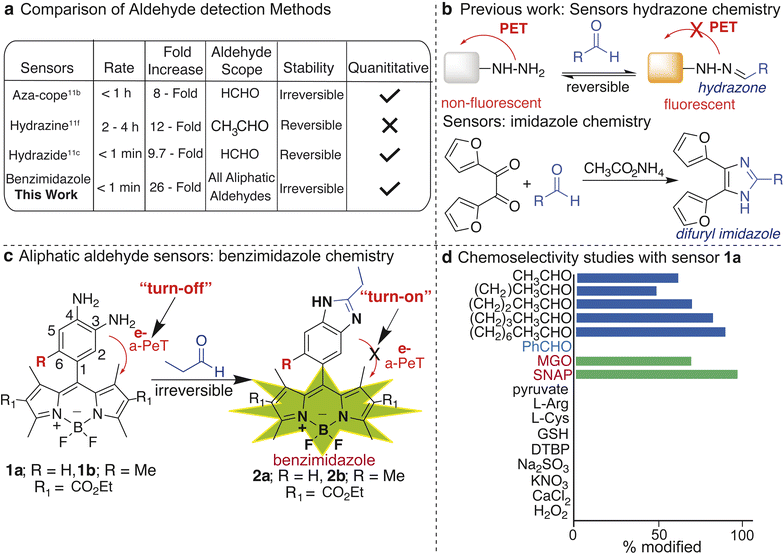
In contrast, fluorescent sensors using aza-cope rearrangement and Schiff base condensation of aldehydes with amines, hydrazines, or hydrazides represent a powerful, non-invasive tool for the real-time monitoring of endogenous aldehydes in live cells. However, these methods are limited to detecting only small-chain aliphatic aldehydes like formaldehyde (C1) and acetaldehyde (C2), or present inaccurate quantification based on their reversible nature (Fig. 1a).11 Humans are consistently exposed to a complex mixture of aldehydes from both exogenous sources and endogenous metabolic pathways. These different aldehydes interact additively by a common mechanism thus contributing to cellular toxicity in a synergistic manner.12 Therefore, imaging and determining total aliphatic aldehyde concentrations in cells would provide accurate monitoring of cellular toxicity. Currently, no irreversible fluorescent sensors are available for the real-time imaging, detection, and quantification of total aliphatic aldehydes, including medium-to-long-chain aliphatic aldehydes (C3–C10) in live cells.11 Previously, 3,4-phenyldiamine-BODIPY sensors have been reported to detect the concentrations of nitric oxide (NO) and methyl glyoxal (MGO) in live cells by the formation of benzotriazole and quinoxaline products, respectively.13,14 The detection of aliphatic aldehydes by these sensors was not determined at that time. We herein report that 3,4-phenyldiamine-BODIPY sensors react rapidly with aliphatic aldehydes (C1–C10), irrespective of their chain length, to form an irreversible benzimidazole moiety that results in turn-on fluorescence. We repurposed the membrane-permeable and photostable 3,4-phenyldiamine-BODIPY sensors to detect and monitor changes in small-to-long chain aliphatic aldehyde levels in live cells, without interference from other biological metabolites.
These 3,4-phenyldiamine-BODIPY sensors do not require catalysts and are non-cytotoxic, which is in contrast to the known hydrazine-based DarkZone11f and naphthalimide sensors.11e Our sensors display high sensitivity (26-fold increase in fluorescence), fast reaction kinetics (k = 0.0103 s−1), and a high dynamic range (2 μM to 100 mM) allowing for the quantification and real-time monitoring of changes in the endogenous concentrations of aliphatic aldehydes in live cells in the presence of both ALDH activators and inhibitors, which is unachievable with other known irreversible sensors. We also added aldehyde sponges inside live cells to demonstrate the selectivity of our sensors for detecting aldehydes.
Results and discussion
Design and development of chemical sensors for aliphatic aldehydes
Existing methods for detecting small-to-long chain aliphatic aldehydes usually involve reactions with phenylhydrazine derivatives15 to generate phenylhydrazone, which are detected by HPLC and fluorimetry (Fig. 1b). These hydrazone sensors for detecting aldehydes in live cells are limited due to the slow rate of reaction and reversibility under physiological conditions.11f,11g,11j,11k,15 Another reaction used for aldehyde detection by HPLC involves the use of 2,2′-furil and ammonium acetate which leads to the formation of a stable difuryl imidazole (Fig. 1b).16We sought a method that would leverage the formation of stable imidazole products from aliphatic aldehydes to develop turn-on sensors in live cells. We chose BODIPY as the fluorophore in our sensor because of its neutral charge, lipophilicity-enhanced cell permeability, and favorable partitioning into biological membranes. These attributes make BODIPY a robust reporter for detecting biological metabolites inside live cells.17 We planned to use one such sensor containing 3,4-phenyldiamine attached to the BODIPY core, 3,4-phenyldiamine-BODIPY ethylester 1a (Fig. 1c). In these sensors, fluorescence is quenched via an intramolecular photoinduced electron transfer (PeT) from the phenyldiamine moiety to the BODIPY acceptor fluorophore in a process known as acceptor-excited photoinduced electron transfer (a-PeT).13 These processes are prevented upon reaction with aldehydes, resulting in turn-on fluorescence. Previous studies have shown that the substitution of a methyl group (R) at the 6th position on the phenyl ring raises the LUMO energy without forcing a simultaneous increase in EHOMO,14 exhibiting high fluorescence efficiency (Fig. 1c). Therefore, we synthesized both 3,4-phenyldiamine-BODIPY ethylester 1a and 6-methyl substituted 3,4-phenyldiamine-BODIPY ethylester 1b for detecting the aliphatic aldehydes in live cells (for detailed synthesis and products characterization by 1H NMR, 13C NMR, and HRMS see ESI Fig. 1, 2, 5, 14 and 15†).13,14
Quantum yield
Next, we carried out the reaction of sensor 1a with propanal under physiological conditions and generated the stable benzimidazole-BODIPY 2a as characterized by 1H NMR, 13C NMR, and HRMS (ESI Fig. 5, 14, and 15†). The product 2a resulted in turn-on fluorescence with an emission wavelength of 507 nm. This resulted from the formation of benzimidazole, which lowers the HOMO energy and increases the LUMO energy of the product, thereby avoiding both a-PeT and donor-excited photoinduced electron transfer (d-PeT) processes. We next calculated and compared the quantum yield of both sensors 1a (0.005) and 1b (0.04) with their corresponding products upon reaction with propanal 2a (0.13) and 2b (0.33) (ESI Fig. 3 and 4†).This study showed a 26-fold increase in the fluorescence of 2a compared to 1a and an 8.5-fold increase in the fluorescence of 2b compared to 1b, making sensor 1a the more sensitive aliphatic aldehyde detector. This is a significant enhancement over the previous acetaldehyde DarkZone sensor, resulting in only a 12-fold increase in fluorescence.11f
Chemoselectivity studies with other biological metabolites
We explored the reactivity and selectivity of sensor 1a with varying biological metabolites, such as glutathione (GSH), pyruvate, L-Arg, L-Cys, DL-Hcy, CaCl2, KNO3, Na2SO3, NaNO3, H2O2, di-tert butyl peroxide (DTBP), and nitric oxide (NO) (Fig. 1d). We also tested the reactivity with varying aliphatic and aromatic aldehydes (formaldehyde, acetaldehyde, propanal, butanal, pentanal, octanal, decanal, benzaldehyde, and 4-nitrobenzaldehyde) and the dicarbonyl methylglyoxal (MGO) in DMSO. Following incubation of various biological metabolites at very high concentrations (50 mM) with sensor 1a (1 mM) for 2 h, only aliphatic aldehydes (C1–C10), NO, and MGO led to modified products (Fig. 1d). We did not observe the formation of any products with other biological metabolites, including aromatic aldehydes.Notably, regardless of the chain lengths, all the aliphatic aldehydes reacted with sensor 1a and generated the corresponding benzimidazole products with a significant fluorescence increase versus the baseline (ESI Fig. 5†). The various aldehydes triggered the same turn-on response with negligible differences in fluorescence intensity, which would allow for total aliphatic aldehyde detection. This discovery led us to reach our goal of detecting total aliphatic aldehyde concentrations in live cells. The formation of benzimidazole products by the reactions between diamine sensor 1a and aldehydes (propanal (C3) or decanal (C10)) was confirmed by 1H NMR, 13C NMR, and HRMS (ESI Fig. 5, 14, and 15†). We did not add any oxidant to the reaction mixture and still observed the formation of the benzimidazole product. This is most likely due to aromatization leading to the formation of the thermodynamically favorable benzimidazole product over the unoxidized product.
Rate of aliphatic aldehyde detection by sensor 1ain situ and in live cells
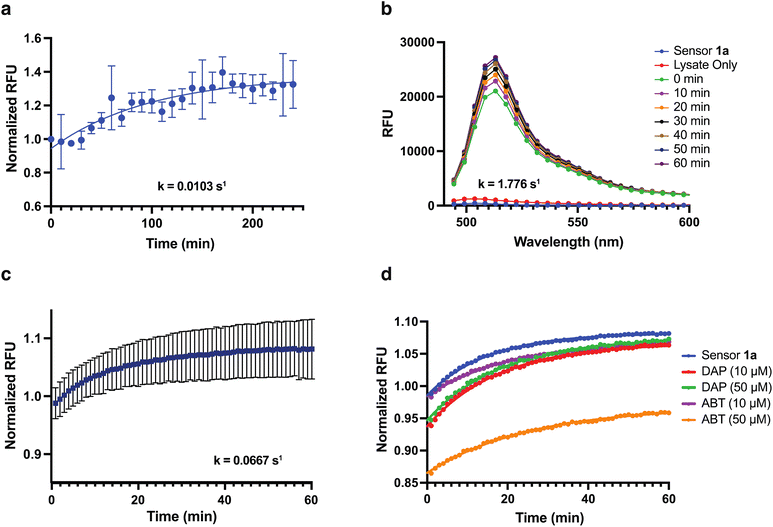
We next evaluated the sensitivity and kinetic properties of sensor 1a when reacted with aldehydes. The pseudo-first-order rate constant for detecting propanal by sensor 1a was obtained by recording the change in the fluorescence over time upon incubating 10 μM sensor 1a with 1 μM propanal and was calculated to be 0.0103 s−1 (Fig. 2a). This reaction rate is significantly rapid as compared to previous hydrazone (k = 0.0065 s−1)11d and DarkZone (time = 2–4 h)11f aldehyde sensors, granting sensor 1a the potential to capture dynamics of aldehyde trafficking with unprecedented temporal resolution (Fig. 2a). Encouraged by this, we desired to determine the sensitivity of sensor 1a in a complex cell lysate mixture. We incubated 10 μM sensor 1a with 50 μg of cell lysate extracted from the human breast ductal carcinoma cell line T47D and recorded the change in the fluorescence over time from endogenous aldehydes (Fig. 2b). To determine the sensitivity of sensor 1a in detecting endogenous aliphatic aldehydes in live cells, we incubated sensor 1a (5 μM) in live T47D cells and monitored the change in fluorescence over time (Fig. 2c). To detect the endogenous aldehyde dynamics in live cells, we incubated T47D cells with sensor 1a (5 μM) and monitored changes in fluorescence over time in the presence of molecules that decrease cellular aldehyde levels (Fig. 2d). Notably, we observed the decrease in concentrations of endogenous aldehydes in the presence of aldehyde sponges (10–50 μM) (aldehyde reactive molecules) such as 2,3-diaminophenol (DAP) and 2-amino-4-chlorobenzenethiol (ABT) (Fig. 2d). ABT and DAP react with aldehydes and generate thiazolidine and benzimidazole, respectively, thus trapping aldehydes. As expected, in the presence of reactive aldehyde sponge at higher concentrations (ABT, 50 μM), a significant decrease in the fluorescence intensity was observed as compared to the less reactive aldehyde sponge at lower concentrations (DAP, 10 μM, Fig. 2d). Additionally, the reactivity of ABT is selective to aldehydes over nitric oxide. The decreased fluorescence signal in the presence of ABT confirmed that our probe is detecting aliphatic aldehydes over nitric oxide.No additional cell death was observed as compared to the control for T47D cells treated with aldehyde sponges at varying concentrations (DAP and ABT, 10–50 μM, ESI Fig. 6†). These studies demonstrated the high sensitivity of sensor 1a in monitoring changes in endogenous aldehyde levels in live cells.
Live-cell imaging of endogenous aliphatic aldehydes by sensor 1a
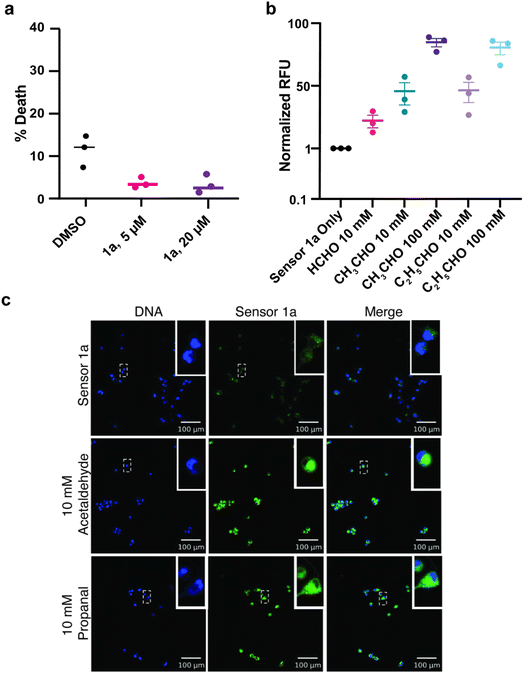
We examined the capacity of sensor 1a to work inside live cells by first incubating T47D cells with varying concentrations of sensor 1a (5–20 μM) for 24 h to determine the effect on cell death. We were pleased to observe no increase in cell death compared to the DMSO control in the range from 5 to 20 μM, as determined by flow cytometry (Fig. 3a, ESI Fig. 7†). This presents a significant improvement over previous aldehyde sensors that result in 20–30% cell death11f (Fig. 3a). Next, we incubated T47D cells with exogenous aldehydes, propanal, and acetaldehyde, at different concentrations (10 and 100 mM) and did not observe additional cell death in comparison to the DMSO control (ESI Fig. 8†).To determine the ability of sensors to detect exogenously added aldehydes in live cells, we incubated cells with the sensor 1a (5 μM) followed by treatment with acetaldehyde and propanal at the pathologically relevant range (10 mM and 100 mM) for an additional 1 h. An increase in the relative fluorescence for 10 mM aldehydes (45%) and for 100 mM aldehydes (95%) was readily detected in cells throughout the experiments using flow cytometry (Fig. 3b, ESI Fig. 9†). Next, we imaged the increase in the fluorescence in T47D cells with sensor 1a (10 μM) in the presence of exogenous aldehydes, propanal and acetaldehyde (10 mM), using confocal microscopy (Fig. 3c). To determine the ability of the sensor to detect aldehydes in varying cell lines, we performed a similar experiment using live human prostate adenocarcinoma cells, LNCaP, and observed a similar increase in the fluorescence after the incubation of sensor 1a (ESI Fig. 10†).
Limit of detection: quantification of changes in aldehyde levels inside live cells
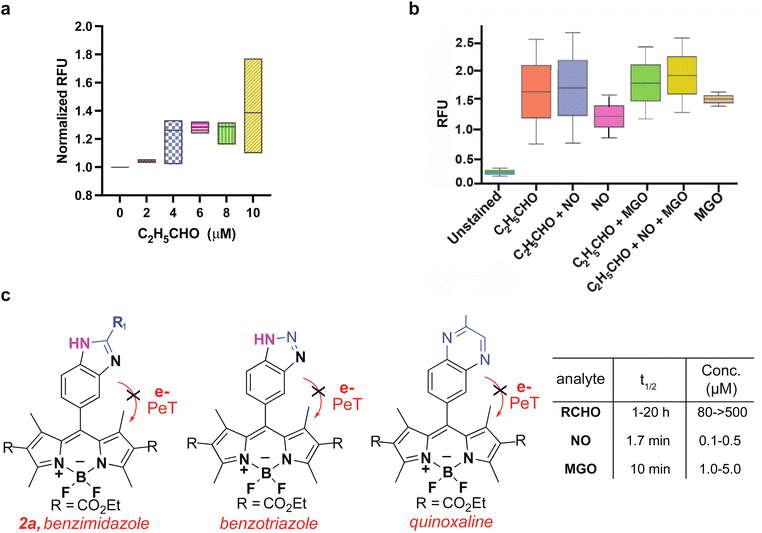
Since we do not know the accurate concentrations of endogenous aldehydes inside cells, we used exogenous aldehydes to determine the accurate limit of detection for sensor 1a. We quantified levels of propanal inside LNCaP cells with confocal microscopy. Sensor 1a (10 μM) treated cells were incubated with increasing concentrations of propanal (0 μM, 2 μM, 4 μM, 6 μM, 8 μM, and 10 μM) for 1 h, followed by the measurement of fluorescence (Fig. 4a and ESI Fig. 11†). Relative fluorescence was calculated by analyzing pixel intensity to determine the fluorescence intensity of individual cells. We found that sensor 1a exhibited a high dynamic range (2–10 μM) for detecting aliphatic aldehydes inside live cells. The previous DarkZone sensor showed no fluorescence inside cells even at 50 μM acetaldehyde concentration.11f Thus, sensor 1a displays a significant increase in sensitivity and an impressive improvement in the limit of detection as compared to known aldehyde sensors.Comparison of aldehyde detection with MGO and NO using sensor 1a
Since sensor 1a is known to react with NO and MGO to create benzotriazole and quinoxaline fluorescence products, respectively13,14 (Fig. 1d), we tested for the cross-reactivity of sensor 1a with NO and MGO in live cells. We incubated LNCaP cells with sensor 1a, followed by treatment with an NO donor (SNAP) or MGO at physiological concentrations for 1 h (Fig. 4b and ESI Fig. 12†). Cells exhibited only a minimal increase in fluorescence due to the formation of a benzotriazole product with NO (Fig. 4b). The lower physiological concentrations of NO (800 to 1000-fold lower) and much shorter half-life (∼1.7 min)13 as compared to total aliphatic aldehydes (∼1–20 h)18 precluded interference in the aliphatic aldehyde detection in live cells (Fig. 4b and c). Likewise, cells exhibited only a minimal increase in fluorescence due to the formation of a quinoxaline product with MGO (Fig. 4b and c). The estimated physiological concentration of MGO17 is 80 to 100-fold lower than for total aliphatic aldehydes,4 with a much shorter half-life (∼10 min) (Fig. 4c).1a The shorter half-life of MGO is due to the high abundance and kinetic constant of the glyoxalase I enzyme (Glo1) responsible for the metabolism of MGO to non-toxic D-lactate in comparison to ALDH for aliphatic aldehydes.1a Taken together, these observations demonstrate that the physiological concentrations of MGO and NO do not interfere with the detection of aliphatic aldehydes by sensor 1a in cellular settings (Fig. 4b). It is likely that the primary species (NO or MGO or total cellular aliphatic aldehydes) being detected is ultimately dependent on the system being studied and their relative concentrations, therefore appropriate controls (e.g. the addition of sponges or selective inhibitors for the relevant enzymes as shown in Fig. 2d, 5 and 6) are always needed to draw proper conclusions from the applications of these types of sensors.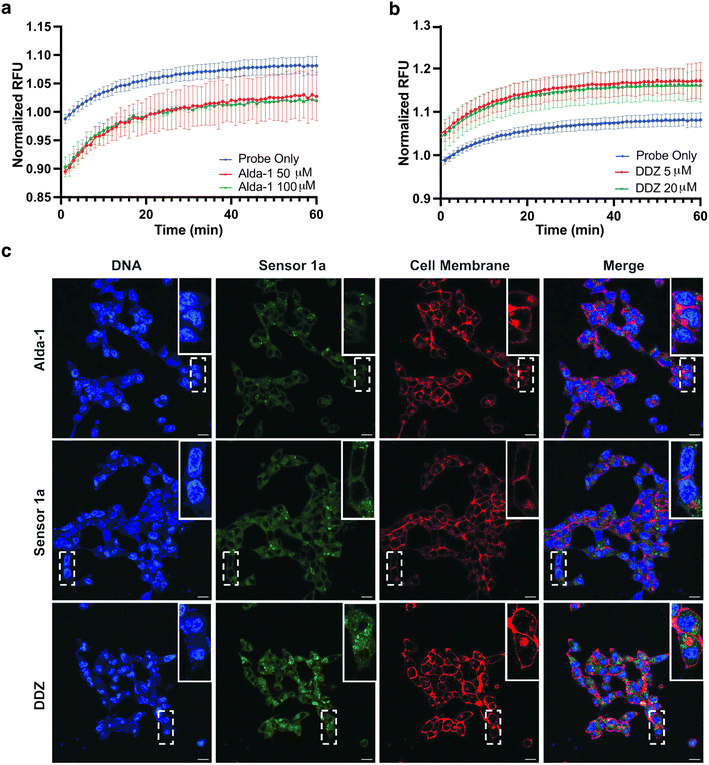 | ||
| Fig. 6 Live cell imaging of endogenous aliphatic aldehyde levels by sensor 1a in the presence of ALDH2 activator and inhibitor. (a) A decrease in fluorescence was observed in T47D cells incubated with 1a due to the decrease in the concentrations of aldehydes in the presence of ALDH2 activator, Alda-1, over 1 h. (b) An increase in fluorescence was observed in T47D cells incubated with 1a due to the increase in the concentrations of aldehydes in the presence of ALDH2 inhibitor, DDZ, over 1 h. (c) Confocal imaging of LNCaP cells cotreated with sensor 1a, Alda-1, or DDZ. These experiments were done in triplicate. (a and b) Twelve trials were performed for these experiments, Alda-1 and DDZ were used at different concentrations due to their different affinities in activating or inhibiting ALDH2. Cell membrane visualization was performed with Cell Mask dye. The fluorescence was quantified and reported in the ESI.† RFU = relative fluorescence unit. Normalized RFU indicates RFU normalized to sensor 1a. Time zero denotes unreacted probe as a control. Scale = 20 μM. | ||
Detection of acetaldehyde levels in preclinically relevant cancer models
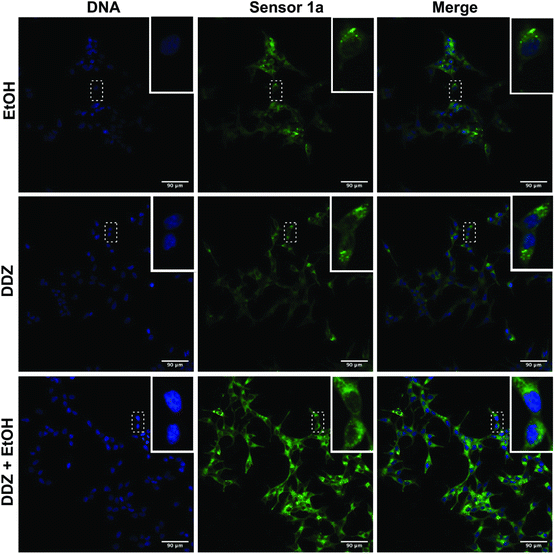
Changes in cellular aldehyde levels occur in multiple diseases and often play a functional role in disease progression. ALDH2*2 mutation, affecting approximately >600 million people, is responsible for the accumulation of acetaldehyde after alcohol consumption, leading to disease states such as cancer, chronic liver damage, and Fanconi anemia (FA).6,7 To test the ability of sensor 1a to detect the endogenous production of aldehydes during the metabolic processes inside live cells, we incubated LNCaP cells with sensor 1a (5 μM) followed by treatment with (i) ethanol, the metabolic precursor of acetaldehyde (10 mM), (ii) daidzin (DDZ), an ALDH2 inhibitor (5 μM), and (iii) both ethanol (10 mM) and DDZ (5 μM). Cells were imaged after 1 h to determine fluorescence intensity (Fig. 5). We found that LNCaP cells treated with ethanol showed a higher fluorescence signal as compared to the sensor 1a treated control because of its metabolism to acetaldehyde. Notably, we also observed an increase in the cellular fluorescence following DDZ treatment because DDZ inhibits ALDH2, (mimicking ALDH2*2 mutation) thus increasing the accumulation of aldehydes from metabolic processes. In contrast, the previous DarkZone sensor for acetaldehyde did not show any change in fluorescence after the addition of excess DDZ (250 μM) or ethanol (2 mM).11f This is due to the slow reaction kinetics of the DarkZone sensor as compared to the metabolism of acetaldehyde. This study revealed that sensor 1a has high sensitivity and fast kinetics suitable for detecting the endogenous production of acetaldehyde in live cells. In line with these results, we observed a significant increase in the fluorescence upon the addition of both ethanol and DDZ due to an increase in the production and the accumulation of acetaldehyde (Fig. 5). The fluorescent signals were cytosolic with no observed modification of the nucleus (Fig. 5).Live-cell imaging and monitoring of medium-aliphatic aldehyde levels in the presence of both activator and inhibitor of ALDH2
In addition to acetaldehyde metabolism, ALDH2 plays an important role in mitigating oxidative stress by metabolizing other medium-to-long chain aliphatic aldehydes, including propanal.19 Several studies have demonstrated that both ALDH2 upregulation and downregulation play a critical role in human cancers.20 T47D cells cotreated with sensor 1a (5 μM) and an activator (Alda-1) or an inhibitor (DDZ) of ALDH2 were used to test the ability of sensor 1a to detect such changes in concentrations of aldehydes in live cells, mimicking disease states. As expected, T47D cells treated with Alda-1 (50 μM and 100 μM) showed a decrease in the fluorescence signal as compared to sensor 1a alone, owing to increased metabolism of endogenous aldehydes (Fig. 6a). We found that T47D cells treated with sensor 1a in the presence of DDZ (5 μM and 20 μM) showed a higher fluorescence signal as compared to sensor 1a due to the accumulation of aldehydes resulting from the inhibition of ALDH2 activity (Fig. 6b). Additionally, LNCaP cells treated with sensor 1a and either Alda-1 or DDZ were imaged by confocal microscopy and showed a similar decrease (Fig. 6c, top) or increase (Fig. 6c, bottom) in fluorescence compared to sensor 1a alone (Fig. 6c, middle) as quantified by analyzing the pixel intensity of the microscopy images (ESI Fig. 13†). We used LnCap cells for imaging because of their favorable morphology and better visualization of the aldehydes inside cells.We also observed an immediate turn-on of the fluorescence inside live LnCaP cells upon addition of sensor 1a as observed by live cell imaging over time (1–60 min, see the movie in the ESI†). This experimentation allowed the monitoring of sensor 1a reactivity with available endogenous aldehydes inside the cell. The fast enzymatic activity of ALDH2 creates a small amount of endogenous aldehyde available for reactivity with sensor 1a. These studies demonstrate the rapid cellular uptake of sensor 1a and its fast reaction kinetics with aldehydes inside live cells.
These studies showed that sensor 1a is non-toxic, exhibits high sensitivity and fast kinetics in detecting endogenous levels of aliphatic aldehydes in live cells, and is responsive to ALDH2 activity. This study further suggests the ability of sensor 1a to monitor metabolic pathways that result in aldehyde production and diagnose disease states associated with changes in total aliphatic aldehyde levels.
Conclusions
In summary, we have shown that 3,4-phenyldiamine-BODIPY probe 1a acts as a fluorescent sensor for selective and sensitive detection of small-to-long chain (C1–C10) total aliphatic aldehydes in live cells in the presence of other reactive biological metabolites. The condensation of probe 1a with aliphatic aldehydes generates a benzimidazole moiety that lowers the HOMO energy and increases the LUMO energy, quenching both a-PeT and d-PeT processes and resulting in turn-on fluorescence at an emission wavelength of 507 nm. In contrast, the unreacted sensor showed almost no fluorescence because o-phenyldiamine acts as an electron donor in photo-electron transfer (PeT) quenching of BODIPY fluorescence. Sensor 1a exhibits fast reaction kinetics (k = 0.0667 s−1) for detecting endogenous levels of aliphatic aldehydes in live cells with high sensitivity (26-fold increase in fluorescence) and high dynamic range (2 μM to 100 mM), thus enabling the detection of both physiological and pathological concentrations of aliphatic aldehydes in live cells without interference from competing biological analytes. The data presented herein showcase the broad applicability of sensor 1a to image and measure changes in aliphatic aldehyde levels in a variety of common cell lines. Our sensors are non-cytotoxic, do not require any catalysts for completing the reaction, and generate an irreversible stable adduct with aliphatic aldehydes, which is in contrast to the known hydrazine-based DarkZone11f and naphthalimide sensors.11e We further demonstrated the ability of sensor 1a to identify changes in the endogenous levels of aliphatic aldehydes in live mammalian cells by treating the cells with an activator (Alda-1) and inhibitor (DDZ) of ALDH2 enzyme, responsible for the metabolism of aldehydes, which is unachievable with other known sensors. We also showed a significant reduction in the fluorescence by the addition of aldehyde sponges that lead to the capture of free aldehydes. This study justifies the potential of sensor 1a for quantifying, detecting, and monitoring changes in total aliphatic aldehyde concentrations over time in live cells, opening the opportunity to minutely dissect their roles and biological consequences in cellular metabolism and disease pathogenesis with impressive precision. Current efforts are underway to utilize this fluorescent sensor in monitoring various pathological states related to changes in total aliphatic aldehyde levels.Data availability
The data supporting this article have been uploaded as part of the ESI.†Author contributions
R. W. and M. R. designed the project. R. W. performed all the synthetic experiments and characterized the compounds by NMR and LCMS. P. C. and S. S. analyzed chemoselective reactions with sensor 1a. J. F., J. S., and R. W. designed and performed all the live-cell experiments. J. S. helped in analyzing the live-cell data. All authors analyzed the results. R. W., P. C., and M. R. wrote the manuscript.Conflicts of interest
There are no conflicts to declare.Acknowledgements
This research was supported by a grant (Grant No. 1R35GM133719-01) from the National Institute of Health (NIH) and Alfred P. Sloan Foundation Award to M. R. Research reported in this publication was supported in part by the Emory University Integrated Cellular Imaging Core of the Winship Cancer Institute of Emory University and NIH/NCI under award number 2P30CA138292-04.Notes and references
- (a) R. P. Dator, M. J. Solivio, P. W. Villalta and S. Balbo, Toxics, 2019, 7, 32 CrossRef CAS PubMed; (b) P. J. O'Brien, A. G. Siraki and N. Shangari, Crit. Rev. Toxicol., 2015, 35, 609 CrossRef; (c) S. K. Brown, Indoor Air, 1999, 9, 209 CrossRef CAS PubMed; (d) J. Hahn, Y. B. Monakhova, J. Hengen, M. Kohl-Himmelseher, J. Schüssler, H. Hahn, T. Kuballa and D. W. Lachenmeier, Tob. Induced Dis., 2014, 12, 23 CrossRef PubMed; (e) V. M. Osorio and Z. L. Cardeal, J. Braz. Chem. Soc., 2013, 24, 1711 Search PubMed.
- (a) T. Finkel and N. J. Holbrook, Nature, 2000, 408, 239 CrossRef CAS PubMed; (b) M. T. Lin and M. F. Beal, Nature, 2006, 443, 787 CrossRef CAS PubMed.
- (a) A. Yokoyama, E. Tsutsumi, H. Imazeki, Y. Suwa, C. Nakamura, T. Mizukami and T. Yokoyama, Alcohol: Clin. Exp. Res., 2008, 32, 1607 CrossRef CAS; (b) Y. Li, A. Steppi, Y. Zhou, F. Mao, P. C. Miller, M. M. He, T. Zhao, Q. Sun and J. Zhang, Sci. Rep., 2017, 7, 4747 CrossRef PubMed.
- S. A. Marchitti, C. Brocker, D. Stagos and V. Vasiliou, Expert Opin. Drug Metab. Toxicol., 2008, 4, 697 CrossRef CAS PubMed.
- (a) M. W. Weng, H. W. Lee, S. H. Park, Y. Hu, H. T. Wang, L. C. Chen, W. N. Rom, W. C. Huang, H. Lepor, X. R. Wu, C. S. Yang and M. S. Tang, Proc. Natl. Acad. Sci. U. S. A., 2018, 115, E6152 CAS; (b) J. I. Garaycoechea, G. P. Crossan, F. Langevin, L. Mulderrig, S. Louzada, F. Yang, G. Guilbaud, N. Park, S. Roerink, S. Nik-Zainal, M. R. Stratton and K. J. Patel, Nature, 2018, 553, 171 CrossRef CAS PubMed; (c) S. C. Trewick, T. F. Henshaw, R. P. Hausinger, T. Lindahl and B. Sedgwick, Nature, 2002, 419, 174 CrossRef CAS PubMed.
- A. Yoshida, I. Y. Huang and M. Ikawa, Proc. Natl. Acad. Sci. U. S. A., 1984, 81, 258 CrossRef CAS PubMed.
- (a) Y. C. Chao, S. R. Liou, S. F. Tsai and S. J. Yin, Proc. Natl. Sci. Counc., Repub. China, Part B: Basic Sci., 1993, 17, 98 CAS; (b) H. W. Goedde, D. P. Agarwal, G. Fritze, D. Meier-Tackmann, S. Singh, G. Beckmann, K. Bhatia, L. Z. Chen, B. Fang and R. Lisker, Hum. Genet., 1992, 88, 344 CrossRef CAS PubMed; (c) S. E. Luczak, B. Elvine-Kreis, S. H. Shea, L. G. Carr and T. L. Wall, J. Stud. Alcohol, 2002, 63, 74 CrossRef PubMed.
- (a) C. Zwiener, T. Glauner and F. Frimmel, Anal. Bioanal. Chem., 2002, 372, 615 CrossRef CAS PubMed; (b) Y. Chi, Y. Feng, S. Wen, H. Lu, Z. Yu, W. Zhang, G. Sheng and J. Fu, Talanta, 2007, 72, 539 CrossRef CAS PubMed; (c) S. M. Ochs, M. Fasciotti and A. D. P. Netto, J. Spectrosc., 2015, 2015, 1 CrossRef; (d) C. E. Baños and M. Silva, J. Chromatogr. B: Anal. Technol. Biomed. Life Sci., 2010, 878, 653 CrossRef PubMed.
- (a) K. Yagi, Biochem. Med., 1976, 15, 212 CrossRef CAS PubMed; (b) D. Del Rio, N. Pellegrini, B. Colombi, M. Bianchi, M. Serafini, F. Torta, M. Tegoni, M. Musci and F. Brighenti, Clin. Chem., 2003, 49, 690 CrossRef CAS PubMed; (c) A. N. Ramdzan, M. I. G. S. Almeida, M. J. McCullough and S. D. Kolev, Anal. Chim. Acta, 2016, 919, 47 CrossRef CAS PubMed; (d) J. Zhang, H. Zhang, M. Li, D. Zhang, Q. Chu and J. Ye, J. Chromatogr. A, 2010, 1217, 5124 CrossRef CAS PubMed.
- (a) S. Wang, H. M. Ang and M. O. Tade, Environ. Int., 2007, 33, 694 CrossRef CAS; (b) Y. Cho, M. K. Song, T. S. Kim and J. C. Ryu, Sci. Rep., 2018, 8, 10497 CrossRef.
- (a) T. F. Brewer, G. Burgos-Barragan, N. Wit, K. J. Patel and C. J. Chang, Chem. Sci., 2017, 8, 4073 RSC; (b) T. F. Brewer and C. J. Chang, J. Am. Chem. Soc., 2015, 137, 10886 CrossRef CAS PubMed; (c) X. G. Liang, B. Chen, L. X. Shao, J. Cheng, M. Z. Huang, Y. Chen, Y. Z. Hu, Y. F. Han, F. Han and X. Li, Theranostics, 2017, 7, 2305 CrossRef CAS PubMed; (d) Y. Tang, X. Kong, A. Xu, B. Dong and W. Lin, Angew. Chem., Int. Ed., 2016, 55, 3356 ( Angew. Chem. , 2016 , 128 , 3417 ) CrossRef CAS; (e) P. Jin, C. Jiao, Z. Guo, Y. He, S. Zhu, H. Tian and W. Zhu, Chem. Sci., 2014, 5, 4012 RSC; (f) L. H. Yuen, N. S. Saxena, H. S. Park, K. Weinberg and E. T. Kool, ACS Chem. Biol., 2016, 11, 2312 CrossRef CAS PubMed; (g) D. Larsen, A. M. Kietrys, S. A. Clark, H. S. Park, A. Ekebergh and E. T. Kool, Chem. Sci., 2018, 9, 5252 RSC; (h) L. He, X. Yang, M. Ren, X. Kong, Y. Liu and W. Lin, Chem. Commun., 2016, 52, 9582 RSC; (i) C. Liu, X. Jiao, S. He, L. Zhao and X. Zeng, Dyes Pigm., 2017, 138, 23 CrossRef CAS; (j) M. Suchý, C. Lazurko, A. Kirby, T. Dang, G. Liu and A. J. Shuhendler, Org. Biomol. Chem., 2019, 17, 1843 RSC; (k) C. Lazurko, I. Radonjic, M. Suchý, G. Liu, A. Rolland-Lagan and A. J. Shuhendler, ChemBioChem, 2019, 20, 543 CrossRef CAS PubMed.
- R. M. LoPachin and T. Gavin, Chem. Res. Toxicol., 2014, 27, 1081 Search PubMed.
- (a) Y. Gabe, Y. Urano, K. Kikuchi, H. Kojima and T. Nagano, J. Am. Chem. Soc., 2004, 126, 3357 CrossRef CAS; (b) H. X. Zhang, J. B. Chen, X. F. Guo, H. Wang and H. S. Zhang, Anal. Chem., 2014, 86, 3115 CrossRef CAS PubMed.
- T. Wang, E. F. Douglass, K. J. Fitzgerald and D. A. Spiegel, J. Am. Chem. Soc., 2013, 135, 12429 CrossRef CAS PubMed.
- X. J. Xiong, H. Wang, W. B. Rao, X. F. Guo and H. S. Zhang, J. Chromatogr. A, 2010, 1217, 49 CrossRef CAS.
- M. F. B. Ali, N. Kishikawa, K. Ohyama, H. A. M. Mohamed, H. M. Abdel-Wadood, A. M. Mohamed and N. Kuroda, J. Chromatogr. A, 2013, 1300, 199 CrossRef CAS PubMed.
- (a) G. Ulrich, R. Ziessel and A. Harriman, Angew. Chem., Int. Ed., 2008, 47, 1184 CrossRef CAS PubMed; (b) N. Boens, B. Verbelen and W. Dehaen, Eur. J. Org. Chem., 2015, 2015, 6577 CrossRef CAS; (c) T. Kowada, H. Maeda and K. Kikuchi, Chem. Soc. Rev., 2015, 44, 4953 RSC.
- (a) L. K. Silva, G. A. Hile, K. M. Capella, M. F. Espenship, M. M. Smith, V. R. De Jesuś and B. C. Blount, Environ. Sci. Technol., 2018, 52, 10571 CrossRef CAS PubMed; (b) J. L. Dorne, C. Bechaux, G. Kass and M. Innocenti, EFSA J., 2014, 12, 3550 Search PubMed.
- C. E. Graham, K. Brocklehurst, R. W. Pickersgill and M. J. Warren, Biochem. J., 2006, 394, 67 CrossRef CAS PubMed.
- (a) B. N. Rexer, W. L. Zheng and D. E. Ong, Cancer Res., 2001, 61, 7065 CAS; (b) J. G. Koch, X. Gu, Y. Han, A. K. El-Naggar, M. V. Olson, D. Medina, D. J. Jerry, A. C. Blackburn, G. Peltz, C. I. Amos and G. Lozano, Mamm. Genome, 2007, 18, 300 CrossRef CAS.
Footnotes |
| † Electronic supplementary information (ESI) available. See DOI: https://doi.org/10.1039/d3sc02025h |
| ‡ R. W. and J. F. contributed equally to this project. |
| This journal is © The Royal Society of Chemistry 2023 |

