 Open Access Article
Creative Commons Attribution 3.0 Unported Licence
Reaction dynamics as the missing puzzle piece: the origin of selectivity in oxazaborolidinium ion-catalysed reactions†
Ching Ching
Lam
 and
Jonathan M.
Goodman
 *
*
Yusuf Hamied Department of Chemistry, University of Cambridge, Lensfield Road, Cambridge, CB2 1EW, UK. E-mail: jmg11@cam.ac.uk
First published on 20th October 2023
Abstract
The selectivity in a group of oxazaborolidinium ion-catalysed reactions between aldehyde and diazo compounds cannot be explained using transition state theory. VRAI-selectivity, developed to predict the outcome of dynamically controlled reactions, can account for both the chemo- and the stereo-selectivity in these reactions, which are controlled by reaction dynamics. Subtle modifications to the substrate or catalyst substituents alter the potential energy surface, leading to changes in predominant reaction pathways and altering the barriers to the major product when reaction dynamics are considered. In addition, this study suggests an explanation for the mysterious inversion of enantioselectivity resulting from the inclusion of an orthoiPrO group in the catalyst.
1 Introduction
Computing organic stereoselectivity is now a standard part of synthetic and mechanistic chemistry.1 In general, either the pathway with the lowest energy transition state leads to the preferred product, or else the thermodynamically favourable product is formed. However, there are also reactions where the product selectivity is strongly influenced by reaction dynamics. In these cases, calculation of TS energies by itself is not enough to understand the outcome.2–8 Such reactions tend to have bifurcating reaction surfaces2 or involve processes with a shallow intermediate that connects two transition states (TS), where the first TS is much higher in energy than the second one (Fig. 1).7,8 The role of reaction dynamics has been largely overlooked, with computational organic chemists usually focusing on other factors, such as kinetics, through utilizing the Transition State Theory (TST). One possible reason might be the high computational cost. Traditionally, expensive molecular dynamics (MD) simulations need to be run to produce a large number of reaction trajectories to confirm the effect of reaction dynamics.9 Recently, we developed an algorithm, VRAI-selectivity, to analyse and predict selectivity outcomes of dynamically controlled reactions straightforwardly without expensive computations.10,11 We developed and tested VRAI-selectivity on about 60 reactions from 25 papers published from 2003 to 2019. Examples include the work on bi- and tri-pericyclic reactions from Houk et al.,12,13 the study of bifurcating Rh-carbenoid C–H insertions reactions from Tantillo et al.14 and the publication on dynamic effects in alkene hydroboration from Singleton et al.7 We surveyed the size of these chemical systems. The number of atoms involved in the reactions ranges from 10 to 50, with a median of 25 (ESI Fig. 7.1†). Recent research has also revealed a growing number of complex organic reactions, in which a significant amount of diligent efforts and computational resources have been deliciated to verify the effect of reaction dynamics. Houk et al. have just reported the discovery of tetra-pericyclic cycloadditions.15 Ess et al. have detailed the dynamic effects in organometallic reactions in their published works.16 The research in terpene forming reactions, which are known to be dynamically controlled, is ongoing in the community.17–19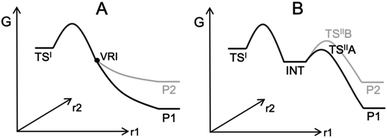 | ||
| Fig. 1 Examples of processes with dynamically controlled selectivity: (A) a bifurcating reaction with a valley-ridge inflection point (VRI) on the potential energy surface2 and (B) a reaction with a shadow intermediate where the sequential TSs are low in energy compared to the first TS.7,8 | ||
Our work highlights the practical relevance of dynamic effects to experimental organic chemistry. We use VRAI-selectivity calculations to investigate a set of complex organic reactions reported by Ryu et al.20–22 (Fig. 2) and demonstrate that their selectivity is heavily influenced by reaction dynamics. Notably, the chemical systems in this investigation feature significant complexity, encompassing a range of 90–112 atoms. The reactions are catalysed by chiral oxazaborolidinium ion (COBI) catalysts, a well-established and versatile catalyst system developed by Corey et al.23,24 COBI catalysts effectively activates carbonyl group as a Lewis acid and thus have broad applicability in various organic reactions under research setting.25–29 Our study initially centres around the ketone-selective reactions (Fig. 2B).22 These reactions involve identical substrates but exhibit distinct chemo- and stereoselective outcomes due to subtle variations in the substituents on the aromatic rings of the catalysts. We show that reaction dynamics plays a key role in determining the selectivity outcome. To validate this finding, we further selected two additional reactions: the epoxide20 and aldehyde21-selective reaction (Fig. 2C and D), in which the main products are epoxide and aldehyde, respectively. Despite changes in the substituents of diazo and aldehyde substrates, the underlying mechanism remains the same and the reaction outcomes are also governed by reaction dynamics.
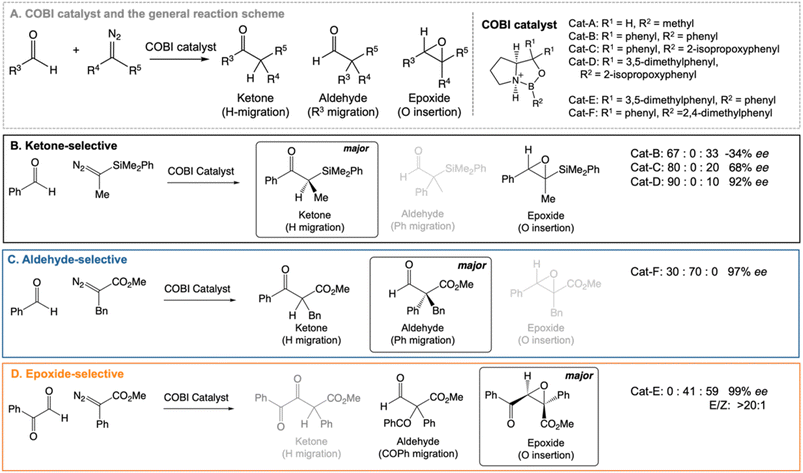 | ||
| Fig. 2 Chiral oxazaborolidinium ion (COBI) catalysed reactions between aldehyde and diazo compounds.20–22 We investigated the above reaction systems in this project. All enantiomeric excess (ee) values above are determined from chiral HPLC. For the ketone22 and aldehyde21-selective reaction, the major to minor product ratio comes directly from the crude product 1H NMR. For the epoxide-selective reaction,20 the yield for the aldehyde has not been explicitly reported for this reaction. We assume that the loss in percentage yield of the epoxide is all attributed to the aldehyde by-product. The major to minor product ratio is estimated from percentage yield of the isolated SR epoxide and diastereomeric ratio, which comes from 1H NMR of the crude product. Ryu et al. reported that changing the diazo substituent from CO2tBu to CO2Me do not alter the experimental outcome significantly. Thus, we simplified the diazo substituent from CO2tBu to CO2Me for the computational investigation. | ||
We note the publications of previous computational work in understanding the reactivity of COBI catalysts.30–37 This has focussed on pericyclic reactions, rationalizing the selectivity based on structural features of the key transition state (TS) structures and the non-covalent interactions between the substrates. To the best of our knowledge, the selected reactions have not been studied considering both reaction dynamics and the full conformational space of the system.
The selectivity controlled by reaction dynamics in complex organic systems is an underexplored area. The findings from this study showcase the efficacy of VRAI-selectivity in filling this gap in our understanding of selectivity and provide more accurate insights into the reaction process. We hope this will open up new avenues for developing better synthesis strategies.
2 Computational method
Conformational searching calculations were conducted in MacroModel (V13.4)38 with OPLS4![[thin space (1/6-em)]](https://www.rsc.org/images/entities/char_2009.gif) 39 force field. DFT calculations were conducted with Gaussian 16 (Revision A.03).40 All optimisations were performed at the B3LYP-D3/6-31G(d) level of theory.41–44 Single-point energy calculations were carried out at the ωB97X-D/6-311G(d,p) level of theory.45 3D images of the optimised structures were generated with CYLview20.46
39 force field. DFT calculations were conducted with Gaussian 16 (Revision A.03).40 All optimisations were performed at the B3LYP-D3/6-31G(d) level of theory.41–44 Single-point energy calculations were carried out at the ωB97X-D/6-311G(d,p) level of theory.45 3D images of the optimised structures were generated with CYLview20.46
We have explored the conformational space of key ground state structures thoroughly. CONFPASS was used to assist the DFT re-optimizations of force field structures with confidence that key stable structures are obtained at a reduced computational cost (https://github.com/Goodman-lab/CONFPASS).47,48 The default setting was used for generating the priority list for re-optimizing conformers. On average, we are more than 87% confident that the global minimum structure has been obtained after re-optimizing less than 37% of the conformers from the conformational searching output file (ESI Section 1.D†).
The VRAI-selectivity algorithm11 was utilized to account for the effects of reaction dynamics on reaction selectivity. Before running the main algorithm, an energy check was run at the ωB97XD/6-311g(d,p)//B3LYP-D3/6-31g(d) level of theory to ensure that the second transition states (TSIIs) are lower in Gibbs free energy than the first transition state (TSI). Otherwise, the programme would proceed to calculate the product percentages with the transition state theory (TST). The main VRAI-selectivity algorithm takes the geometries and frequency of the TSI, intermediate and products as inputs. The frequency analyses were conducted at the B3LYP-D3/6-31G(d) level of theory in this study. The dimensionality of the potential energy surface (PES) is reduced to two dimensions by examining the bond differences between the products or between a product and TSI based on their geometries (Fig. 3). The major product is determined by the direction in which the imaginary eigenvector of TSI points relative to the intermediate on the 2D PES. The width of the trajectory stream is estimated based on the real eigenvectors of a TS using harmonic oscillator approximation. The selective ratio is predicted by considering the width of the trajectory stream at TSI and how much of it favours each product. In this study, we developed and applied an extension to VRAI-selectivity, VRAI-multi. VRAI-selectivity is designed to be executed on terminals and for dealing with only one set of input files with two products at a time. VRAI-multi automates the process of VRAI-selectivity analyses in situations where there are more than two different products sharing the same intermediate and TSI on their reaction pathways. VRAI-multi is written as a Python package, which allows more flexibility in tuning hyperparameters, such as temperature, and integrations into other Python programmes. The scripts are available at https://github.com/Goodman-lab/VRAI-selectivity.
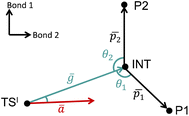 | ||
Fig. 3 A qualitative illustration of the 2D PES projection from the VRAI-selectivity calculation. ā is the imaginary eigenvector of TSI. ḡ is the separation between TSI and INT.  and and  are the displacement vectors from INT to P1 and P2, respectively.11 are the displacement vectors from INT to P1 and P2, respectively.11 | ||
3 Results and discussions
3.1 Mechanistic study
Previously, Wei et al. have conducted a mechanistic study on the chosen aldehyde-selective reaction (Fig. 2C).37 We performed a preliminary mechanistic study with a simplified COBI catalyst (i.e. Cat-A). The obtained results are applicable to all other reactions and our conclusions align with those of Wei et al. (Fig. 2 and 4) The complexation between the COBI catalyst and the aldehyde leads to INT1, where the formed B–O bond is syn to the N–H bond. The ΔG of the complexes with the opposite stereochemistry at the boron atom are at least 3.3 kcal mol−1 higher compared to INT1 across the various reaction systems in this study (ESI Fig. 4.6†). The addition of the diazo on INT1 gives an adduct, INT2, which undergoes a nitrogen elimination. Sequentially, a 1,2 shift or oxygen insertion occurs to give the products, which can be a ketone, aldehyde or epoxide.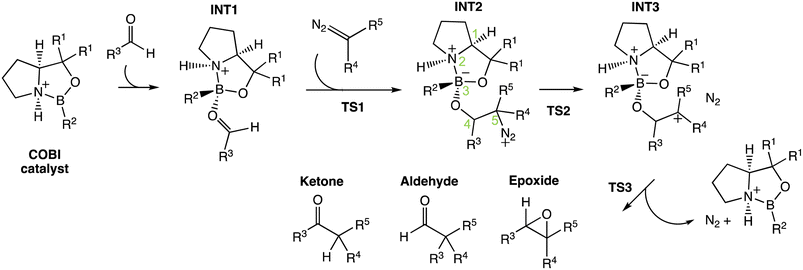 | ||
| Fig. 4 General mechanism for the COBI-catalysed reactions. The key stereo centres in INT2 are numbered. | ||
The carbocation structure after the nitrogen elimination, INT3, presents as a shoulder on the PES and the sequential process tends to be barrierless (i.e. ΔG‡(TS3) = 0 kcal mol−1). The group involved in the 1,2 shift or oxygen insertion must be at an anti-periplanar position relative to the leaving nitrogen. Hence, the stereochemistry of the product is determined by the stereochemistry of INT2 at C4 and C5. The chemoselectivity is controlled by the process after INT2. Thus, the focus of this investigation for understanding selectivity will be on the addition between aldehyde and INT1 via TS1 and nitrogen elimination via TS2.
There are some exceptions to the trend described above in the epoxide-selective reaction. We will discuss the difference in the following sections.
3.2 Predicting selectivity with VRAI-selectivity
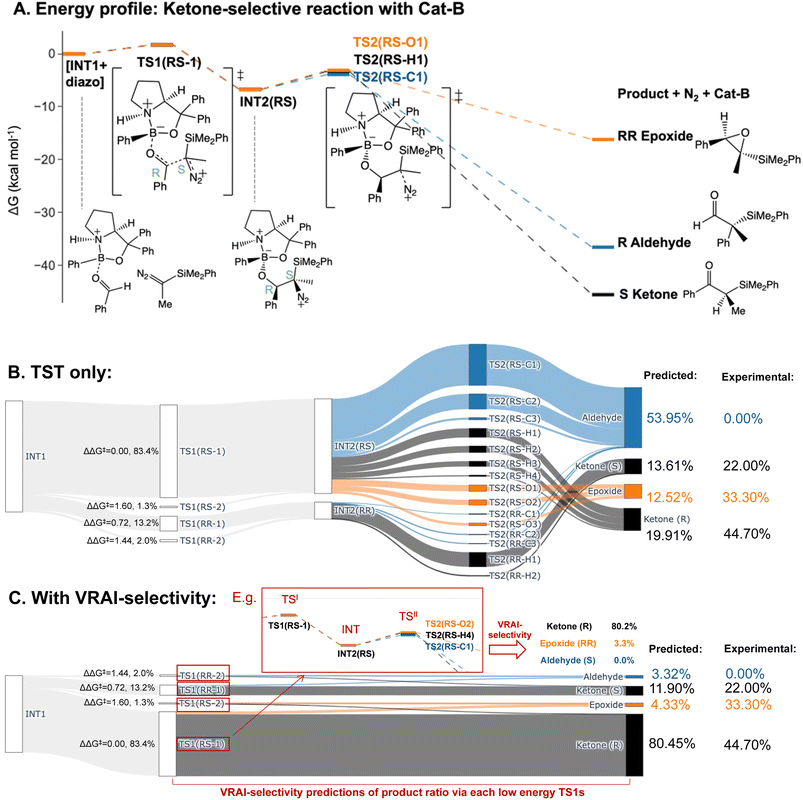
We predicted the product percentage for the reaction systems presented in Fig. 2 based on our calculations and compared them to the experimental results.Here, we will use the ketone-selective reaction with Cat-B as an example and elaborate on the procedure for calculating the product percentage. We first considered the transition state theory (TST) and assumed the product percentages are controlled kinetically by TS1s and TS2s. The process of the calculation is illustrated with the Sankey diagram in Fig. 5B. The percentage populations via the TSs were computed from the ΔΔG‡. Only the low-energy TSs, whose combined population accounted for 99% of the Boltzmann distribution, were selected for the calculation. The final product percentage was determined by summing up the percentage populations of the pathways that contribute to each product. We found distinct mismatches between the experimental and calculated product percentages (Table 1). TST predicts the aldehyde as the major product and contributes to more than 50% of the final product compositions.
| Experimental percentage | Calculated percentage (TST) | Calculated percentage (with VRAI) | |
|---|---|---|---|
| Ketone-selective – Cat-B | |||
| Aldehyde | 0.00% | 53.95% | 3.32% |
| Epoxide | 33.30% | 12.52% | 4.33% |
| Ketone (R) | 44.70% | 19.91% | 80.45% |
| Ketone (S) | 22.00% | 13.61% | 11.90% |
![[thin space (1/6-em)]](https://www.rsc.org/images/entities/char_2009.gif) |
|||
| Ketone-selective – Cat-C | |||
| Aldehyde | 0.00% | 31.16% | 15.41% |
| Epoxide | 25.00% | 0.00% | 21.41% |
| Ketone (R) | 12.00% | 0.00% | 9.53% |
| Ketone (S) | 63.00% | 68.84% | 53.65% |
![[thin space (1/6-em)]](https://www.rsc.org/images/entities/char_2009.gif) |
|||
| Ketone-selective – Cat-D | |||
| Aldehyde | 0.00% | 14.34% | 11.34% |
| Epoxide | 11.11% | 0.00% | 6.73% |
| Ketone (R) | 3.56% | 0.00% | 2.80% |
| Ketone (S) | 85.33% | 85.66% | 73.08% |
![[thin space (1/6-em)]](https://www.rsc.org/images/entities/char_2009.gif) |
|||
| Epoxide-selective – Cat-E | |||
| Aldehyde | 40.91% | 35.80% | 44.03% |
| Epoxide (SR) | 56.00% | 11.90% | 38.86% |
| Epoxide (RS) | 0.28% | 0.00% | 0.00% |
| Epoxide (SS + RR) | 2.81% | 52.15% | 3.87% |
| Ketone | 0.00% | 0.15% | 10.32% |
![[thin space (1/6-em)]](https://www.rsc.org/images/entities/char_2009.gif) |
|||
| Aldehyde-selective – Cat-F | |||
| Aldehyde (S) | 1.04% | 0.00% | 0.00% |
| Aldehyde (R) | 68.95% | 8.64% | 54.33% |
| Epoxide | 0.00% | 0.00% | 0.00% |
| Ketone | 30.00% | 91.36% | 45.67% |
We note the large difference between the TST predictions and the experimentally observed selectivity. One possible explanation for this is that the reaction process is partially controlled by reaction dynamics. However, it is also possible that we have missed important transition states. To check the second possibility, we explored the conformational space thoroughly for INT2 using CONFPASS. All possible conformations of TS1 and TS2 were optimized based on the INT2 structures at the DFT level for the ketone-selective reaction with Cat-B. Hence, we are confident that mismatches with the experimental results were not due to insufficient conformation sampling. Secondly, the energy profile (Fig. 5A) reveals features of PES where dynamic effects dominate and control the selectivity. The drop from TS1 to INT2 is more than 8 kcal mol−1, while the activation energy for TS2 is less than 3 kcal mol−1. This suggests that there is sufficient energy for trajectories to pass over INT2 easily and the process beyond TS1 may be controlled by reaction dynamics. We make this assumption in our analysis and test it by comparison with the experimentally determined outcomes.
We therefore investigated the effects of reaction dynamics using the VRAI-selectivity approach (Fig. 5C). A VRAI-selectivity calculation is performed for every selected low-energy TS1. The analyses were performed with TS1 as the first transition state (TSI) and INT2 as the intermediate structure. The product geometries come from the quick reaction coordinate calculations49 of the lowest energy TS2 structure that leads to the aldehyde, ketone or epoxide. The percentage population for each pathway was obtained by multiplying the product percentage from VRAI-selectivity analyses and the percentage population of the TS1 from ΔΔG‡. By accounting for the effects of reaction dynamics, we successfully predicted the major product chemoselectively and stereoselectively for the reaction with Cat-B. The energy profiles for the ketone-selective reaction with Cat-C and Cat-D are similar to that of the reaction with Cat-B. We repeated the product percentage calculation with and without considering reaction dynamics. The predicted percentages incorporating VRAI-selectivity calculations show much better agreement with the experimental results and suggest that the chemoselectivity is significantly influenced by reaction dynamics.
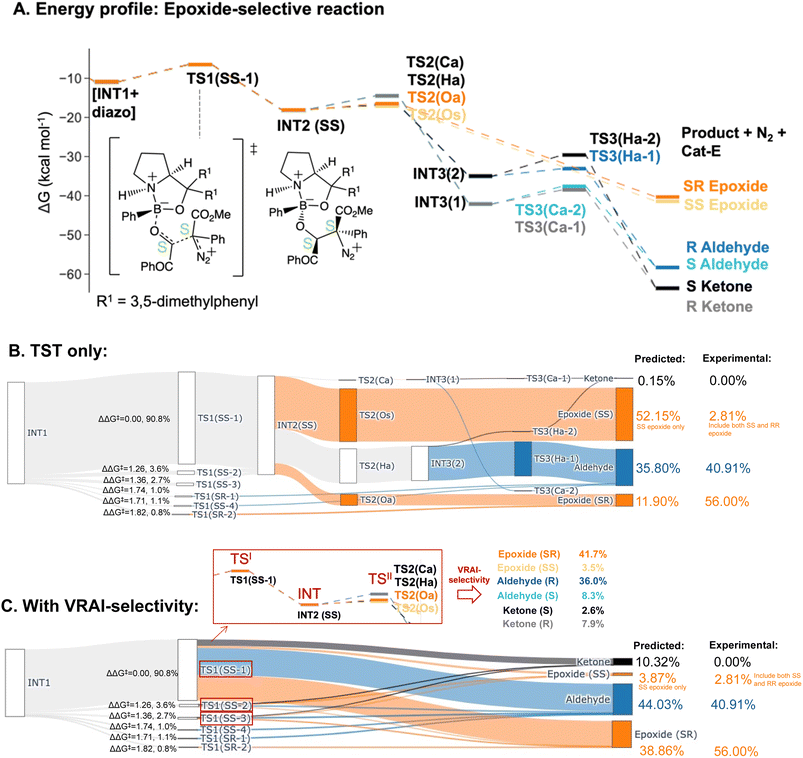
The PES of the epoxide-selective reaction is noticeable different from the ketone-selective reactions (Fig. 6A and B). Firstly, in minor pathways via TS1(SS-4), TS1(SR-1) and TS1(SR-2), the process beyond TS1 is barrierless and leads to the final product directly. Secondly, in the major pathway (i.e. via TS1(SS-1)), the syn-periplanar insertion (i.e. the inserting shifting group at the syn-periplanar position to the leaving nitrogen) has comparable kinetic barrier to the anti-periplanar insertion. The TS1 structure with the lowest ΔG‡, TS1(SS-1), contributes to both SR and SS epoxide. Unlike in other reactions, INT3 structures presents as a stable intermediate in the energy profile (ΔG‡(TS3) > 0 kcal mol−1) and can lead to both ketone (R/S) and aldehyde (R/S) upon 1,2-shift of the key group. Thus, all possible six products were considered in the VRAI-selectivity calculations for this reaction. The product percentages were calculated with and without incorporating VRAI-selectivity results. The predicted percentages with VRAI-selectivity calculations show a much closer match with the experimental result. The same conclusion as for the ketone-selective reaction can be drawn. The stereoselectivity is controlled kinetically by TS1, while the chemoselectivity is determined by the reaction dynamics of the process beyond TS1.
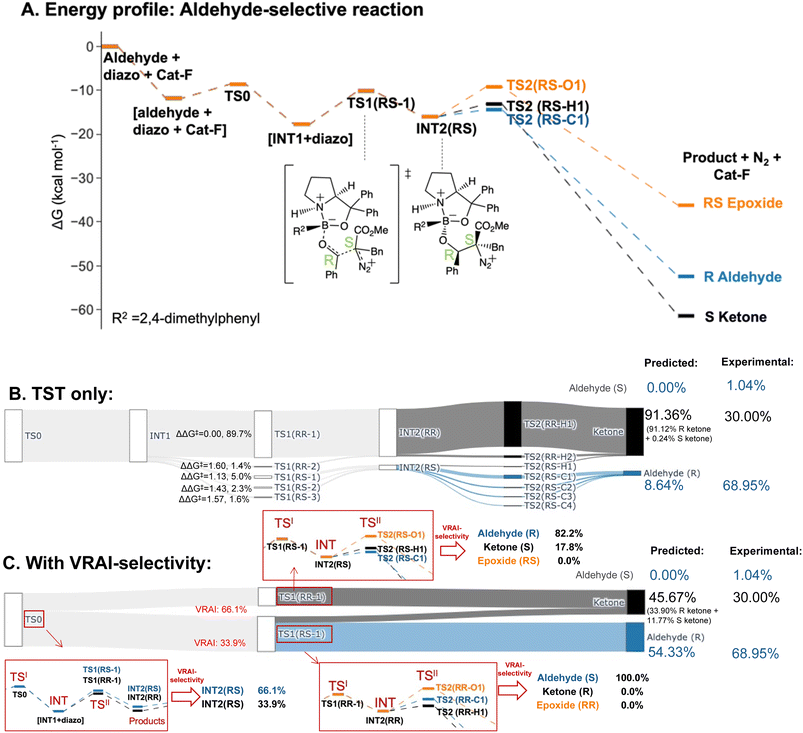
The selectivity of the aldehyde-selective reaction was found to be controlled by reaction dynamics entirely. The TS1(RR) with the lowest ΔG‡, with a stereochemistry of RR at C4 and C5 position, do not lead to the major product, R aldehyde. The earlier study of Wei et al., the selectivity is rationalized based on TST.37 Starting from the TS1 with the lowest ΔG‡ from their publication, which has a RS stereochemistry at C4 and C5, we reinvestigated the system, using a functional with a dispersion correction and thorough conformational exploration. This led to a different conclusion from TST which was now incompatible with the experimental result (ESI Table 5.1†). We investigated, therefore, whether the stereochemistry of the reaction may also be controlled by reaction dynamics. The drop in energy from TS0, the TS for the COBI catalyst and aldehyde complexation, to INT1 is more than 10 kcal mol−1. TS0 is more than 2.5 kcal mol−1 higher compared to the lowest energy TS1 (Fig. 7A). We conducted an additional VRAI-selectivity calculation with TS0 as the TSI and INT1 as the intermediate. The products are stereoisomers of INT2, INT2(RR) and INT2(RS). As the lowest energy TS2 to the epoxide is higher in energy than the corresponding TS1, this pathway is considered to be unfavourable kinetically. The final product percentages with VRAI-selectivity results were calculated based on three sets of VRAI-selectivity calculations. The Sankey diagram in Fig. 7C provides the details to the calculation. The calculated percentages incorporating VRAI-selectivity calculation results show a better match with the experimental result than the calculated percentages based on TST (Table 1). This implies that both the stereochemistry and chemoselectivity in the aldehyde-selective reaction may be influenced by reaction dynamics.
Inclusion of SMD solvent models50,51 in single-point energy calculations and structure re-optimisations with other functionals (i.e. ωB97XD, M06-2X and CAM-B3LYP) were considered for key TS1, TS2 and INT2 structures with an ΔΔG‡ < 2.5 kcal mol−1. We re-calculated the product percentages to reproduce Table 1 (ESI Tables 5.2 and 5.5†). Using a different set of energy did not change result patterns and the same conclusions can be drawn. The mean absolute error (MAE) of the calculated percentages compared to the experimental percentages were considered for various reaction systems at different of theory (ESI Tables 3.11, 5.3 and 5.6†). In all cases, the calculated percentages with VRAI-selectivity have a noticeably lower MAE than those based on TST only.
Quasi-classical MD calculations are regarded as the gold-standard approach to confirm that dynamics effects are important in reaction selectivity. They are much more computationally demanding than the VRAI-selectivity approach. Therefore, we carried out MD simulations with Jprogdyn52 on the ketone-selective reaction with Cat-B (see ESI Section 6†). We ran ten trajectories for up to 6 ps from the lowest energy TS, which took a month with our available computer systems. These calculations took four million times more CPU time from the identification of the TS than using VRAI-selectivity. The outcome did not correspond to the experimental result. If we had a hundred times more computer power, we would run more trajectories, starting from a range of low-energy TS. This would probably give an outcome that corresponds to the experimental outcome, but changes a demanding computational problem into an impractical one. VRAI-selectivity introduces some new approximations but gives answers consistent with experimental data almost instantly provided with the DFT calculation results.
In our analysis, we have considered steps to be controlled either by reaction dynamics or by TST. Even if the excess energy is large, however, partial dynamic control can occur, where some of the excess energy is dissipated to the environment and some by internal vibrational energy redistribution. The excess energy for the different processes is given in ESI Table 3.12.† A detailed analysis of the competition between these processes would require more data than we have available, and is a topic for further study.
Overall, the findings demonstrate the importance of considering both reaction kinetics and dynamics in predicting selectivity. A detailed breakdown of the calculations is given in the ESI (ESI Section 3).†
3.3 Implications for selectivity
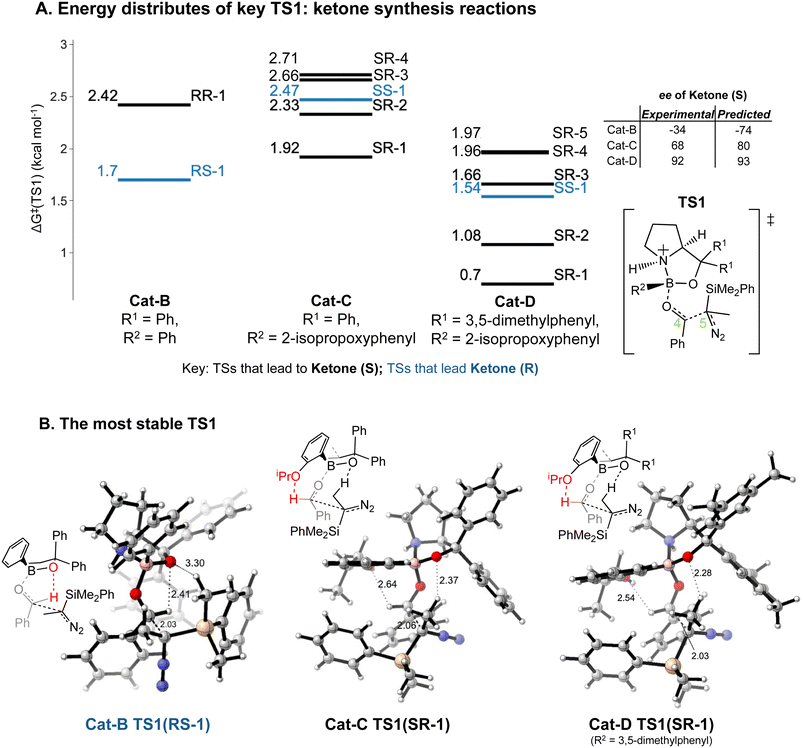
Our results lead to some general implications on explaining the reaction selectivity.Introducing an iPrO group at position 2 of the phenyl ring attached to boron alters the predominant reaction pathways and reverses the ketone enantioselectivity. For the reaction with Cat-B, the pathways via the lowest energy RR and RS TS1 contribute to 98% of the final product composition. For reactions with Cat-C and Cat-D, TS1 structures with a SR/SS configuration are lower in ΔG‡ than RR/RS TS1 structures. As opposed to Cat-B, reaction systems with Cat-C and Cat-D are more flexible and we obtained multiple stable SR TS1 with a ΔΔG‡ difference of less than 1.4 kcal mol−1 compared to the global minimum (Fig. 8A), which all contribute to the major product of the reaction, S ketone. The low-energy SR TS1s share similar geometries. The subtle conformational differences include different fused ring geometry and rotation of the iPrO group (ESI Section 4.B†). A critical common feature in these low-energy SR TS1 is the stabilising H-bonding interactions between the oxygen from the iPrO group and hydrogen from the aldehyde (Fig. 8B). In the reaction with Cat-B, the critical H-bond is absent in the lowest energy TS1 and the aldehyde adopts the reverse orientation, which leads to the R ketone as the major product. This leads to an intuitively-satisfying explanation for the reversal in enantioselectivity arising from a small change in catalyst structure.
The energy differences between the key TS1s are due to multiple factors besides the key H bond interactions. We also considered the dispersion interactions and distortions of the structure during the C–C bond formation. Distortion-interaction analyses were carried out on key TS1 structures with Cat-B, Cat-C and Cat-D. Stable TS1 structures tend to exhibit a more pronounced degree of structural distortion compared to the ground state as well as stronger non-covalent interactions between the diazo and INT1 complex. The results echo with the strong positive correlation between the ΔΔG‡ of TS1 and the length of the forming C–C bond across reactions with Cat-B, Cat-C and Cat-D (Fig. 9). Low-barrier C–C bond-forming pathways tend to have an earlier TS1.
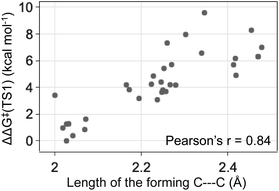 | ||
| Fig. 9 The ketone-selective reaction with Cat-D: ΔΔG‡ of TS1 vs. the forming C–C bond length. Level of theory: ωB97XD/6-311g(d,p)//B3LYP-D3/6-31g(d). | ||
Reactions with Cat-C and Cat-D are differed by the methyl groups at position 3 and 5 of the R1 phenyl rings, which change the energy distributions of key TS1 structures (Fig. 8A). Firstly, ΔG‡ of the TS1s in the reaction with Cat-D is slightly lower compared to the reaction with Cat-C. Secondly, ΔΔG‡ difference between the lowest energy SR TS1 and SS TS1 increases from using Cat-C to Cat-D, which effectively reduces the percentage of the minor R ketone product. Thirdly, VRAI-selectivity analyses on the process beyond TS1 show changes in the PES upon the addition of methyl groups. Across pathways via the low-energy SR TS1s, the S ketone is more dynamically favourable compared to R aldehyde and SS epoxide in the reaction with Cat-D compared to Cat-C.
Introducing the electron-withdrawing carbonyl group on the aldehyde substrate changes the PES significantly (Fig. 6A and 7). The pathway to epoxide is kinetically unfavourable in the aldehyde-selective reaction and higher in free energy than the corresponding TS1. TS2 structures to the epoxide have a ΔG‡ of at least 6.72 kcal mol−1, which corresponds to a ΔΔG‡ = 5.16 kcal mol−1 when compared to the lowest energy TS2 structure. In the epoxide-selective reaction, the ΔG‡ for TS2 structures to the epoxide are approximately 1 kcal mol−1. On the other hand, the corresponding TS2s to aldehyde and ketone have comparable kinetic barriers with a ΔG‡ in the range of 1.2–3.5 kcal mol−1 in both the epoxide and aldehyde-selective reaction. The change in the energy barrier of the epoxide pathways results in the process being dynamically controlled and lead to different chemoselectivities. We conducted Hirshfeld charge analyses and studied the charge distribution by functional groups on key TS structures (ESI Section 4.C†). The differences in charge distribution are insignificant across TS2s from both reactions. However, in TS1(SS-1) of the epoxide-selective reaction (ΔG‡ = 4.43 kcal mol−1), the COPh group on the aldehyde withdraws negative charges and is noticeably less positive compared to the corresponding Ph group in the TS1(RS-1) of the aldehyde-selective reaction (ΔG‡ = 7.59 kcal mol−1). The chemoselectivity of the epoxide-selective reaction is dynamically controlled by the trajectory from TS1 and the presence of the COPh group affects the charge distribution in TS1.
4 Conclusions
Our investigation of the COBI-catalysed reactions suggests that reaction dynamics play a significant role in controlling selectivity. In the ketone and epoxide-selective reactions, the stereochemistry is controlled kinetically by the initial addition between the diazo and the catalyst–aldehyde complex (TS1). However, the process beyond TS1 is controlled by reaction dynamics, which influence the chemoselectivity of the outcome. In the aldehyde-selective reaction, both the stereoselectivity and the chemoselectivity are dynamically controlled.We also conclude some general implications on the reaction selectivity. Modifying the substituents on the substrate or catalyst leads to changes in the PES. In the ketone-selective reaction systems, the addition of an iPrO group on the catalyst reverses the orientation of the aldehyde by providing the opportunity to for a new, favourable hydrogen bond. This leads to a reverse in enantioselectivity. Changing the phenyl rings to 3,5-dimethylphenyl favours the major product (i.e. S ketone) both chemo- and stereo-selectively. COPh-substituted aldehyde lowers the reaction barrier beyond TS1, which favours the synthesis of epoxides.
These results highlight the need for a more thorough explorations of conformational space and demonstrate the effectiveness of the VRAI-selectivity algorithm in predicting outcomes of dynamically controlled processes. Our study provides an important step towards a deeper understanding of the complex interplay between reaction dynamics and selectivity in organic synthesis. Moving forward, we encourage the computational organic chemistry community to consider the procedure presented in this paper, which will provide a more comprehensive and accurate understanding of chemical reactivity to drive the development of better catalyst and synthesis strategies.
Data availability
All the data for this paper is available on Cambridge Apollo Repository: https://doi.org/10.17863/CAM.96901. CONFPASS and VRAI-selectivity are available to download on GitHub (github.com/Goodman-lab/).Author contributions
Prof. J. M. Goodman conceptualised and supervised the project. C. C. Lam performed the research and wrote the paper with the guidance of Prof. J. M. Goodman.Conflicts of interest
There are no conflicts of interest.Acknowledgements
We thank Trinity College Cambridge and Krishnan-Ang Studentships Programme for the financial support of this project. This work was performed using resources provided by the Cambridge Service for Data Driven Discovery (CSD3), operated by the University of Cambridge Research Computing Service (https://www.csd3.cam.ac.uk), provided by Dell EMC and Intel using Tier-2 funding from the Engineering and Physical Sciences Research Council (capital grant EP/P020259/1) and DiRAC funding from the Science and Technology Facilities Council (https://www.dirac.ac.uk).References
- Q. Peng, F. Duarte and R. S. Paton, Chem. Soc. Rev., 2016, 45, 6093–6107 RSC.
- D. H. Ess, S. E. Wheeler, R. G. Iafe, L. Xu, N. Çelebi-Ölçüm and K. N. Houk, Angew. Chem., Int. Ed., 2008, 47, 7592–7601 CrossRef CAS PubMed.
- P. Bharadwaz, M. Maldonado-Domínguez and M. Srnec, Chem. Sci., 2021, 12, 12682–12694 RSC.
- Z. Yang, X. Dong, Y. Yu, P. Yu, Y. Li, C. Jamieson and K. N. Houk, J. Am. Chem. Soc., 2018, 140, 3061–3067 CrossRef CAS PubMed.
- T. Bekele, C. F. Christian, M. A. Lipton and D. A. Singleton, J. Am. Chem. Soc., 2005, 127, 9216–9223 CrossRef CAS PubMed.
- K. N. Houk, X.-S. Xue, F. Liu, Y. Chen, X. Chen and C. Jamieson, Isr. J. Chem., 2022, 62, e202100071 CrossRef CAS.
- Y. Oyola and D. A. Singleton, J. Am. Chem. Soc., 2009, 131, 3130–3131 CrossRef CAS PubMed.
- L. M. M. Quijano and D. A. Singleton, J. Am. Chem. Soc., 2011, 133, 13824–13827 CrossRef CAS PubMed.
- K. Jorner, A. Tomberg, C. Bauer, C. Sköld and P.-O. Norrby, Nat. Rev. Chem, 2021, 5, 240–255 CrossRef CAS PubMed.
- S. Lee and J. M. Goodman, J. Am. Chem. Soc., 2020, 142, 9210–9219 CrossRef CAS PubMed.
- S. Lee and J. M. Goodman, Org. Biomol. Chem., 2021, 19, 3940–3947 RSC.
- X.-S. Xue, C. S. Jamieson, M. Garcia-Borràs, X. Dong, Z. Yang and K. N. Houk, J. Am. Chem. Soc., 2019, 141, 1217–1221 CrossRef CAS PubMed.
- P. Yu, T. Q. Chen, Z. Yang, C. Q. He, A. Patel, Y. Lam, C.-Y. Liu and K. N. Houk, J. Am. Chem. Soc., 2017, 139, 8251–8258 CrossRef CAS PubMed.
- S. R. Hare and D. J. Tantillo, Chem. Sci., 2017, 8, 1442–1449 RSC.
- A. Martin-Somer, X.-S. Xue, C. S. Jamieson, Y. Zou and K. N. Houk, J. Am. Chem. Soc., 2023, 145, 4221–4230 CrossRef CAS PubMed.
- D. H. Ess, Acc. Chem. Res., 2021, 54, 4410–4422 CrossRef CAS PubMed.
- R. P. Pemberton and D. J. Tantillo, Chem. Sci., 2014, 5, 3301–3308 RSC.
- Y. J. Hong and D. J. Tantillo, Nat. Chem., 2009, 1, 384–389 CrossRef CAS PubMed.
- K. H. K. Park, N. Frank, F. Duarte and E. A. Anderson, J. Am. Chem. Soc., 2022, 144, 10017–10024 CrossRef CAS PubMed.
- D. G. Nam, S. Y. Shim, H.-M. Jeong and D. H. Ryu, Angew. Chem., Int. Ed., 2021, 60, 22236–22240 CrossRef CAS PubMed.
- L. Gao, B. C. Kang and D. H. Ryu, J. Am. Chem. Soc., 2013, 135, 14556–14559 CrossRef CAS PubMed.
- J. Y. Kim, B. C. Kang and D. H. Ryu, Org. Lett., 2017, 19, 5936–5939 CrossRef CAS PubMed.
- E. J. Corey, R. K. Bakshi and S. Shibata, J. Am. Chem. Soc., 1987, 109, 5551–5553 CrossRef CAS.
- E. J. Corey, Angew. Chem., Int. Ed., 2009, 48, 2100–2117 CrossRef CAS PubMed.
- J. Y. Kim, Y. S. Lee and D. H. Ryu, ACS Catal., 2021, 11, 14811–14818 CrossRef CAS.
- S. Y. Shim and D. H. Ryu, Acc. Chem. Res., 2019, 52, 2349–2360 CrossRef CAS PubMed.
- D. H. Ryu and E. J. Corey, J. Am. Chem. Soc., 2004, 126, 8106–8107 CrossRef CAS PubMed.
- L. Zeng, J. Xu, D. Zhang, Z. Yan, G. Cheng, W. Rao and L. Gao, Angew. Chem., Int. Ed., 2020, 59, 21890–21894 CrossRef CAS PubMed.
- B. Thirupathi, S. Breitler, K. Mahender Reddy and E. J. Corey, J. Am. Chem. Soc., 2016, 138, 10842–10845 CrossRef CAS PubMed.
- E. H. E. Farrar and M. N. Grayson, J. Org. Chem., 2022, 87, 10054–10061 CrossRef CAS PubMed.
- R. S. Paton, Org. Biomol. Chem., 2014, 12, 1717–1720 RSC.
- M. N. Paddon-Row, L. C. H. Kwan, A. C. Willis and M. S. Sherburn, Angew. Chem., Int. Ed., 2008, 47, 7013–7017 CrossRef CAS PubMed.
- M. N. Paddon-Row, C. D. Anderson and K. N. Houk, J. Org. Chem., 2009, 74, 861–868 CrossRef CAS PubMed.
- N. Y. M. Omar, N. A. Rahman and S. M. D. Zain, J. Comput. Chem., 2011, 32, 1813–1823 CrossRef CAS PubMed.
- K. Sakata and H. Fujimoto, J. Org. Chem., 2013, 78, 3095–3103 CrossRef CAS PubMed.
- Z. Pi and S. Li, J. Phys. Chem. A, 2006, 110, 9225–9230 CrossRef CAS PubMed.
- Y. Wang, X. Guo, M. Tang and D. Wei, J. Phys. Chem. A, 2015, 119, 8422–8431 CrossRef CAS PubMed.
- Schrödinger Release 2021-2 Maestro, Schrödinger, LLC, New York, NY, 2021 Search PubMed.
- C. Lu, C. Wu, D. Ghoreishi, W. Chen, L. Wang, W. Damm, G. A. Ross, M. K. Dahlgren, E. Russell, C. D. Von Bargen, R. Abel, R. A. Friesner and E. D. Harder, J. Chem. Theory Comput., 2021, 17, 4291–4300 CrossRef CAS PubMed.
- M. J. Frisch, G. W. Trucks, H. B. Schlegel, G. E. Scuseria, M. A. Robb, J. R. Cheeseman, G. Scalmani, V. Barone, G. A. Petersson, H. Nakatsuji, X. Li, M. Caricato, A. V. Marenich, J. Bloino, B. G. Janesko, R. Gomperts, B. Mennucci, H. P. Hratchian, J. V. Ortiz, A. F. Izmaylov, J. L. Sonnenberg, D. Williams-Young, F. Ding, F. Lipparini, F. Egidi, J. Goings, B. Peng, A. Petrone, T. Henderson, D. Ranasinghe, V. G. Zakrzewski, J. Gao, N. Rega, G. Zheng, W. Liang, M. Hada, M. Ehara, K. Toyota, R. Fukuda, J. Hasegawa, M. Ishida, T. Nakajima, Y. Honda, O. Kitao, H. Nakai, T. Vreven, K. Throssell, J. A. Jr, J. E. Peralta, F. Ogliaro, M. J. Bearpark, J. J. Heyd, E. N. Brothers, K. N. Kudin, V. N. Staroverov, T. A. Keith, R. Kobayashi, J. Normand, K. Raghavachari, A. P. Rendell, J. C. Burant, S. S. Iyengar, J. Tomasi, M. Cossi, J. M. Millam, M. Klene, C. Adamo, R. Cammi, J. W. Ochterski, R. L. Martin, K. Morokuma, O. Farkas, J. B. Foresman and D. J. Fox, Gaussian 16, Revision A.03, Gaussian, Inc., Wallingford CT, 2016 Search PubMed.
- A. D. Becke, Phys. Rev. A, 1988, 38, 3098–3100 CrossRef CAS PubMed.
- C. Lee, W. Yang and R. G. Parr, Phys. Rev. B: Condens. Matter Mater. Phys., 1988, 37, 785–789 CrossRef CAS PubMed.
- A. D. Becke, J. Chem. Phys., 1993, 98, 5648–5652 CrossRef CAS.
- S. Grimme, S. Ehrlich and L. Goerigk, J. Comput. Chem., 2011, 32, 1456–1465 CrossRef CAS PubMed.
- J.-D. Chai and M. Head-Gordon, Phys. Chem. Chem. Phys., 2008, 10, 6615–6620 RSC.
- CYLview20, Université de Sherbrooke, 2020, http://www.cylview.org (accessed June 02, 2023).
- C. C. Lam and J. M. Goodman, J. Chem. Inf. Model., 2023, 63, 4364–4375 CrossRef CAS PubMed.
- C. C. Lam and J. M. Goodman, Org. Chem. Front., 2022, 9, 3730–3738 RSC.
- J. M. Goodman and M. A. Silva, Tetrahedron Lett., 2003, 44, 8233–8236 CrossRef CAS.
- A. V Marenich, C. J. Cramer and D. G. Truhlar, J. Phys. Chem. B, 2009, 113, 6378–6396 CrossRef PubMed.
- G. Scalmani and M. J. Frisch, J. Chem. Phys., 2010, 132, 114110 CrossRef PubMed.
- E. E. Kwan and R. Y. Liu, J. Chem. Theory Comput., 2015, 11, 5083–5089 CrossRef CAS PubMed.
Footnote |
| † Electronic supplementary information (ESI) available. See DOI: https://doi.org/10.1039/d3sc03009a |
| This journal is © The Royal Society of Chemistry 2023 |

