 Open Access Article
A sensitive electrochemiluminescence immunosensor for carbohydrate antigen 12-5 analysis based on dual-function SnO2 nanoflowers†
Xiangfei
Zheng
,
Dongmiao
Qin
,
Shenglan
Hu
,
Weiming
Mo
and
Biyang
Deng
 *
*
State Key Laboratory for Chemistry and Molecular Engineering of Medicinal Resources, School of Chemistry and Pharmaceutical Sciences, Guangxi Normal University, Guilin 541004, China. E-mail: dengby16@163.com
First published on 26th January 2023
Abstract
Tin oxide nanoflowers (SnO2NFs) are used as both an electrochemiluminescent (ECL) signal generator and a carrier of nanomaterials due to the advantages of excellent electrical conductivity, large specific surface area, and good optical properties. AuNPs/PEI-SnO2NFs provide a larger binding site for the immobilization of secondary antibodies (CA12-5-Ab2). The synthesized Ag@ZnONS composite with a large specific surface area and good biocompatibility was applied to immobilize more primary antibodies (CA12-5-Ab1), which further enhanced the ECL signal and obviously improved the sensitivity and selectivity of the immunosensor. A novel signal amplification ECL immunosensor for detecting carbohydrate antigen 12-5 (CA12-5) was fabricated with AuNPs/PEI-SnO2NFs as a signal probe and Ag@ZnONSs as the sensing matrix. The ECL intensity was linearly related to the logarithm of the CA12-5 concentration in the range from 1 × 10⁻⁵ to 50 ng mL−1 under optimized conditions. The limit of detection was 2.6 fg mL−1 (S/N = 3). The assay had good operational stability, specificity, and high sensitivity. The study was applied to analyze the CA12-5 level in human serum with satisfactory results, which could be applied in clinical immunoassays.
1. Introduction
Ovarian cancer is the main malignant tumor among gynecological cancers and has a high incidence worldwide, posing a serious threat to women's lives.1,2 Women with ovarian cancer may not have any symptoms or only have slight symptoms up to the disease progression. Oncologists believe that detecting tumor markers is an important means of achieving early detection, diagnosis, treatment, and mortality reduction of ovarian cancer.3 Carbohydrate antigen 12-5 (CA12-5) is a significant protein marker in serum for the clinical diagnosis of ovarian cancer.4 The level of CA12-5 is used to monitor responses to chemotherapy, relapse, and disease progression in ovarian cancer patients. CA12-5 is also regarded as mucin 16 (MUC16);5 the level of CA12-5 in human serum is usually lower than 35 U mL−1.6 In addition, CA12-5 can also be used as a biomarker in the clinical diagnosis of lung cancer, endometrial cancer, and breast cancer.7,8 Therefore, the high-sensitivity detection of CA12-5 has crucial clinical significance for these cancers, such as early screening, early diagnosis, and treatment.Immunoassay methods based on antibody–antigen-specific binding have been widely used in CA12-5 detection. Currently, the reported immunoassay methods mainly include fluorescence immunoassay,9 electrochemical immunoassay,10,11 chemiluminescence immunoassay,12 enzyme-linked immunosorbent assay,13 and surface plasma resonance immunoassay.14 These methods have some weaknesses, including low sensitivity, long analysis time, unstable substrates, and complex experimental procedures. Compared with the aforementioned methods, electrochemiluminescence (ECL) immunoassay has been generally applied in environmental, food, and biological detection due to its low background signal, high sensitivity, good selectivity, rapid response, wider dynamic range, and easier operating procedures.15–20 Sandwich-type ECL immunosensors can achieve satisfactory sensitivity and selectivity. Wang's group designed a sandwich-type ECL immunosensor for determining the CA12-5 level using luminol nanocomposites (AuNPs-EGN-Luminol) labeling Ab1 as the signal probe and glucose oxidase-encapsulated nano-gold hollow microspheres (GOx-GHS) as a sensing platform for fixing Ab2.21
Luminol, semiconductor quantum dots (QDs), and Ru(bpy)32+ have been used as a traditional ECL luminophore, which needs a suitable nanocarrier to load itself for improving luminous efficiency.22–24 Still, an efficient ECL luminescent material with excellent electrical conductivity, low toxicity, high stability, and good biocompatibility needs to be developed to assemble immunosensors. Metal oxide nanocrystals such as tin oxide crystals (SnO2NCs) are promising nanomaterials. Their basic research and applications in sensors have been subjected to an area of concern in terms of chemical and biological analyses.25 Tin oxide nanoflowers (SnO2NFs) with a flower-like structure, which are formed by the aggregation of ultrathin SnO2 nanosheets, have good conductivity, high load capacity, and large specific surface area. They are a new type of highly efficient ECL luminophore, which reacts with co-reactant K2S2O8, resulting in cathode ECL emission.26 However, pure SnO2NFs were electronegative, and the water solubility was poor, limiting their application in biosensors. Polyethylenimine (PEI) is a cationic polyelectrolyte rich in amine, which has excellent hydrophilicity and easily forms complexes with metal ions.27,28 In this study, PEI was selected as the stabilizer and dispersant of SnO2NFs. After the surface modification of SnO2NFs, PEI not only improved the water solubility of SnO2NFs but also endowed SnO2NFs with abundant –NH2 groups, which was conducive to connecting with other nanomaterials. The prepared PEI-functionalized SnO2NFs (PEI-SnO2NFs) were completely encapsulated by cations due to the cationic nature of PEI and could be combined with anionic nanomaterials by electrostatic adsorption.
High-conductivity nanomaterials need to be introduced to enhance the electron transmission capability of SnO2NFs and amplify the ECL signals so as to improve the sensitivity of the immunosensor. Gold nanoparticles (AuNPs) have the advantages of excellent electrical conductivity, good biocompatibility, and easy coupling with antibodies,29 thus improving the performance of biosensors. The –NH2 groups of PEI-SnO2NFs can be used as linkers to combine with AuNPs. The AuNP/PEI-SnO2NF composites are obtained, and the ECL signal is significantly enhanced. Another important step in assembling the sandwich-type ECL immunosensor is to synthesize the capture probe for labeling a primary antibody (Ab1). Zinc oxide (ZnO) can grow on various substrates, with high chemical stability and electrochemical activity and low cytotoxicity.30 Compared with zinc oxide nanoparticles (ZnONPs), ZnO nanosheets (ZnONSs) have a larger specific surface area. However, ZnONSs have poor conductivity as an electrode material.31 The introduction of AgNPs into ZnONSs not only facilitates the immobilization of antibodies but also improves the electrical conductivity of ZnONSs, thus accelerating the electron transfer of immunosensors.
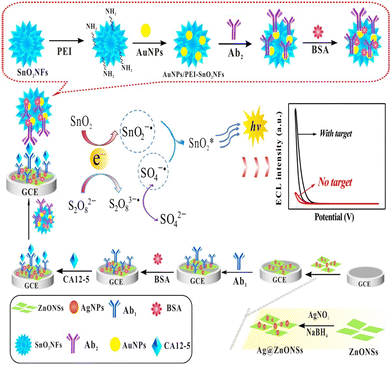
In this study, SnO2NFs, as dual-function materials, were used as both an ECL luminophore and a carrier of AuNPs and biomolecules, greatly simplifying the assembly of the immunosensor. The ECL immunosensor for CA12-5 detection was prepared using an Ag@ZnONS-modified electrode as the sensing substrates for loading Ab1 and the AuNP/PEI-SnO2NF composite as the signal probe-labeled Ab2. As shown in Scheme 1, SnO2NFs were used as an ECL luminophore and a nanocarrier in the immunosensor. The PEI-functionalized SnO2NFs improved the luminous efficiency. It also endowed SnO2NFs with –NH2 groups, which were further loaded with AuNPs to obtain the AuNP/PEI-SnO2NF composite. The introduction of AuNPs could enhance the loading ability of Ab2 and improved the conductivity of luminescent materials, promoting electron transfer and thereby greatly amplifying ECL signals. Ag@ZnONSs served as a sensing platform to immobilize Ab1 and enhance the electrical conductivity of the electrode, which further improved the sensitivity of the immunosensor. The ECL sensor had some advantages, such as a wide linear range, high sensitivity, good stability, and repeatability. The study provided a new method for determining other biomarkers.
2. Experimental
2.1 Reagents and apparatus
The analytical-grade reagents were used. Sodium citrate dihydrate (C6H5Na3O7·2H2O, 99%), N-hydroxysuccinimide, silver nitrate (AgNO3, 99.8%), tin chloride pentahydrate (SnCl4·5H2O, 99%), polyvinyl pyrrolidone (PVP), polyethyleneimine (PEI, 99%), urea (99%), zinc nitrate hexahydrate Zn(NO3)2·6H2O (99%), glucose, HAuCl4·3H2O (99.8%), K3[Fe(CN)6] (99.5%), K4[Fe(CN)6]·3H2O (99.5%), sodium borohydride (NaBH4, 99%), and 1-ethyl-3-(3-dimethylaminopropyl) carbodiimide (EDC, 98%) were obtained from Aladdin Chemical Reagent Co., Ltd. (Nanning, China). Potassium chloride (KCl, 99.5%), potassium persulfate (K2S2O8, 99.5%), sodium hydroxide (NaOH, 96%), Na2HPO4·12H2O (99%), and NaH2PO4·2H2O (99%) were procured from Xilong Chemical Co., Ltd. (Guangzhou, China). Cancer antigen 12-5 (CA12-5), prostate-specific antigen (PSA), human chorionic gonadotropin (HCG), carcinoembryonic antigen (CEA), α-fetoprotein (AFP), squamous cell carcinoma antigen (SCCA), and bovine serum albumin (BSA) were purchased via Beijing Boaosen Biotechnology Co., Ltd. (Beijing, China). The experimental medium was deionized water.The composite properties were recorded using a LEO1530 field emission scanning electron microscope (SEM) (Carl Zeiss AG Co., Ltd., Germany), a Tecnai G2 F20 S-TWIN field emission transmission electron microscope (TEM) (FEI, USA), a Max-2200 PC power X-ray diffractometer (XRD) (Rigaku, Japan), a Spectrum Two Fourier-transform infrared spectrophotometer (FT-IR) (Perkin-Elmer, USA), an RF-5301 fluorescence spectrometer (Shimadzu, Japan), and a Cary-60 ultraviolet-visible (UV-vis) absorption spectrometer (Agilent Technologies, USA). ECL signals were recorded with an MPI-ECL analyzer (Xi'an Remex Electronic Science-Tech Co., Ltd., China). A CHI660 electrochemical workstation (Shanghai Chenhua Instrument Co., China) was used for electrochemical impedance spectroscopy (EIS). In this study, the reference electrode was an Ag/AgCl electrode, the auxiliary electrode was a platinum wire, and the working electrode was a modified glassy carbon electrode (GCE). A phosphate buffer solution (PBS, pH 7.4, 0.1 M) was prepared using stock solutions of 0.1 M NaH2PO4 and 0.1 M Na2HPO4 under definite volume ratios.
2.2 Preparation of SnO2NFs
SnO2NFs were prepared using a one-step hydrothermal approach, as reported earlier.32 For this, 1.128 g SnCl4·5H2O and 2.941 g C6H5Na3O7·2H2O were mixed with 40 mL of 50% (V/V) anhydrous ethanol and stirred vigorously for 1 h to obtain a uniform solution. The mixture was transferred into a Teflon-lined autoclave and then heated at 180 °C for 12 h. The autoclave was spontaneously cooled to room temperature (RT). The products were obtained via centrifugation at 12![[thin space (1/6-em)]](https://www.rsc.org/images/entities/char_2009.gif) 000 rpm for 10 min. The resulting product was rinsed using CH3CH2OH and deionized water. Finally, the solid SnO2NFs product was obtained by drying at 60 °C overnight.
000 rpm for 10 min. The resulting product was rinsed using CH3CH2OH and deionized water. Finally, the solid SnO2NFs product was obtained by drying at 60 °C overnight.
2.3 Synthesis of AuNP/PEI-SnO2NF composites
Scheme 1 depicts the synthesis of AuNP/PEI-SnO2NF composites. For this, 10 mg SnO2NFs were dispersed in absolute ethanol solution (10 mL) and ultrasonicated for 30 min to obtain SnO2NF solution. To modify the SnO2NFs with amino groups, 5 mg PEI was mixed with the aforementioned solution and stirred vigorously for 6 h. The sample was centrifuged and rinsed with deionized water three times. The obtained PEI-SnO2NFs and 2% HAuCl4 (3000 μL) were added to deionized water (20 mL) and stirred for 5 min. Then, 0.007 g of polyethylene pyrrolidone was dispersed in the aforementioned suspension and stirred continually for 30 min to block the agglomeration of AuNPs. Further, 100 μL of 0.5 M C6H5Na3O7 (reductant) and NaBH4 (reductant) were added to the aforementioned solution and stirred continually for 12 h. The solid product was rinsed with deionized water several times till the supernatant became colorless. The AuNP/PEI-SnO2NF nanocomposites were obtained and dried at 60 °C overnight for subsequent use.2.4 Synthesis of Ab2/AuNPs/PEI-SnO2NFs
Scheme 1 shows the preparation of Ab2/AuNP/PEI-SnO2NF bioconjugate. First, 20 mg AuNPs/PEI-SnO2NFs were mixed with 10 mL of PBS solution. Next, 1 mg mL−1 Ab2 (10 μL) solution was mixed with the AuNP/PEI-SnO2NF suspension and gently stirred for 6 h. Subsequently, 20 μL of 1% BSA was added to the aforementioned suspension and reacted for 1 h to impede nonspecific binding sites. Ab2/AuNPs/PEI-SnO2NFs were collected via centrifugation and washed with PBS solution to eliminate unreacted substances. Finally, the obtained Ab2/AuNP/PEI-SnO2NF signal probes were redispersed in 1000 μL of PBS solution and preserved at 4 °C till further use.2.5 Preparation of the Ag@ZnONS composite
ZnONSs were synthesized as described previously.33 For this, 1 mM zinc nitrate hexahydrate, 2 mM urea, and 500 mg polyethylene pyrrolidone were consecutively mixed with deionized water and stirred for 30 min. The mixture was transferred into a Teflon-lined autoclave and heated at 120 °C for 8 h. After the autoclave was naturally cooled to RT, the resulting white product was separated through centrifugation (10![[thin space (1/6-em)]](https://www.rsc.org/images/entities/char_2009.gif) 000 rpm, 5 min). The ZnONSs were rinsed with anhydrous ethanol and deionized water three times and dried at 60 °C overnight.
000 rpm, 5 min). The ZnONSs were rinsed with anhydrous ethanol and deionized water three times and dried at 60 °C overnight.
An Ag@ZnONS composite was prepared by dissolving 0.03 g ZnONSs, 0.2 g PVP, and 0.1 g glucose in 20 mL of deionized water and magnetically stirred for 10 min at 50 °C. Then, 500 μL of 0.4 M AgNO3 solution was mixed rapidly with the aforementioned mixture. Next, the mixture was stirred at 90 °C for 2 h to generate silver nanoparticles and modified on the surface of ZnONSs. The brown precipitate was collected by centrifugation and washed with ethanol and deionized water. Solid Ag@ZnONSs were obtained by drying at 60 °C overnight for later use. Further, 1 mg Ag@ZnONS was mixed with 1000 μL of PBS solution and stored at 4 °C until use.
2.6 Construction of the ECL sensor
The sensor was assembled as illustrated in Scheme 1. The electrode was treated by a previously described method.17 First, 8 μL of 1 mg mL−1 Ag@ZnONS was directly covered on the bare electrode surface and naturally dried. Afterward, 8 μL of 100 μg mL−1 Ab1 solution was immobilized onto the surface of GCE/Ag@ZnONSs and reacted at 4 °C for 12 h to obtain GCE/Ag@ZnONSs/Ab1. Subsequently, 5 μL of 1% BSA solution was dropped and reacted at 37 °C for 50 min to prevent nonspecific adsorption. Then, 6 μL of different concentrations of CA12-5 antigen solutions were combined with the GCE/Ag@ZnONSs/Ab1/BSA and incubated at 37 °C for 50 min to specifically bind with Ab1. Finally, 8 μL of Ab2/AuNP/PEI-SnO2NF (2 mg mL−1) was incubated with GCE/Ag@ZnONSs/Ab1/BSA/CA12-5 through specific binding at 37 °C for 1 h. In addition, the modified GCE was washed with PBS (pH 7.4) solution to eliminate excess antibodies. The obtained sandwich-type sensor was kept at 4 °C until use.2.7 CA12-5 measurement
An electrochemiluminescence test was performed in a cell containing 1 mL of pH 7.4 PBS (0.1 M) including potassium persulfate (0.1 M) solution. The photomultiplier tube (PMT) voltage was set at 800 V. The working potential ranged from −2.0 to 0 V, and the scan rate was 100 mV s−1. The GCE/Ag@ZnONSs/Ab1/BSA/CA12-5/Ab2/AuNP/PEI-SnO2NF immune electrode was used for signal measurement.3. Results and discussion
3.1 Characterization of the AuNPs/PEI-SnO2NFs and Ag@ZnONSs
SEM and TEM were used to investigate the morphology of the nanocomposite. Fig. 1A and B show the SEM image of SnO2NFs. The prepared SnO2NFs displayed a hierarchic flower-like structure with a size distribution range of 1–2 μm. This structure originated from the assembly of nanosheets with an ultrathin thickness. A majority of nanosheets were vertically arranged in a special mode such that the edge of a nanosheet was connected with the side surface of the other nanosheets. The SnO2NFs were well dispersed, and the surface was smooth with high growth density, indicating that SnO2NFs had a large specific surface area. The morphology of the prepared AuNPs/PEI-SnO2NFs was examined using SEM and is shown in Fig. 1C. It was clearly shown that the surface of PEI-SnO2NFs was covered with large numbers of small particles. The morphology of AuNPs/PEI-SnO2NFs was studied using a TEM. Fig. 1D shows that the uniformly dispersed AuNPs were adsorbed on the surface of the nanoflowers. The AuNPs were spherically shaped with different sizes and had an average diameter of 13 nm. The addition of PVP during the synthesis prevented the aggregation of AuNPs, indicating the successful preparation of AuNP/PEI-SnO2NF nanocomposites. The TEM images of ZnONSs and the TEM and SEM images of Ag@ZnONSs are displayed in Fig. 1E–G. It was obviously seen that the ZnONSs had an ultrathin nanosheet structure and a large surface interface. A large number of AgNPs were loaded on the ZnONSs and had an average diameter of 25 nm. This indicated that AgNPs triumphantly grew on the ZnONSs surface, providing enough contact surfaces for biomolecules.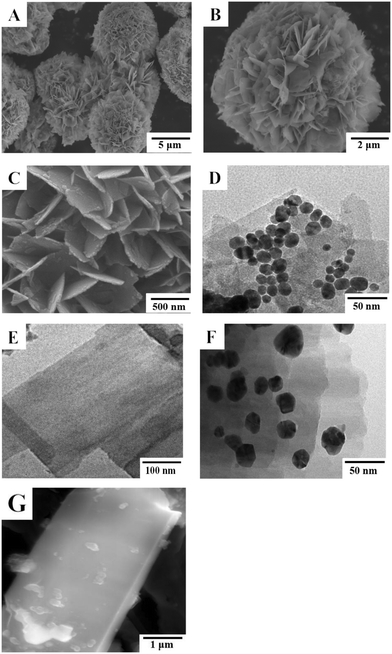 | ||
| Fig. 1 (A and B) SEM images of SnO2NFs with different magnifications. (C) SEM and (D) TEM images of AuNPs/PEI-SnO2NFs. (E) TEM images of ZnONSs. (F) TEM and (G) SEM images of Ag@ZnONSs. | ||
The SnO2NFs (a), PEI-SnO2NFs (b), and AuNPs/PEI-SnO2NFs (c) were characterized using zeta potential and FT-IR spectroscopy. As displayed in Fig. 2A, the zeta potential value of SnO2NFs was −33.5 mV. After PEI modification, the zeta potential value of PEI-SnO2NFs increased to +39 mV, which belonged to high positive charges of the –NH2 of PEI on the SnO2NFs surface. When the PEI-SnO2NFs were loaded with negatively charged AuNPs through electrostatic adsorption, the zeta potential value of the AuNPs/PEI-SnO2NFs dropped to +11.3 mV. Fig. 2B shows the FT-IR spectra of SnO2NFs, PEI-SnO2NFs, and AuNPs/PEI-SnO2NFs. It was observed that SnO2NFs (curve a) had infrared peaks at 3430 cm−1 and 1651 cm−1, which depicted the stretching and bending vibrations of –OH. The main peak at 592 cm−1 was attributed to the antisymmetric vibration of O–Sn–O.34 The FT-IR spectrum of PEI-SnO2NFs (curve b) had two new peaks at 2930 cm−1 and 1120 cm−1, corresponding to C–H stretching vibration and N–H bending vibration.35 It indicated that PEI had successfully modified SnO2NFs. The peak intensity of AuNPs/PEI-SnO2NFs (curve c) reduced after AuNPs were adsorbed on the surface of PEI-SnO2NFs. The zeta potential measurements and FT-IR spectra proved that the AuNP/PEI-SnO2NF composites were successfully prepared.
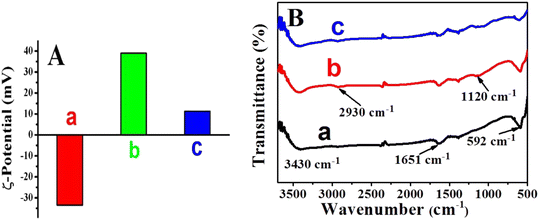 | ||
| Fig. 2 Zeta potential (A) and FT-IR spectra (B) of SnO2NFs (a), PEI-SnO2NFs (b), and AuNPs/PEI-SnO2NFs (c). | ||
XPS characterization was carried out to determine the elemental composition and chemical oxidation valence of the SnO2NF survey spectrum (Fig. S1A†), Sn3d spectrum (Fig. S1B†), and O1s spectrum (Fig. S1C†). The details of XPS spectra are included in the ESI† (Fig. S1). The SnO2NF, PEI-SnO2NF, AuNP, and AuNP/PEI-SnO2NF composites were investigated using UV-vis (Fig. S2A†). The crystal structures of AuNPs, SnO2NFs, and AuNPs/PEI-SnO2NFs (Fig. S2B†) were characterized using XRD. A detailed explanation of UV-vis and XRD spectra is shown in the ESI† (Fig. S2). The elemental analyses of the AuNPs/PEI-SnO2NF (Fig. S3A†) and Ag@ZnONS (Fig. S3B†) composite were performed using EDS. A detailed explanation of EDS diagrams is displayed in the ESI† (Fig. S3).
3.2 Electrochemical and ECL characteristics of the ECL immunosensor
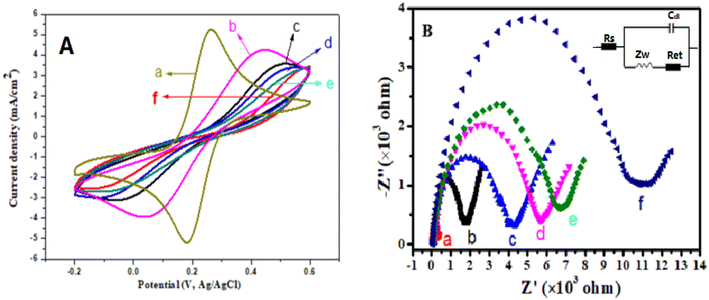
The Ag@ZnONS-modified GCE was used for the sensing platform to fix Ab1, then GCE/Ag@ZnONS/Ab1 was used to capture CA12-5 antigen, and Ab2/AuNP/PEI-SnO2NF signal probe was used to fabricate a sandwich ECL sensor. The modification process of each step for the GCE was researched using CV in 5 mM K3[Fe(CN)6]/K4[Fe(CN)6] including 0.1 M KCl; the working voltage was between −0.2 and 0.6 V. As displayed in Fig. 3A, the unmodified GCE electrode showed a couple of symmetric redox peaks (curve a). After Ag@ZnONSs were covered on the bare electrode (curve b), the redox peak current decreased owing to the low electrical conductivity of ZnONSs. When Ab1 was adsorbed to the GCE/Ag@ZnONS surface, the peak currents further decreased (curve c). This might be because the biomolecules hindered the electron transfer.36 The redox currents were significantly reduced after continuous assembly of the BSA and CA12-5 antigens on the modified electrode, which was due to the hindering effect of insulating protein molecules on the transfer of electrons (curves c and d). In the end, when the GCE/Ag@ZnONSs/Ab1/BSA/CA12-5 reacted with the Ab2/AuNP/PEI-SnO2NF signal probe, the peak current further decreased (curve f). The AuNPs increased the conductivity, but the protein molecules hindered the electronic transmission. The results indicated the successful assembly of the immunosensor.The EIS was used to further prove the stepwise assembly procedure of the ECL sensor. It comprised a linear part and a semicircular part. The linear part was related to the diffusion-limiting procedure, and the semicircular part was related to the electron transfer resistance (Ret). The equivalent circuit from EIS is shown in Fig. 3B (inset), which contains the Warburg impedance (Zw), the resistance of solution (Rs), and the double layer capacitance (Cdl).37Fig. 3B shows the EIS characterization of different modified electrodes. Compared with the bare electrode (curve a), GCE/Ag@ZnONSs showed a big semi-circle, indicating a high Ret (curve b). This was attributed to the low conductivity of ZnONSs. After Ab1 (curve c), BSA (curve d) and CA12-5 antigens (curve e) were modified continuously on the modified GCE, and the diameter of the semi-circle gradually increased. This was due to the presence of the protein layer, which prevented the transfer of electrons.38 Finally, the impedance value further increased when the Ab2/AuNPs/PEI-SnO2NFs were connected to the GCE/Ag@ZnONSs/Ab1/BSA/CA12-5 to construct a sandwich-type ECL sensor (curve f). The EIS results were similar to CV, confirming the successful assembly.
3.3 ECL behavior and electrochemical
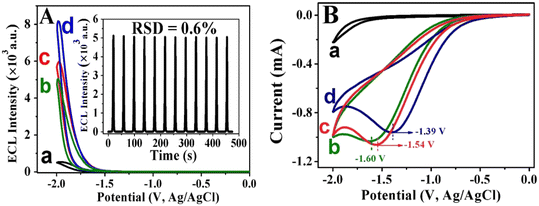
The ECL behavior and electrochemical of AuNPs/PEI-SnO2NFs were investigated. The ECL signal–potential curves (Fig. 4A) and CV waves (Fig. 4B) of the bare electrode, SnO2NF/GCE, PEI-SnO2NF/GCE, and AuNP/PEI-SnO2NF/GCE composites are shown in Fig. 4, which were measured in 0.1 M PBS (pH = 7.4) including K2S2O8 (0.1 M). The bare GCE produced a low ECL signal with a value of 535 a.u. (Fig. 4A, curve a). This was due to the ECL signal of in the O2/S2O82− platform. When the GCE was modified with SnO2NFs detected in the S2O82− solution (curve b), the ECL signal was enhanced significantly to 5046 a.u. Compared with a bare GCE, the ECL signal of SnO2NFs/GCE increased six-fold. In addition, the ECL emissions of GCE/SnO2NFs showed no significant change under 12 successive cyclic potential scans; the relative standard deviation (RSD) was 0.6% with acceptable stability (Fig. 4A, inset). Fig. 4A (curve c) shows that the ECL signal of GCE/PEI-SnO2NFs was better than that of GCE/SnO2NFs, and GCE/PEI-SnO2NFs exhibited more positive reduction potential because the presence of PEI enhanced the water solubility of SnO2NFs. When gold nanoparticles were adsorbed on the PEI-SnO2NFs surface (curve d), the ECL intensity was further enhanced significantly, demonstrating that AuNPs could enhance the conductivity of luminescent materials and quicken the transfer of electrons between SnO2NFs and electrodes, thus increasing the ECL intensity of SnO2NFs.
As seen in Fig. 4B, there were no remarkable redox peaks of the bare electrode (curve a). After SnO2NFs were modified on the bare GCE, a noticeable reduction peak was observed at −1.60 V (curve b). After the PEI was introduced into SnO2NFs, the reduction peak potential of the CV curve (curve c) exhibited a slight positive shift to −1.54 V. Subsequently, the AuNPs/PEI-SnO2NFs showed a more positive potential at about −1.39 V (curve d), the peak current was increased compared with other curve, indicating that the large surface area and good conductivity of AuNPs were beneficial to electron transport.
In this study, SnO2NFs (luminophore) could react with S2O82− (co-reactant). With the cathodic polarization of the potential, SnO2NFs on the electrode acquired an electron and were reduced to anion radical SnO2NFs−˙ [eqn (1)]. S2O82− was reduced to the intermediate of S2O83−˙ [eqn (2)], and the strong oxidant SO4−˙ was obtained via the decomposition of S2O83−˙ [eqn (3)]. Then, SO4−˙ could react with SnO2NFs−˙ to produce the excited state SnO2NFs* [eqn (4)]. Hence, the unstable SnO2NFs* returned to the ground state with obvious light emission [eqn (5)]. In accordance with the literature,26 the ECL emission mechanism of SnO2NFs is expressed as follows.
| SnO2NFs + e− → SnO2NFs−˙ | (1) |
| S2O82− + e− → S2O83−˙ | (2) |
| S2O83−˙ → SO4−˙ + SO42− | (3) |
| SnO2NFs−˙ + SO4−˙ → SnO2NFs* + SO42− | (4) |
| SnO2NFs* → SnO2NFs + hv | (5) |
3.4 Optimization of analytical conditions
Some experiment conditions were optimized, such as the concentration of the co-reactant K2S2O8, pH value, and concentrations of the Ag@ZnONSs and Ab1 to obtain the best ECL emission. The concentration of the K2S2O8 had a great influence on the ECL sensor. As shown in Fig. 5A, the ECL signal gradually increased when the K2S2O8 concentration was between 0.02 M and 0.1 M. When the K2S2O8 concentration was 0.1 M, the ECL intensity was maximal. It was possible that more SO4−˙ was produced with the increase in the K2S2O8 concentration, which promoted the generation of more excited states SnO2NFs*. However, when the K2S2O8 concentration increased to more than 0.1 M, the ECL intensity decreased significantly, which was because excessive S2O82− could generate charge repulsion. Therefore, 0.1 M K2S2O8 was chosen as the best concentration for CA12-5 detection. The influence of pH was optimized to realize the best CA12-5 detection. As shown in Fig. 5B, the ECL signal increased gradually when the pH was increased from 6.0 to 7.4 and reached the maximum ECL intensity at pH 7.4. When the pH increased to more than 7.4, the ECL intensity started to decrease. This was because the protons were reduced readily under acidic conditions, leading to the suppression of the ECL signal. Besides, alkaline conditions could influence the activity of the antibodies and antigens, thus affecting the signal of ECL. Therefore, the ECL detection solution of pH at 7.4 was selected for the detection of CA12-5. The concentration of Ag@ZnONSs for the assembly of the immunosensor was also researched. As shown in Fig. 5C, the ECL signal gradually increased with the increase in the concentration of Ag@ZnONSs and then attained a maximal value at 1.0 mg mL−1. Therefore, the best concentration of Ag@ZnONSs was 1 mg mL−1. In addition, the CA12-5-Ab1 concentration was also optimized. As shown in Fig. 5D, the ECL intensity was the highest when the Ab1 concentration reached 100 μg mL−1, and then gradually tended to stabilize at a higher concentration. The low-concentration Ab1 was insufficient to capture the CA12-5 antigen and Ab2 signal probe, affecting the ECL intensity. As the concentration of Ab1 increased, more immunosensors were conjugated on the electrode. Therefore, the best concentration of the Ab1 was 100 μg mL−1.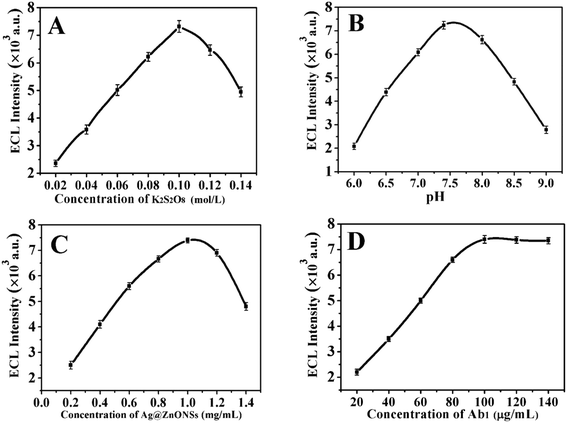 | ||
| Fig. 5 (A) Effect of K2S2O8 concentration, (B) pH of PBS solution, (C) Ag@ZnONSs concentration, and (D) Ab1 concentration on the ECL signal of the sensor toward 1 × 10⁻² ng mL−1 CA12-5. | ||
3.5 Analytical performance
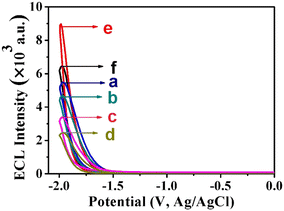
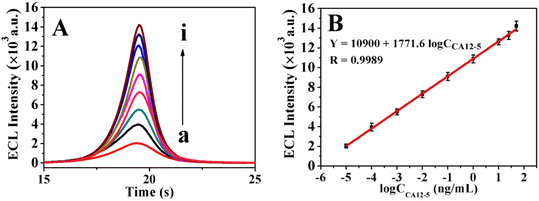
The stepwise fabrication process of the immunosensor was recorded with ECL emission–potential in 0.1 mol L−1 K2S2O8 solution (pH 7.4). As shown in Fig. 6, firstly, the Ag@ZnONSs/GCE exhibited a good ECL emission (curve a), which was ascribed to the excellent conductivity and large specific surface area of Ag@ZnONSs. After successively modified with Ab1 (curve b), BSA (curve c) and CA12-5 antigen (curve d), the corresponding ECL intensity decreased sequentially. When the Ab2/AuNPs/PEI-SnO2NFs were adsorb on the CA12-5/BSA/Ab1/Ag@ZnONSs/GCE, the ECL signal obviously increased (curve e). The ECL intensity of BSA/Ab1/Ag@ZnONSs/GCE without CA12-5 but dipped in Ab2/AuNPs/PEI-SnO2NFs suspension was lower than the intensity of Ab2/AuNPs/PEI-SnO2NFs/CA12-5/BSA/Ab1/Ag@ZnONSs/GCE. However, the intensity of curve f was more than those of curves a, b and c. The change of the ECL signal value of the immunosensor with CA12-5 was remarkable, which demonstrated that the immunosensor exhibited good performance.Under optimal conditions, the developed immunosensor was examined by incubating with different concentrations of the CA12-5 antigen. As shown in Fig. 7A, the ECL responses increased step by step in the CA12-5 concentration range of 1 × 10⁻⁵ to 50 ng mL−1 (curves a–i). The linear relation between the ECL signal (Y) and the logarithmic values of CA12-5 concentrations is plotted in Fig. 7B. The standard curve equation was Y = 10![[thin space (1/6-em)]](https://www.rsc.org/images/entities/char_2009.gif) 900 + 1771.6
900 + 1771.6![[thin space (1/6-em)]](https://www.rsc.org/images/entities/char_2009.gif) log
log![[thin space (1/6-em)]](https://www.rsc.org/images/entities/char_2009.gif) CCA12-5 with a correlation coefficient (R2) of 0.9989. The limit of detection (LOD) was 2.6 fg mL−1 (S/N = 3).
CCA12-5 with a correlation coefficient (R2) of 0.9989. The limit of detection (LOD) was 2.6 fg mL−1 (S/N = 3).
Table 1 provides the comparison of this method with other previously reported various methods for CA12-5 detection.39–44 The proposed ECL immunoassay showed a lower LOD and broader linear range, indicating that the immunosensor had high sensitivity and excellent potential for the trace determination of CA12-5. The high sensitivity of this method was attributed to the following aspects: (1) SnO2NFs had a large specific surface area and excellent conductivity, and hence could be used as both ECL emitters and nanocarriers. The AuNP/PEI-SnO2NF composites displayed stable and strong ECL intensity, which improved the performance of the immunosensor. (2) Ag@ZnONSs with fine conductivity provided a large surface area for loading more Ab1. (3) AuNPs could not only immobilize enough Ab2 but also accelerate the transfer of electrons and increase the sensitivity of the developed ECL immunosensor.
| Method | Linear range | LOD | Reference |
|---|---|---|---|
| CuBTC@MoS2-AuNPs electrochemistry | 0.0005 to 500 U mL−1 | 0.0005 U mL−1 | 39 |
| MOF-808/CNT electrochemistry | 0.001 to 30 ng mL−1 | 0.5 pg mL−1 | 40 |
| AuNPs-PAMAM/CDs FRET | 1 × 10⁻⁶ to 1.0 ng mL−1 | 0.5 fg mL−1 | 41 |
| AgInS2/ZnS NCs ECL | 5 × 10⁻⁶ to 0.005 U mL−1 | 1 × 10⁻⁶ U mL−1 | 42 |
| NIR CdTe/CdS QDs-SiO2 ECL | 0.0001 to 10 U mL−1 | 3.4 × 10⁻⁵ U mL−1 | 43 |
| Met-capped Au–Ag BNCs ECL | 5 × 10⁻⁴ to 1 U mL−1 | 5 × 10⁻⁵ U mL−1 | 44 |
| AuNPs/PEI-SnO2NFs ECL | 1 × 10⁻⁵ to 50 ng mL−1 | 2.6 fg mL−1 | This study |
3.6 Stability, reproducibility, and selectivity of the ECL immunosensor
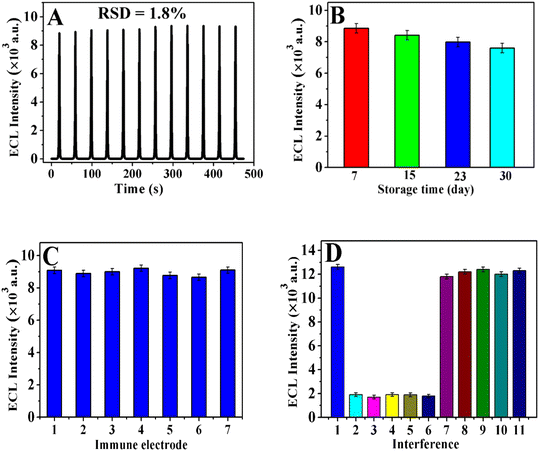
The stability of the immunosensor was studied via testing CA12-5 (0.1 ng mL−1) for 12 cycles of successive CV scanning. As exhibited in Fig. 8A, the ECL signals of the immunosensor displayed no remarkable changes (RSD was 1.8%), manifesting the acceptable stability of the immunosensor. The storage stability of the sensor was also studied via regular inspection of its relative activity. The signal of ECL of the freshly constructed immunosensor was used as the initial value. After storage of 7, 15, 23, and 30 days, the ECL intensity of the immunosensor for the determination of CA12-5 (0.1 ng mL−1) was 97.4%, 92.5%, 87.8%, and 83.6% of the initial intensity of AuNPs/PEI-SnO2NFs, respectively (Fig. 8B). Hence, the immunosensor had long-term stability. The composite material of Ag@ZnONSs and AuNPs/PEI-SnO2NFs had good biocompatibility and provided a good microenvironment for the activity of immobilized antibodies. The results showed that the immunosensor had excellent storage stability.CA12-5 (0.1 ng mL−1) was tested using seven equally immune GCEs under the same conditions to assess the repeatability of the immunosensor. As shown in Fig. 8C, the RSD lower than 2.5% in the ECL signal was obtained, which demonstrated the superior reproducibility of the immunosensors. Besides, selectivity is an important indicator for analyzing biological samples using immunosensors. Some interfering substances were researched, such as alpha-fetoprotein (AFP), PSA, carcinoembryonic antigen (CEA), SCCA, and HCG, to investigate the selectivity of the proposed immunosensor. As shown in Fig. 8D, the signal of ECL of 1 ng mL−1 CA12-5 was well above that of AFP, PSA, CEA, SCCA, and HCG with the same concentration, and the intensity of the interferences was negligible. In addition, the intensity of ECL with a mixture solution [CA12-5 (1 ng mL−1) consisting of AFP (100 ng mL−1), PSA (100 ng mL−1), CEA (100 ng mL−1), SCCA (100 ng mL−1), and HCG (100 ng mL−1)] was nearly similar to the ECL response of CA12-5, demonstrating that the ECL immunosensor had acceptable selectivity and specificity to detect CA12-5.
3.7 Analyses of real samples
The recovery experiments were used for CA12-5 determination in serum samples by the standard addition method to investigate the clinical application potential of the proposed immunosensor. Various concentrations of sample solution were prepared by adding CA12-5 standard solutions to human serum (the Guilin Fifth People's Hospital). Then, the immunosensor was reacted with the aforementioned prepared sample solution. The analytical results are shown in Table 2. The recovery between 99.00% and 104.4% for CA12-5 with an RSD of 2.0–3.5% indicated that the ECL immunosensor had the potential for determining CA12-5 in human serum.| Serum sample | Original (ng mL−1) | Added (ng mL−1) | Found (ng mL−1) | Recovery (%) | RSD (%) | Hospital (chemiluminescence, ng mL−1) |
|---|---|---|---|---|---|---|
| 1 | 0.9200 | 1.000 | 1.910 ± 0.0400 | 99.00 | 2.1 | 0.9600 |
| 2 | 4.730 | 5.000 | 9.950 ± 0.200 | 104.4 | 2.0 | 5.100 |
| 3 | 9.860 | 10.00 | 20.00 ± 0.56 | 101.4 | 2.8 | 9.350 |
| 4 | 25.88 | 20.00 | 46.60 ± 1.63 | 103.6 | 3.5 | 26.40 |
4. Conclusions
This study used AuNPs/PEI-SnO2NFs as labels and Ag@ZnONS-modified electrode as the substrate to construct a sensitive sandwich-type ECL immunosensor with signal enhancement. SnO2NFs had a dual function as both an ECL luminophore and a carrier, simplifying the assembly of immunosensors. PEI-modified SnO2NFs provided a good interface for the loading of AuNPs and Ab2. The AuNP/PEI-SnO2NF nanocomposite showed excellent ECL luminous performance that realized the signal amplification for the SnO2NFs/K2S2O8 system. Ag@ZnONSs were used as the sensing matrix with good conductivity, large specific surface area, and biocompatibility, which could immobilize sufficient Ab1 and improved the sensitivity of immunosensors. The immunosensor displayed excellent selectivity, stability, good reproducibility, high sensitivity, and better detection linear range. The study might have enormous application potential in biological and clinical analyses.Author contributions
Xiangfei Zheng: formal analysis, investigation, data curation, and writing – original draft. Dongmiao Qin: critical revision including writing – review & editing, as well as preparation of the article for publication. Shenglan Hu: validation and data curation. Weiming Mo: writing – review & editing. Biyang Deng: supervision, project administration, and funding acquisition.Conflicts of interest
The authors declare no conflict of interest.Acknowledgements
This study was financially supported by the National Natural Science Foundation of China (22164004) and the Guangxi Science Foundation of China (2022GXNSFDA035069).References
- N. Razmi and M. Hasanzadeh, TrAC, Trends Anal. Chem., 2018, 108, 1–12 CrossRef CAS.
- S. Zhang, Y. Huang, Y. Chen, S. Yan, H. Dai and J. Zhao, Sens. Diagn., 2023, 2, 140–146 RSC.
- L. Farzin, S. Sadjadi, M. Shamsipur, S. Sheibani and M. H. Mousazadeh, Mater. Sci. Eng., C, 2019, 97, 679–687 CrossRef CAS PubMed.
- M. Wu, S. Liu, F. Qi, R. Qiu, J. Feng, X. Ren, S. Rong, H. Ma, D. Chang and H. Pan, Talanta, 2022, 241, 123254 CrossRef CAS PubMed.
- L. Farzin and M. Shamsipur, J. Pharm. Biomed. Anal., 2018, 147, 185–210 CrossRef CAS PubMed.
- C. Zhao, C. Li, M. Li, L. Qian, L. Wang and H. Li, Sens. Actuators, B, 2022, 367, 132063–132072 CrossRef CAS.
- Y. Fan, S. Shi, J. Ma and Y. Guo, Biosens. Bioelectron., 2019, 135, 1–7 CrossRef CAS PubMed.
- L. Wu, Y. Sha, W. Li, S. Wang, Z. Guo, J. Zhou, X. Su and X. Jiang, Sens. Actuators, B, 2016, 226, 62–68 CrossRef CAS.
- S. Hamd-Ghadareh, A. Salimi, F. Fathi and S. Bahrami, Biosens. Bioelectron., 2017, 96, 308–316 CrossRef CAS PubMed.
- M. Chen, R. Han, W. Wang, Y. Li and X. Luo, Anal. Chem., 2021, 93, 13555–13563 CrossRef CAS PubMed.
- M. Wu, S. Liu, F. Qi, R. Qiu, J. Feng, X. Ren, S. Rong, H. Ma, D. Chang and H. Pan, Talanta, 2022, 241, 123254–123260 CrossRef CAS PubMed.
- I. Al-Ogaidi, H. Gou, Z. P. Aguilar, S. Guo, A. K. Melconian, A. K. Al-Kazaz, F. Meng and N. Wu, Chem. Commun., 2014, 50, 1344–1346 RSC.
- X. Ren, H. Wang, D. Wu, D. Fan, Y. Zhang, B. Du and Q. Wei, Talanta, 2015, 144, 535–541 CrossRef CAS PubMed.
- K. Zhang and X. Shen, Analyst, 2013, 138, 1828–1834 RSC.
- G. Mo, X. He, C. Zhou, D. Ya, J. Feng, C. Yu and B. Deng, Biosens. Bioelectron., 2019, 126, 558–564 CrossRef CAS PubMed.
- G. Mo, D. Qin, X. Jiang, X. Zheng, W. Mo and B. Deng, Sens. Actuators, B, 2020, 310, 127852–127859 CrossRef CAS.
- G. Mo, X. He, D. Qin, S. Meng, Y. Wu and B. Deng, Biosens. Bioelectron., 2021, 178, 113024–113031 CrossRef CAS PubMed.
- P. Gai, X. Kong, L. Pu, M. Zhang, D. Zhu and F. Li, Anal. Chem., 2021, 93, 11745–11750 CrossRef CAS PubMed.
- C. Wang, Q. Han, P. Liu, G. Zhang, L. Song, X. Zou and Y. Fu, Anal. Chem., 2021, 93, 12289–12295 CrossRef CAS PubMed.
- J. Cao, L. Zhao, Y. Fu, X. Liu, S. Ren and Y. Liu, Sens. Actuators, B, 2021, 331, 129427–129432 CrossRef CAS.
- X. Wang, Z. Bian, C. Chu, X. Zheng, S. Ge, J. Yu, M. Yan and X. Song, RSC Adv., 2014, 4, 52796–52803 RSC.
- L. Shang, B. Shi, W. Zhang, L. Jia, R. Ma, Q. Xue and H. Wang, Anal. Chem., 2022, 94, 12845–12851 CrossRef CAS PubMed.
- J. Adhikari, M. Rizwan and M. U. Ahmed, Sens. Diagn., 2022, 1, 968–976 RSC.
- C. Yang, Y. Tian, B. Wang, Q. Guo and G. Nie, Sens. Actuators, B, 2021, 338, 129870 CrossRef CAS.
- Y. Lei, Y. Zhuo, M. Guo, Y. Chai and R. Yuan, Anal. Chem., 2020, 92, 2839–2846 CrossRef CAS PubMed.
- M. Jiang, P. Lu, Y. Lei, Y. Chai, R. Yuan and Y. Zhuo, Electrochim. Acta, 2018, 271, 464–471 CrossRef CAS.
- D. Qin, X. Jiang, G. Mo, J. Feng, C. Yu and B. Deng, ACS Sens., 2019, 4, 504–512 CrossRef CAS PubMed.
- M. Y. Kim, H. Park, J. Y. Lee, D. J. Park, J. Y. Lee, N. V. Myung and K. H. Lee, Chem. Eng. J., 2022, 431, 134250–134261 CrossRef CAS.
- D. Qin, S. Meng, Y. Wu, G. Mo and B. Deng, Sens. Actuators, B, 2022, 367, 132176–132185 CrossRef CAS.
- F. Haghayegh, R. Salahandish, M. Hassani and A. Sanati-Nezhad, ACS Appl. Mater. Interfaces, 2022, 14, 10844–10855 CrossRef CAS PubMed.
- H. Li, Y. Wei, Y. Zhang, F. Yin, C. Zhang, G. Wang and Z. Bakenov, Ionics, 2016, 22, 1387–1393 CrossRef CAS.
- Y. Liu, Y. Jiao, Z. Zhang, F. Qu, A. Umar and X. Wu, ACS Appl. Mater. Interfaces, 2014, 6, 2174–2184 CrossRef CAS PubMed.
- L. Zhu, W. Zeng and Y. Li, Mater. Lett., 2018, 228, 331–333 CrossRef CAS.
- S. Pethaperumal and G. T. Mohanraj, Surf. Interfaces, 2022, 30, 101872–101878 CrossRef CAS.
- X. Sun, L. Zhou and W. Zhao, Bioelectrochemistry, 2022, 145, 108104–108110 CrossRef CAS PubMed.
- M. Sentic, M. Milutinovic, F. Kanoufi, D. Manojlovic, S. Arbault and N. Sojic, Chem. Sci., 2014, 5, 2568–2572 RSC.
- C. Yang, Q. Guo, Y. Lu, B. Zhang and G. Nie, Sens. Actuators, B, 2020, 303, 127246 CrossRef CAS.
- H. B. Habtamu, M. Sentic, M. Silvestrini, L. D. Leo, T. Not, S. Arbault, D. Manojlovic, N. Sojic and P. Ugo, Anal. Chem., 2015, 87, 12080–12087 CrossRef CAS PubMed.
- S. Li, C. Hu, C. Hu, C. Chen, J. Zhang, Y. Bai, C. Tan, G. Ni, F. He, W. Li and D. Min, ACS Appl. Bio Mater., 2021, 4, 5494–5502 CrossRef CAS PubMed.
- S. Biswas, Q. Lan, Y. Xie, X. Sun and Y. Wang, ACS Appl. Mater. Interfaces, 2021, 13, 3295–3302 CrossRef CAS PubMed.
- S. Hamd-Ghadareh, A. Salimi, F. Fathi and S. Bahrami, Biosens. Bioelectron., 2017, 96, 308–316 CrossRef CAS PubMed.
- M. Yin, Y. Wang, X. Gao, S. Du, Y. Cheng, S. Yu, G. Zou and F. Xue, Anal. Bioanal. Chem., 2021, 413, 2207–2215 CrossRef CAS PubMed.
- H. Gao, Z. Zhang, Y. Zhang, H. Yu, S. Rong, L. Meng, S. Song, Y. Mei, H. Pan and D. Chang, J. Electroanal. Chem., 2021, 886, 115104 CrossRef CAS.
- L. Fu, X. Gao, S. Dong, H. Hsu and G. Zou, Anal. Chem., 2021, 93, 4909–4915 CrossRef CAS PubMed.
Footnote |
| † Electronic supplementary information (ESI) available. See DOI: https://doi.org/10.1039/d2sd00198e |
| This journal is © The Royal Society of Chemistry 2023 |

