 Open Access Article
Computational modelling of a competitive immunoassay in lateral flow diagnostic devices†
Rohan
Nalumachu‡
,
Anna
Anandita‡
 and
Dharitri
Rath

Department of Chemical Engineering, Indian Institute of Technology, Jammu, Jammu and Kashmir-181221, India. E-mail: dharitri.rath@iitjammu.ac.in
First published on 15th March 2023
Abstract
Competitive immunoassays are important diagnostic assays for the detection of small molecules such as vitamins, minerals, or some hormones. Although these assays are traditionally used to quantify small molecules, they are not extensively integrated with the paper-based devices. Numerical prototyping of these assays would be of paramount importance as it can help prior design of the devices, and therefore can reduce the time and resources needed. In this work, we are the first ones to present a thorough analysis of the computational model of the paper-based competitive immunoassay. The governing physics along with the pertinent boundary conditions coupled with the reactions both at the test line and control lines were considered to model this system. Furthermore, the performance of the device was evaluated through a simpler scaling analysis. Three important non-dimensional parameters were identified as T/C ratio, Pe, and Da to design such paper-based devices, and a design framework was presented to the readers. This opens up avenues for researchers to gain prior knowledge on their device performances.
1. Introduction
Designing affordable and accessible diagnostic devices is an important step towards a sustainable healthcare system in the future. There have been significant efforts in this direction, wherein numerical simulations are of paramount importance as they help reduce the time and resources needed for developing such devices.1 In this context, comprehensive studies on heterogeneous systems have been performed for traditional microfluidic systems,2,3 as well as more recent ones for designing paper-based devices.4 Paper-based devices have garnered more attention as they can be successfully designed into stand-alone, simple, affordable, and point-of-care devices, useful in both remote settings and developed settings where tests can be done sitting at home. While trial-and-error approaches have been largely used to design these devices, recent attempts to understand the mechanistic operations of these devices have been proved to be more beneficial.5 This would eventually help improve the sensitivity of the devices, quantifying disease biomarkers more accurately, as well as carrying out multi-step and multi-analyte reactions. A mechanistic understanding thus helps in developing numerical prototyping before performing actual experiments which in turn helps reduce the investments in designing prototype models.6 For instance, in one of the recent papers, numerical designing of paper network devices has been demonstrated to be suitable for optimization of these devices for carrying out multi-step processes efficiently.7Paper-based devices can be used to design diagnostic assays including immunoassays or nucleic-acid based assays.8 The immunoassays employed include either a sandwich format or a competitive format. The sandwich immunoassay format employs two antibodies that bind to distinct locations on the antigen and is frequently employed in the development of lateral flow devices, which is also the design employed in the most acknowledged paper-based device i.e., “pregnancy kits”. On the other hand, in the case of competitive assays, an antigen molecule and a labelled antigen compete for a limited number of antibody binding sites.9 Competitive assays have been primarily used for the detection of small molecules9 such as the detection of vitamins, minerals, and other small molecules.10 The development of competitive immunoassays on paper-based microfluidic substrates, therefore, would be of particular interest to the development of rapid diagnostic kits for the detection of small molecules.11 However, there are only a few studies reported on competitive assay formats; specifically, a complete numerical prototyping is lacking. In the literature, a few studies include understanding the kinetics of these assays, without demonstrating the details of how these occur in a lateral flow assay format.9,11–15 For instance, Sotnikov et al. reported an analytical model that explains the reaction schemes for sandwich and competitive immunoassays without considering the transport properties.14 They developed a mathematical ICA model to characterize immunological complex development and studied the influence of some of the model parameters, using a general analytical solution. Bishop et al. pointed out the importance of understanding the influence of parameters such as the flow characteristics, surface contacts, receptor–ligand kinetic interactions, and the presence of non-specific binding components while designing competitive immunoassays; however, they did not propose how to model these complexities during device design.16 In contrast, numerical prototyping of sandwich immunoassays using advection–diffusion–reaction models has been elaborated in the literature more extensively.17 Fu et al. compared modelling and experimental assays of a simple two-dimensional (2D) finite element model of convection, diffusion, and binding within a microchannel.15 Furthermore, Gasperino et al. reviewed the mechanistic principles underpinning the operations of lateral flow sandwich immunoassays, thereby describing the pertinent parameters influencing the functioning of these paper-based devices.18 Recently, Sathishkumar et al. reported a similar transport–reaction model for prototyping the commercially available pregnancy kits detailing the sandwich assay format in a lateral flow device, wherein they considered a constant convective velocity across the flow domain.19 Furthermore, there are convection–diffusion–reaction (CDR) models described earlier to predict the signal intensity of sandwich-type lateral flow assays under various design parameters.20,21 However, they did not look into the effect of flow in porous media.
In the current study, we are the first ones to present a complete numerical package of a competitive immunoassay on paper-based lateral flow devices. We integrate the transport and reaction phenomena in these membranes to describe the rate of capture of target analytes in the membrane. In one of the recent articles by one of the authors, the coupling of transport and reactions was already demonstrated to be useful in device design.7 In this article, the model is exclusively designed for quantifying the integration of fluid flow along with that of the transport and reactions simulated in real-time using a Multiphysics numerical package. The flow in the porous paper membranes is taken into consideration.7 The coupled physics describes an integrated approach to designing such devices starting from the delivery of target molecules to the quantification of the signals obtained after they react with the immobilized probe molecules present on the sensor surfaces. Finally, a scaling analysis of the device is done with the use of pertinent non-dimensional parameters, which helps in having an objective design for developers. Based on the above framework, a table guiding potential researchers is presented which can be used to have a prior idea about designing diagnostic devices with increasing sensitivities.
2. Methodology
2.1 Theory
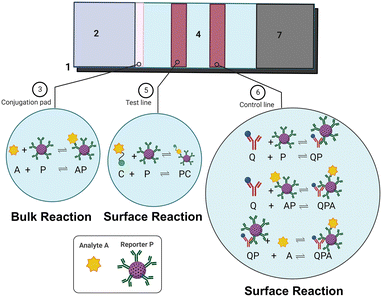
There are two important formats of immunoassays being widely implemented for diagnostic purposes. The first one is known as the sandwich format, wherein the target analytes (or antigens) are sandwiched between two antibody molecules. This is suitable for antigens of larger size (≥10 μm) since they have multiple epitopes to accommodate more than one antibody molecule. The second one is called the competitive immunoassay format wherein a competitor molecule is instead used as the size of the target antigen is very small to accommodate two different types of antibodies on its surface. In designing these kinds of immunoassays, thus there are different biomolecules being used which are either immobilized onto the sensor surfaces or introduced in the solution phase along with the target analyte samples. Sandwich assays are more widely used in commercial paper-based devices including pregnancy kits, and one can refer to the architecture for a more detailed description elsewhere.5 Here, we focus our attention mostly on competitive assays.Fig. 1 depicts the architecture of a competitive immunoassay designed in a lateral flow format. It consists of basic components similar to any lateral flow assay device such as a sample pad, conjugate pad, test membrane and wicking pad. The conjugate pad is functionalized with reporter molecules (P), which in this case, are the primary antibodies conjugated to report nanoparticles (gold NPs in most cases). The sample pad is where a user adds the sample having target analyte (A) molecules. The test line is pre-functionalized with competitive antigen molecules (C) and the control line with secondary antibodies (Q). The reactions which take place on the lateral flow device operated in a competitive format are:
Bulk reaction:
| A + P ↔ AP | (1) |
| C + P ↔ PC | (2) |
| Q + P ↔ QP | (3) |
| Q + AP ↔ QPA | (4) |
| QP + A ↔ QPA | (5) |
In order to simulate the above system, it's important to know the governing physics which involves the flow because of capillary pressure, coupled to the transport of species along with the various reactions as shown in Fig. 1. The governing physics accounts for the capillary flow and transport of species, and calculates the kinetics of both bulk and surface reactions by coupling the flow with transport. Eqn (6) presents the species transport along with the reactions solved for each species.
 | (6) |
 | (7) |
 | (8) |
| Parameters | Notation | Value [units] | Ref. |
|---|---|---|---|
| Forward rate constants for bulk and test line reaction | KBf1, KTf1 | 1.97 × 101 m3 mol−1 s−1 | 23, 25 |
| Forward rate constants for control line reactions | KCf1, KCf2, KCf3 | 1.97 × 101 m3 mol−1 s−1 | 23, 25 |
| Backward rate constants for bulk and test line reaction | KBd1, KTd1 | 1.08 × 10⁻⁴ s−1 | 23, 25 |
| Backward rate constants for control line reactions | KCd1, KCd2, KCd3 | 1.08 × 10⁻⁴ s−1 | 23, 25 |
| Diffusion coefficients of A, P, and AP, respectively | D A, DP, DAP | 1× 10⁻¹⁰ m2 s−1 | 26 |
| Inlet or initial concentrations of P, C, and Q | P in, Cin, Qin | 5 × 10⁻⁵, 4 × 10⁻³, 4 × 10⁻³ mol m−3 | 14, 27 |
| Inlet concentration range of cortisol | A in | 1 × 10⁻⁶ to 5 × 10⁻⁴ mol m−3 | 28, 29 |
| Density of sites available for surface reaction | Λ s | (Cin + Qin) × 0.00125 mol m−2 | |
| Site occupancy number of all surface compounds | Σ © (for surface compounds) | 1 | |
| Porosity | εP | 0.7 | 30 |
| van Genuchten parameters | α, n, l (sample and conjugate pads, a) | 4.3 m−1, 1.41, 0.5 | 1 |
| van Genuchten parameters | α, n, l (working membrane, b) | 1 m−1, 2.33, 0.5 | 1 |
| van Genuchten parameters | α, n, l (wicking pad, c) | 4.3 m−1, 1.41, 0.5 | 1 |
| Hydraulic conductivity (Ks) | K s | a) 2.08 × 10⁻⁵ | 1 |
| b) 5.67 × 10⁻⁶ | |||
| c) 2.08 × 10⁻³ [m s−1] | |||
| Pressure | p 0 | −0.0002 [Pa] | 1 |
| Length of the sample pad | L s | 2 [cm] | |
| Distance from the conjugate pad to the test line and the control line to the wicking pad | Sps | 0.5 [cm] | |
| Length of test and control lines | L th | 1.1 [mm] | |
| Width of the LFIA | T s | 0.125 [cm] | |
| Pressure head | H p | −5.3 [m] | 1 |
| Maximum saturation | θ s | 1 |
2.2 Computational methodology
In order to model the competitive lateral flow immunoassay (LFIA), COMSOL Multiphysics software was used to solve eqn (6) and (8) using ‘the Richards Equation’, ‘the Transport of Diluted Species in Porous Media’, and ‘the Surface Reactions’ interfaces, with pertinent boundary conditions. First, the geometry of the LFIA was specified, and the relevant physics modules were added. For the geometry, we considered three possible cases: (i) a 2D model with uniform thickness, (ii) a 2D model considering thickness variations, and (iii) a 2D model with thickness variation and the presence of overlaps between the different domains. The velocity profiles, and the analyte concentrations for all three cases are compared and presented in ESI† S1 (Fig. S1). Since the model with varying thickness (Table S1†) as well as having the presence of overlaps is the closest possible one resembling commercially available LFIA devices,24 we considered this geometry for further simulations. To get the reaction rates, the kinetics of all the reactions, given in eqn (6), were solved using the Chemistry and Reaction Engineering interfaces from the Chemical Species Transport module. The following initial and boundary conditions were used to solve eqn (6): the initial concentration of competitor molecules on the test line is 5 × 10⁻⁶ mol m−2 (Cin × Ts), and that of the secondary antibodies on the control line is 5 × 10⁻⁶ mol m−2 (Qin × Ts), and the inflow concentration of A (Ain) and P (Pin) is 1 × 10⁻⁶ to 5 × 10⁻⁴ mol m−3 and 5 × 10⁻⁵ mol m−3 respectively. Additionally, at the outlet, an outflow condition (−n·∇Ci = 0) was maintained. Here, the modelling domain is the test membrane, where all the reactions occur. Hence, we have taken the outlet as the end of the test membrane, i.e., the junction where the test membrane meets the wicking pad membrane. The wicking pad has properties that can make it act like an infinite reservoir to store the fluid coming from the test membrane; hence the unreacted species and fluids get stored here. For solving eqn (8), the initial saturation over the entire domain was assumed to be zero, whereas the saturation at the inlet boundary was at its maximum (θs), and a no-flow condition was maintained at all other boundaries of the domain. The above initial and boundary conditions are mentioned in Fig. S2 in ESI† S2. Table 1 provides the parameters used to solve the above set of governing equations with the corresponding references. Among them, the kinetic constants, diffusion coefficients, and concentration of the analyte species were taken from the literature pertaining to the detection of cortisol. Further, the parameters to solve the Richards equation were taken as per the materials to be used in the device, also mentioned in ESI† Table S1.Our model has a few assumptions; however, they do not affect the output signal measured from the device, and hence have been ignored. Our model ignores the effect of evaporation on the flow and transport and the dry storage of the report particles, and it assumes a uniform distribution of analytes in the sample pad. The evaporation effects can be neglected as the sample addition is really fast. The dry storage of the reporter particles in the conjugate pad could not be simulated. Instead, we considered that the report particles were added along with the analytes, i.e., the analytes and the reporters are added simultaneously to the sample pad, which then flow together. The model also ignores the uniform distribution of analytes in the sample pad. This could be a fair assumption as the time taken for uniform saturation of the sample pad is minimal.
2.3 Mesh optimization
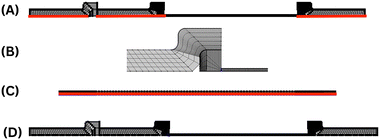
A structured and user-defined mesh operation, namely a mapped mesh, was chosen for the model since the device has a rectangular geometry and thus is best suited as suggested in the COMSOL blog as the LFIA device has multiple components (Fig. 2). Mapped meshes have the capability to generate the best surface meshes.31 Anisotropy was achieved by using distribution nodes to adjust the number and placement of components along edges. The figure illustrates the evolution of mesh distributions for the geometry of the LFIA device in three sections. The first mesh distribution, as shown in Fig. 2A, was created by using a fixed number of 30 elements applied horizontally and 5 elements applied vertically to the sample pad, conjugate pad and wicking pad. The second mesh distribution (Fig. 2B), consisting of a fixed number of 5 elements, was horizontally and vertically applied to the overlaps. For the horizontal axis of the nitrocellulose working membrane, the third mesh distribution (Fig. 2C), comprising a fixed number of 200 elements horizontally and 3 elements vertically, was employed. Fig. 2D illustrates the mesh distribution in the entire LFIA device. A finer mesh size was also utilized for the control and test lines in comparison to the rest of the geometry, with a fixed number of 50 elements for each.2.4 Scaling analysis
Scaling analysis was performed using some important non-dimensional numbers describing the device. Intuitively, graphical or analytical correlations of the signal at the test line would be used to quantify any signal obtained from the interaction of the target analytes on the test line. However, in LFIA devices, the quantification of the target analyte concentration depends on the signal generated at both the test and control lines. Therefore, the literature has reported a non-dimensional number, T/C, which establishes a graphical correlation between the signal or concentration of the test line in relation to the control line.17,21,32,33 We further describe two important non-dimensional numbers in relating the transport and reactions in these devices, which are the Damköhler number (Da) and Peclet number (Pe). These numbers can be obtained by nondimensionalization of the governing equations; thus, they represent the importance of the various factors that contribute to the design of these devices. The genesis of these numbers from the governing species transport equation is shown in ESI† S3. One can describe Pe for any system as: | (9) |
 | (10) |
3. Results and discussion
3.1 Validation of the model
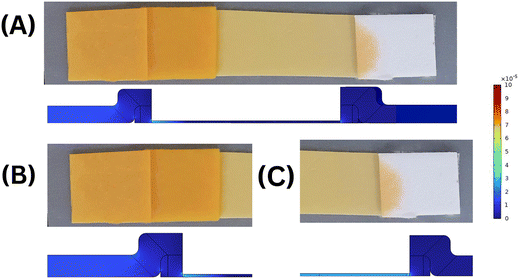
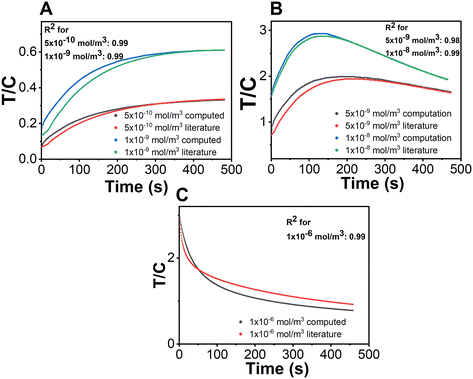
Before simulating the kinetics for the capture of cortisol in a competitive format, it is important to benchmark our model. Since there are no reports of a competitive immunoassay for a lateral flow set-up, we first validated (i) the velocity profile with experimental data, and then (ii) the chemistry with the existing literature. Fig. 3 illustrates the validation of the velocity profile of our COMSOL model with the experimental results. The computational model considered here is a 2D model which considers variable thicknesses as well as overlaps between the different parts of the LFIA device. Here, the velocity profiles for different time steps: (A) 35 s, (B) 65 s and (C) 105 s, were measured using an in-house experimental set-up with a red colour food dye. It was observed that the locations of the fluid front measured via experiments exactly match with that of the computational model. We further validated the chemical reactions of the model using a sandwich assay reported recently in the literature by Sathishkumar et al. for the demonstration of the transport–reaction model.19 The authors further supported their study by experimental measurements with commercially available pregnancy kits. The reaction schemes at the test and control lines were well defined with respect to the detection of the hCG hormone; however in their models, they use a constant convective velocity in the domain. For the purpose of validation, we have taken the exact parameters defined by the authors and modelled it using COMSOL Multiphysics 6.0. The test and control line signals were acquired for three distinct concentration ranges. Fig. 4 illustrates the validation of our COMSOL model against data from the literature. Here, the ratio of the intensity values in the test line to that in the control line (T/C ratio) was obtained for three different concentration ranges i.e., A. low, B. medium, and C. high concentrations.As it can be observed for Fig. 4, there is a small variation between the literature and computed results and this can be attributed to the different numerical techniques used. Hence, the exclusive coefficient of determination (R2) values for each of the reported analyte concentrations were obtained (Fig. 4). The R2 values (regression coefficients) serve as an indication that the COMSOL model closely predicts the behaviour obtained through simulation results in the referenced literature. The regression analysis is as follows:
The R2 value determines how close two sets of values are. If R2 = 1, the simulation results are similar to that in referenced literature. However, some variation may be attributed to the use of different numerical techniques by our group and the authors of the studies. Our COMSOL model could predict the behaviour obtained by their simulation results closely, with evident coefficient of determination (R2, regression coefficient) values of ∼99%, showcasing the similarity. Further, it can be observed that the nature of the T/C ratio varies for the different concentration ranges because of the hook effect, which solely depends on the reactions that take place on the test line of the sandwich immunoassay. A detailed explanation of the behaviour is elaborated in ESI† S4 for the benefit of interested readers. Further, we also show a plot depicting the pattern of the signal formed on the control line for a wide range of analyte concentrations in ESI† S5 which substantiates the importance of test line signals in explaining the hook effect.
3.2 Mesh optimization
We use a finite element modelling software tool, which is quite sensitive to the mesh size. Generating a finer mesh leads to a higher degree of convergence of the obtained results towards their accurate values. However, using a finer mesh computationally becomes expensive, and therefore it is pertinent to have a trade-off between the two. The mesh used for a model geometry dictates factors such as how the geometry is divided based on the shape or element type, size, density, and number of components. In this case, a mapped meshing was used as the geometry was rectangular in shape and varied as per the component of the device. The mesh sizes were varied from 3 elements to 300 elements, and the kinetics for each of the mesh sizes was computed. We choose the user defined mapped mesh in COMSOL Multiphysics 6.0, wherein the element sizes corresponding to a range from 3 to 300 were plotted. Fig. 5 displays the ratio of signals at the test and control lines (T/C ratio) for the corresponding mesh sizes. From the figure, it is shown that the signal intensity increases with the increase in mesh size up to that of the fine meshing of 200 elements in the horizontal of the domain, after which it is hardly affected by increasing the mesh elements. Hence, we decided to use 200 elements for further simulations. This study helped us optimize meshing for our competitive immunoassay model.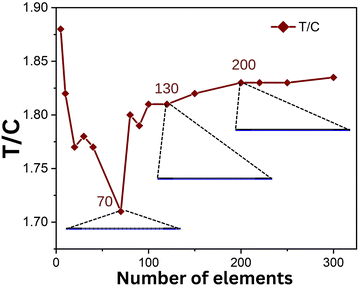 | ||
| Fig. 5 T/C vs. number of elements used for meshing, showing the optimized mesh used for designing the assay. | ||
3.3 Competitive assay results
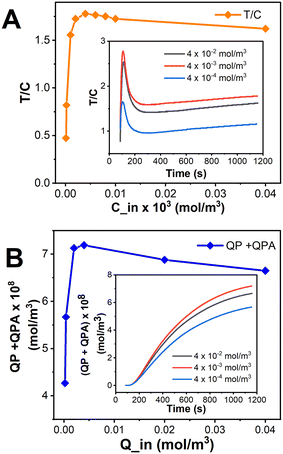
The strength of the resultant signal is affected by a number of parameters, including flow velocity, antigen and competitor concentrations, kinetic constants, etc. In the current study, although the parameters chosen for cortisol were taken from the literature (Table 1), it is difficult to get the exact number of immobilized molecules on the paper substrate. This is attributed to the fact that the immobilization kinetics is highly dependent on the surface properties of the material as well as the type of biomolecule that needs to be immobilized. Hence, we decided to optimize the concentration of biomolecules to be immobilized on the surface of the test line (Cin) as well as the control line (Qin), based on the other parameters from the literature.Theoretically, by increasing the concentration of the competitor molecules, the magnitude of the test line signal should increase, which leads to an increase in the T/C value. But, from Fig. 6A-inset, it's conspicuous that the T/C value is greater for a competitor concentration corresponding to 4 × 10⁻³ (mol m−3) than 4 × 10⁻² (mol m−3), for every time step, which insinuates a greater PC concentration for Cin = 4 × 10⁻³ (mol m−3) as mentioned in Fig. 6A-inset. But, here, the concentration of PC varies in accordance with Le Chatelier's principle: as the concentration of PC increases on the test line, the occurrence of backward reaction increases and results in a lower signal on the test line, indeed lowering the T/C value. And, for Cin = 4 × 10⁻⁴ (mol m−3), as the competitor concentration is relatively low, the PC formed will be lower and so will be the T/C value, as compared to the T/C values corresponding to both Cin = 4 × 10⁻² (mol m−3) and 4 × 10⁻³ (mol m−3). The trend in Fig. 6A validates the above statements and implies Cin = 4 × 10⁻³ (mol m−3) as the suitable competitor concentration for this particular competitive LFIA to show a maximum signal on the test line. From Fig. 6B-inset, we can observe that the control line concentration corresponding to the initial concentration of secondary antibodies Qin = 4 × 10⁻³ (mol m−3) is greater than those corresponding to Qin = 4 × 10⁻⁴ (mol m−3) and even Qin = 4 × 10⁻² (mol m−3), for all time steps. This means that a similar trend to that observed in the change of Cin regarding the test line concentration is observed here corresponding to the control line concentration. The trend in Fig. 6B upholds the above statements and implies Qin = 4 × 10⁻³ (mol m−3) as the suitable competitor concentration for this particular competitive LFIA to show a maximum signal on the control line.
The signal at the test line corresponds to the attachment of reporter molecules with the competitor molecules. The colorimetric signal corresponding to the formation of this complex PC is inversely related to the analyte A concentration, as it is the competitor molecule that gives a signal. The transport–reaction model along with the boundary conditions was solved to obtain the signals at the test and control lines. Fig. 7 illustrates the T/C ratio for various analyte concentrations, obtained with our proposed LFIA device used in this study. Fig. 7A shows a nonlinear behaviour of the signal obtained for the concentration ranges (1 × 10⁻⁶ to 5 × 10⁻⁴ mol m−3) of cortisol considering its presence in clinical samples corresponding to a pathological condition.28,29 Please note that the signal generated would have a contribution from both the test line and control line, wherein the signal generated on the test line would be inversely proportional to the analyte concentration as we are measuring the signal for a competitive assay in this case. The test line and control line signals were obtained separately from COMSOL simulations and plotted for our references in ESI† S7. One important observation for the control line signal graph was that the concentration of QPA + QP on the control line is not significantly affected by varying the concentration of analyte (ESI† S7), since either AP or P is abundant at the control line.3,7,21,32 In accordance with the above design, as observed in Fig. 7A, the signal corresponding to the lowest concentration (1 × 10⁻⁶ mol m−3) has the highest value, and vice versa. The signal intensity reached a maximum value at 250 s for the chosen set of conditions for cortisol detection, after which it decreases to reach the saturation value.
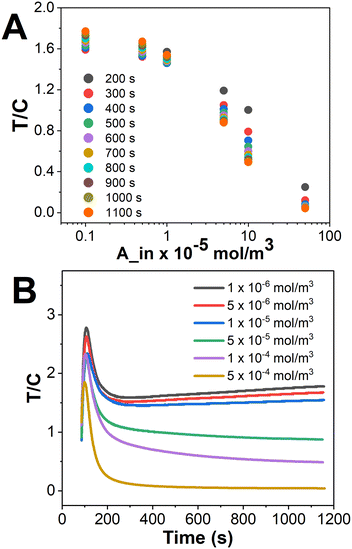 | ||
| Fig. 7 A. T/C vs. analyte concentration for different time steps. B. T/C vs. time for different analyte concentrations (1 × 10⁻⁶ to 5 × 10⁻⁴ mol m−3). | ||
In addition to the above observation, it was interesting to look at the kinetics of the signal intensity at different concentration values, which is presented in Fig. 7B. As shown in the figure, a non-monotonic behaviour is observed in the variation of T/C with time wherein the signal first increases and then decreases, for all the analyte concentrations considered in this work. The signals at the test line come from the formation of PC whereas they come from the formation of both QP and QPA at the control line. Now, let us categorize our concentrations into either low (black, red, blue and green lines in Fig. 7B) or high analyte concentrations (purple and yellow lines in Fig. 7B), as we can see slightly different trends for both these ranges. Now, low concentrations of A in the sample implies a higher concentration of unbound P available for reaction on the test line. As a result, the concentration of PC formed at the test line increases at a faster rate in the initial times till it reaches saturation. Meanwhile, the rate of formation of QPA at the control line occurs at a lower rate because of the following reasons: (a) the concentration of A is low, (b) the availability of unbound P from at the control line is lower as many of them have reacted at the test line itself, and (c) the formation of QP occurs at a lower rate because of a reduction in the concentration of Q due to the formation of QPA. Furthermore, it can be observed in the figure that at higher time (t ≥ 250 s in this case), after the signal reaches saturation, the availability of P on the test line with time decreases at the test line, and increases at the control line; hence the T/C decreases till the control line reaches equilibrium. In summary, though the concentrations of PC and QPA + QP increase, PC forms and saturates more rapidly than any of the control line reactions.
Also, the rate of reduction in the T/C ratio is steeper because the concentration of QPA increases and saturates at a lower rate. Similarly, for a higher analyte concentration where the concentration of unbound P drops, the quantity and rate of formation of PC on the test line is almost negligible, and the rate of formation of QPA increases, and so does the rate of saturation, on the control line. Hence, the T/C profiles for higher analyte concentrations are almost level, as shown in Fig. 7B.
3.4 Parametric studies through scaling analysis
Scaling analysis with the use of different non-dimensional numbers presents a different perspective for the device design under consideration. For example, the change in T/C ratio represents the signal corresponding to the test and control lines. Other than the signal intensity, the various parameters that influence the design of heterogeneous immunosensors may be classified as geometric, molecular, and device efficiency parameters.34 Several such parameters, like the rate of antibody binding,15 IC50 (inflection point on concentration dependence),14 normalized concentration,35 and relative analytical signals36 are listed in various studies to help comprehend the impact on total capture. However, in the current study, we use an alternative strategy through scaling analysis to significantly decrease the sample space by employing non-dimensional numbers to present the parametric variations.37 For this purpose, we chose the Peclet number (Pe) and Damköhler number (Da), which are relevant here.Pe indicates the relative importance of convection and diffusion. In this study, we calculated the spatiotemporal variation of the convective velocity using the Richards equation. It is feasible to do so as the material properties such as the porosity, pore-size distribution, and hydraulic conductivity are known for different parts of the device. On the other hand, diffusion is a molecular phenomenon which is dependent on the physicochemical properties of the antigen and the solvent, including the radius of the antigen particle, viscosity, medium temperature, and the material from which the device is manufactured. Pe was thus calculated by substituting the average value of velocity throughout the timeline when the sample resides in the working membrane (t = 100–300 seconds), the characteristic length, and the diffusion coefficient in eqn (9).
Fig. 8 presents the non-dimensional signal intensity (T/C ratio) with the variation of Pe, for an inlet analyte concentration (Ain) of 10−6 mol m−3. Theoretically, the concentration signals corresponding to the test and control lines should decrease with an increase in Pe, as an increasing Pe corresponds to either an increase in convective velocity, or a decrease in species diffusivity. This may lead to the fact that the reactants do not get sufficient time to react before they flow past the reaction zone, which is the test line or the control line. Consequently, we will get a lower capture of the analytes, lowering the signal intensity. Fig. 8A–C exactly depict the same observation when we plot the corresponding signal concentrations at the test line, and control line for Pe varying from 5 × 10⁻³ to 5.5 × 10⁷. These plots were obtained for different Pe regimes, corresponding to the dominance of diffusion or convection. Firstly, considering a diffusion dominant regime (Pe < 300), as Fig. 8A shows, the decrease in control line concentration is greater in comparison to that of concentration on the test line. This could be attributed to the fact that the signal at the control line requires the diffusion of all three molecules where A, P, and AP have to concentrate on the control line to form a signal, as opposed to the test line which needs the availability of P alone. Hence, we plot the T/C ratios for this Pe range, and as shown in Fig. 8D, we observe a monotonic increase in the signal. As shown in Fig. 8B, the slope of concentration on the test line is steeper in comparison to that of concentration on the control line. As the sample velocities are low, the concentrations on the test and control lines depend on the reaction kinetics at the corresponding locations, i.e., the rate of PC and PQ + QPA formation on the test and control lines, respectively. Thus, the varied rates of reaction are portrayed in Fig. 8B. Next, we observe a non-monotonic variation of T/C with an increase in Pe (300 < Pe < 5.5 × 10⁷) as shown in Fig. 8E. Here, it can be observed that there is a sudden decrease in the T/C signal corresponding to Pe = 275. This is attributed to the fact that at this value of Pe, there is a transition from a diffusion dominant to a convection dominant regime. As the sample velocities are low (550 ≤ Pe < 5.5 × 10⁴), the concentrations on the test and control lines depend on the reaction kinetics at the corresponding locations, i.e., the rate of PC and PQ + QPA formation on the test and control lines, respectively. Thus, the varied rates of reaction are portrayed in Fig. 8B. Therefore, Fig. 8E demonstrates that the range of 550 ≤ Pe < 5.5 × 10⁴ led to a decrease in T/C. Considering Pe ≥ 5.5 × 10⁴, approximately the same slopes were obtained for the test and control line signals, as shown in Fig. 8C, which is explained by the non-dependence on reaction rates. The observed effect of Pe ≥ 5.5 × 10⁴ is an increase in T/C, which correlates positively with an increase in Pe. This relationship is depicted in Fig. 8E as a linear slope with an angle of approximately 45 degrees. Hence, showing a non-monotonic behaviour of T/C with varying Pe (operated convective dominant regime), and raising a rather inquisitive nature for variation between rate of convection and reaction. Therefore, the Damköhler number (Da) is used to explicitly portray the relevance of kinetics to the signal (T/C).
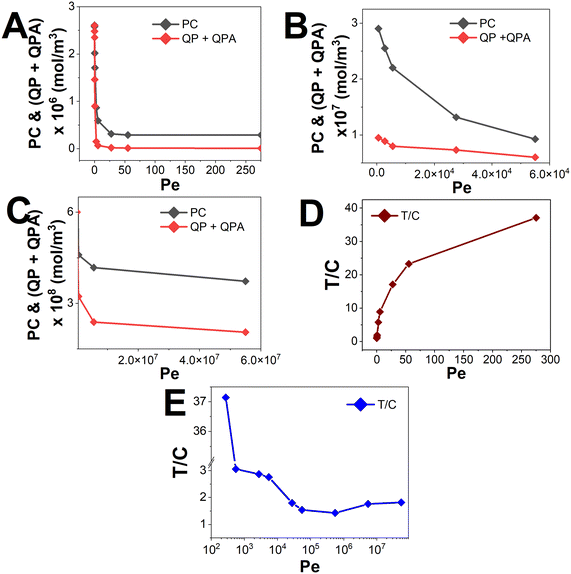 | ||
| Fig. 8 Signal intensities on the test line (P), and control line (QP + QPA) vs. Pe for A. Pe < 10, B. 10 ≤ Pe < 1000, and C. Pe ≥ 1000. T/C ratio vs. Pe for D. Pe < 10 and E. Pe ≥ 10. While computing, the LFIA analyte concentration is taken as 10−6 mol m−3, and the saturated values of concentration on the test and control lines and the T/C ratio are plotted. The calculations specific to this device detecting cortisol are given in ESI† S1. | ||
The Damköhler number (Da) is an essential consideration for any system wherein contributions from both transport and reactions are important. Da compares the rates of flow and reaction kinetics and Da is calculated using eqn (10). Fig. 9 depicts the variation of T/C with respect to Da. For higher Da (Da = 600), the kinetics dominate over the transport. Therefore, the signal becomes transport limited. For values of Da < 600, T/C is dependent on the convection. Hence in this regime, as Da increases, say from 15 to 300, the convective velocity decreases, leaving more time for the reaction to happen. As a result, as presented in Fig. 9A illustrates an increase in signal on the test line. However, the faster reaction rate at the test line leads to a higher rate of consumption of reporter particles P, leaving less of them that reach the control line. This explains the decrease in the signal at the control line shown in Fig. 9B. Therefore, the combined effect is reflected in Fig. 9C for an increase in Da (for Da < 500). Now, we consider the regime for which Da > 600. Theoretically, an increase in Da implies an increase in reaction kinetics, which thereby should increase the test line concentration and indeed the T/C value. However, this is not the trend we obtain in Fig. 9A–C. The anomaly could be explained using the Le Chatelier's principle. An increase in the forward kinetics of reaction on the test line (bubble 2 in Fig. 1) results in an increase in the concentration of PC, thereby increasing the occurrence of backward reaction and lowering the signal on the test line, and lowering the value of T/C. However, Fig. 9B shows that the signal at the control line is not affected much with the reversibility as the consumption of P depends on three simultaneous reactions. Further, Fig. 9C shows the combined effect from Fig. 9A and B, wherein the T/C ratio happens to decrease when Da is increased (for Da ≥ 600).
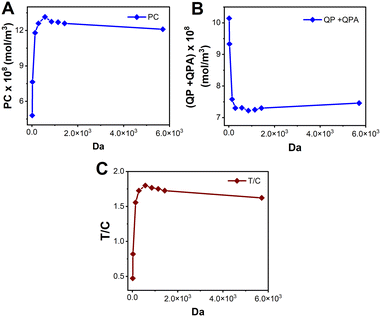 | ||
| Fig. 9 Signal intensities on the A. test line (P) and B. control line (QP + QPA) vs. Da. C. T/C vs. Da for 0.01 ≤ Da ≤ 100. | ||
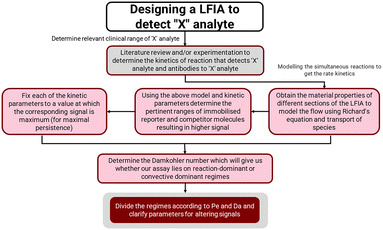
The pertinent input and output parameters that would guide researchers to design any such lateral flow based competitive immunoassay platform are hence summarised in Fig. 10. Briefly, the design of such types of immunoassays includes first selecting the input parameters starting with choosing the right kinetics pertinent to the reactions, then obtaining the material and transport properties to solve the flow and transport equations, and finally, the use of scaling analysis to obtain the regime of operations and a decision on the final output parameters.
4. Conclusions
Competitive immunoassays in lateral flow design formats are useful in designing point-of-care devices for the detection of various biomarkers such as vitamins, minerals, or stress hormones such as cortisol. However, the device design largely depends on trial-and-error experiments, which are time consuming and tedious. For this purpose, numerical prototyping of such devices is really of paramount importance. In the current study, we described a detailed transport and reaction model to design any such competitive immunoassay on a LFIA device. Our model has a few assumptions; however, they do not significantly affect the signal intensity. The reactions are described at the test line and control line respectively along with the contributions from other transport parameters. The material selection can also be optimized using this model, as we couple the Richards equation describing the flow pattern in these paper-based devices. Furthermore, a scaling analysis was presented using three non-dimensional parameters, namely the T/C ratio, Da and Pe to reduce the parametric spaces used to describe the design of such devices. The T/C ratio is used as the output parameter to describe the device performance, whereas Pe and Da are the parameters used to describe the better design of these devices. Having prior information about these two parameters, one can first design the LFIA, before experimentally fabricating them in the research lab. A guiding principle to design such a device is finally presented in Fig. 10. The numerical tools described in this work open up many avenues to design diagnostic devices with the use of minimal resources and time, and thus are expected to expedite the production of such devices.Author contributions
RN contributed towards the data acquisition, analysis, and write-up; AA contributed to investigation, data analysis, critical analysis, and write-up; DR contributed to the overall conceptualization, write-up, manuscript reviewing, editing, and funding acquisition.Conflicts of interest
There are no conflicts to declare.Acknowledgements
We acknowldege the generous support from IIT Jammu for carrying out this work in the form of Seed Grant Number: SGT-100048.References
- D. Rath, N. Sathishkumar and B. J. Toley, Langmuir, 2018, 34, 8758–8766 CrossRef CAS PubMed.
- T. M. Squires and S. R. Quake, Rev. Mod. Phys., 2005, 77, 977–1026 CrossRef CAS.
- T. M. Squires, R. J. Messinger and S. R. Manalis, Nat. Biotechnol., 2008, 26, 417–426 CrossRef CAS PubMed.
- S. Nishat, A. T. Jafry, A. W. Martinez and F. R. Awan, Sens. Actuators, B, 2021, 336, 129681 CrossRef CAS.
- N. Sathishkumar and B. J. Toley, Sens. Actuators, B, 2020, 324, 128756 CrossRef CAS.
- F. Schaumburg, P. A. Kler and C. L. A. Berli, Sens. Actuators, B, 2018, 259, 1099–1107 CrossRef CAS.
- D. Rath and B. J. Toley, ACS Sens., 2021, 6, 91–99 CrossRef CAS PubMed.
- H. v. Hsieh, J. L. Dantzler and B. H. Weigl, Diagnostics, 2017, 7, 29 CrossRef CAS PubMed.
- X. Wang, L. Cohen, J. Wang and D. R. Walt, J. Am. Chem. Soc., 2018, 140, 18132–18139 CrossRef CAS PubMed.
- S. Lee, V. Oncescu, M. Mancuso, S. Mehta and D. Erickson, Lab Chip, 2014, 14, 1437–1442 RSC.
- L. S. A. Busa, S. Mohammadi, M. Maeki, A. Ishida, H. Tani and M. Tokeshi, Analyst, 2016, 141, 6598–6603 RSC.
- S. Qian and H. H. Bau, Anal. Biochem., 2004, 326, 211–224 CrossRef CAS PubMed.
- T. Komatsu, Y. Sato, M. Maeki, A. Ishida, H. Tani and M. Tokeshi, Anal. Chim. Acta, 2021, 1144, 85–95 CrossRef CAS PubMed.
- D. V. Sotnikov, N. A. Byzova, E. A. Zvereva, A. V. Bartosh, A. V. Zherdev and B. B. Dzantiev, Biochem. Eng. J., 2020, 164, 107763 CrossRef CAS.
- E. Fu, K. E. Nelson, S. A. Ramsey, J. O. Foley, K. Helton and P. Yager, Anal. Chem., 2009, 81, 3407–3413 CrossRef CAS PubMed.
- J. D. Bishop, H. v. Hsieh, D. J. Gasperino and B. H. Weigl, Lab Chip, 2019, 19, 2486–2499 RSC.
- C. L. A. Berli and P. A. Kler, Microfluid. Nanofluid., 2016, 20, 1–9 CrossRef CAS.
- D. Gasperino, T. Baughman, H. V. Hsieh, D. Bell and B. H. Weigl, Annu. Rev. Anal. Chem., 2018, 11, 219–244 CrossRef PubMed.
- N. Sathishkumar and B. J. Toley, Sens. Actuators, B, 2020, 324, 128756 CrossRef CAS.
- Z. Liu, X. He, A. Li, Z. Qu and F. Xu, Analyst, 2019, 144, 5394–5403 RSC.
- S. Qian and H. H. Bau, Anal. Biochem., 2003, 322, 89–98 CrossRef CAS PubMed.
- Physiology, Cortisol – StatPearls − NCBI Bookshelf, https://www.ncbi.nlm.nih.gov/books/NBK538239/, (accessed 18 May, 2022) Search PubMed.
- D. O. Dormeshkin, O. S. Kuprienko, A. v. Svirid, A. A. Gilep, O. v. Sviridov and S. A. Usanov, Russ. J. Bioorg. Chem., 2016, 42, 22–28 CrossRef CAS.
- M. A. Mansfield, Design Considerations for Lateral Flow Test Strips, EMD Millipore, https://www.emdmillipore.com/INTERSHOP/static/WFS/Merck-Site/-/Merck/en_US/Freestyle/DIV-Divisional/Events/pdfs/lateral-flow-presentations/design-considerations-for-lateral-flow-test-strips.pdf, (accessed 27 May 2022) Search PubMed.
- Y. Tahara, Z. Huang, T. Kiritoshi, T. Onodera and K. Toko, Front. Bioeng. Biotechnol., 2014, 2, 15 Search PubMed.
- M. Gordic, Theoretical Modeling of Cortisol Sensor, M. S. Thesis, University of South Florida, 2008 Search PubMed.
- F. di Nardo, S. Cavalera, C. Baggiani, C. Giovannoli and L. Anfossi, ACS Appl. Mater. Interfaces, 2019, 11, 32758–32768 CrossRef CAS PubMed.
- M. Zangheri, L. Cevenini, L. Anfossi, C. Baggiani, P. Simoni, F. di Nardo and A. Roda, Biosens. Bioelectron., 2015, 64, 63–68 CrossRef CAS PubMed.
- E. Panfilova, Biosensors, 2021, 11, 146 CrossRef CAS PubMed.
- A. L. Ahmad, S. C. Low, S. R. Abd Shukor, A. Ismail and A. R. Sunarti, Desalin. Water Treat., 2009, 5, 99–105 CrossRef CAS.
- Best Practices for Meshing Domains with Different Size Settings|COMSOL Blog, https://www.comsol.com/blogs/best-practices-for-meshing-domains-with-different-size-settings/, (accessed 24 May, 2022).
- E. G. Rey, D. O'Dell, S. Mehta and D. Erickson, Anal. Chem., 2017, 89, 5095–5100 CrossRef CAS PubMed.
- K. M. Park, D. J. Chung, M. Choi, T. Kang and J. Jeong, Nano Convergence, 2019, 6, 1–6 CrossRef CAS PubMed.
- S. Sathish and A. Q. Shen, JACS Au, 2021, 1, 1815–1833 CrossRef CAS PubMed.
- N. H. Chiem and D. J. Harrison, Clin. Chem., 1998, 44, 591–598 CrossRef CAS.
- E. Takács, B. Gémes, F. Szendrei, C. Keszei, A. Barócsi, S. Lenk, L. Domján, M. Mörtl and A. Székács, Molecules, 2022, 27, 6514 CrossRef PubMed.
- H. H. El-badrawi, E. S. Hafez, M. Fayad and A. Shafeek, Contracept. Delivery Syst., 1980, 1, 103–111 CAS.
Footnotes |
| † Electronic supplementary information (ESI) available. See DOI: https://doi.org/10.1039/d2sd00211f |
| ‡ Equal contribution by the authors. |
| This journal is © The Royal Society of Chemistry 2023 |

