 Open Access Article
Creative Commons Attribution 3.0 Unported Licence
Tetraphenylethene-capped aminobenzopyranoxanthene hydrazone probes for colorimetric recognition of Hg2+ and fluorescent sensing of HCl gas†
Yang
Yang
 *ab,
Chang
Pei
a,
Chao-Ying
Gao
a and
Jinglin
Liu
*ab
aCollege of Chemistry and Materials Science, Inner Mongolia Minzu University, Tongliao 028043, PR China. E-mail: yangyang-000@163.com; jlliu@vip.163.com
bInner Mongolia Key Laboratory for the Natural Products Chemistry and Functional Molecular Synthesis, Tongliao 028043, PR China
First published on 16th May 2023
Abstract
Two sensing molecules, A-T1 and A-T2 with bichromophore were synthesized by linking different numbers of TPE units to a xanthene platform (ABPX). There was a big difference in symmetry and sensing features between the two molecules. The asymmetric molecule A-T1 has hydrazide and TPE-capped hydrazone ligands, while the symmetric molecule A-T2 with two TPE units showed brighter AIE fluorescence in solid state and aqueous solution. In heavy metal ion analysis, A-T1 showed obvious absorption increase centered at 499 and 533 nm in the presence of Hg2+, and the color changed to pink; A-T2 showed weak response to Cu2+ due to the steric hindrance of TPE. The Job's Plot and ESI-MS results indicated that a 1![[thin space (1/6-em)]](https://www.rsc.org/images/entities/char_2009.gif) :
:![[thin space (1/6-em)]](https://www.rsc.org/images/entities/char_2009.gif) 1 ligand–metal complex was formed between the A-T1 hydrazide site and Hg2+, and Cu2+ can coordinate with the TPE-capped hydrazone site. Furthermore, A-T1 powder could respond to HCl gas via the spiro-opening process, and this can be restored by NH3. The 1H NMR chemical shifts of the xanthene at 6.16 to 6.56 ppm vanished and reappeared, demonstrating the protonation of diethylamine groups by HCl gas. These probes could be applied as fluorescence indicators in vivo imaging with high resolution.
1 ligand–metal complex was formed between the A-T1 hydrazide site and Hg2+, and Cu2+ can coordinate with the TPE-capped hydrazone site. Furthermore, A-T1 powder could respond to HCl gas via the spiro-opening process, and this can be restored by NH3. The 1H NMR chemical shifts of the xanthene at 6.16 to 6.56 ppm vanished and reappeared, demonstrating the protonation of diethylamine groups by HCl gas. These probes could be applied as fluorescence indicators in vivo imaging with high resolution.
1. Introduction
Xanthene is a compound in which the middle carbon of anthracene is replaced by an oxygen or nitrogen atom. Its derivatives have exhibited excellent biological activities and optical properties, and they are widely used in printing, luminescent devices, photocatalysts and bio-markers.1–3 Fluorescein and rhodamine are two classic dyes of the xanthene family that can be prepared by condensation of phthalic anhydride with phenolic derivatives. When their structures are modified or conjugated with other aromatic or heterocyclic rings, the planar structure will be expanded. This strategy will induce the absorption and fluorescence of the dye to effectively red-shift from the visible to infrared region.4–6 If two xanthene molecules are fused together in the transversal,7–9 the vertical,10 or the diagonal mode,11,12 three aminobenzopyranoxanthene (ABPX) isomers are constructed with two spirolactone rings. Compared to a single spirolactone molecule (rhodamine), they may have multispectral response capability towards external stimuli.13,14Unlike most traditional chromophores, the luminogens with the aggregation-induced emission (AIE) feature can light up when the water fraction of the organic solution increases.15,16 This anomaly has drawn great attention and been extensively researched. The development of AIE materials is active, and they are crucial in light emitting devices, biological diagnostics and therapies.17,18 As one of the classical and simplest AIE members, tetraphenylethene (TPE) can be used as a fluorophore in designing AIE chemosensors.19,20 Additionally, it can be easily introduced into traditional dyes and fluorescent materials via cross-coupling and condensation reactions.21,22 A series of AIE-based molecules were obtained by introducing TPE units into the xanthene platform, and they were applied in the chemosensing of metal ions, acid gas and amino acid or as fluorescent switches.23–25
In the designing of bichromophore sensing materials, the symmetric structure can effectively enhance the recognition sensitivity and detection range, which is beneficial in the separation of harmful analytes.26,27 When the molecules are asymmetric, various functional groups can be assigned to the sensing platform, and this structure can realize the multi-channel response to analytes in developing logic gates and chemical encryption materials.28,29 In this work, two novel bichromophore molecules, A-T1 and A-T2, with AIE properties were constructed by combination of ABPX and TPE. Both of them have π-extended xanthene structures; the two TPE-capped symmetric molecule A-T2 exhibited a higher fluorescence quantum yield than the asymmetric molecule A-T1, which enabled A-T2 to emit stronger fluorescence. The discrepancy of spatial structure led to the change of their sensing behaviors with different analytes. A-T1 exhibited colorimetric and spectral response to Hg2+ and HCl gas, while A-T2 showed weak response to Cu2+. They can be applied to in vivo imaging of plants and zebrafish.
2. Experimental section
2.1 Apparatus
1H and 13C NMR (CDCl3) spectra were recorded on Bruker AV-500 spectrometers with tetramethylsilane (TMS) as the internal standard. IR spectra were recorded with a SHIMADZU IR Tracer-100 spectrophotometer. ESI-MS spectra were recorded on a Thermo Fisher UHPLC-QE Focus orbitrap mass spectrometer system. The fluorescence spectra were recorded on a JASCO FP-6500 fluorescence spectrophotometer. The UV-Vis spectra were recorded on a PGeneral TU-1901 spectrophotometer. The nanoparticle size was measured by a Nanobrook 90plus Zeta. The fluorescence imaging experiments were conducted on an Olympus IX73DP80 fluorescence microscope. The lab water purification system was purchased from Beijing Xiang Shun Yuan Technology Co., LTD.2.2 Reagents
All reagents were purchased from commercial suppliers and used without further purification. Solvents for chemical synthesis and analysis were purified according to standard procedures. The solutions of metal ions were prepared from their nitrate salts: Al(NO3)3, Fe(NO3)3, Co(NO3)2, Ni(NO3)2, Cu(NO3)2, Zn(NO3)2, Cd(NO3)2, Hg(NO3)2, Pb(NO3)2, and AgNO3, and sulfate salts: Fe(NH4)2(SO4)2. And the solution of sulfide ions was prepared from Na2S. Ultrapure water was provided by a lab water purification system.2.3 Synthesis of A-T
The intermediates aminobenzopyranoxanthene hydrazide (ABPX-hy) and 4-(1,2,2-triphenylvinyl)benzaldehyde (TPE-CHO) were prepared by previously described methods.30,31 The chemosensors ABPX-TPE1 (A-T1) and ABPX-TPE2 (A-T2) shown in Scheme 1 were synthesized by condensation of ABPX-hy and 4-(1,2,2-triphenylvinyl)benzaldehyde. The synthesis steps were as follows:![[thin space (1/6-em)]](https://www.rsc.org/images/entities/char_2009.gif) :
:![[thin space (1/6-em)]](https://www.rsc.org/images/entities/char_2009.gif) 1, v/v) to obtain a yellowish solid. Yield: 46%; 1H NMR (500 MHz, CDCl3) δ 8.72 (s, 1H), 7.80 (dd, J = 28.8, 7.0 Hz, 2H), 7.42 (s, 2H), 7.14 (d, J = 7.9 Hz, 3H), 7.12–6.89 (m, 18H), 6.85 (t, J = 7.4 Hz, 2H), 6.67 (d, J = 7.4 Hz, 1H), 6.56–6.38 (m, 3H), 6.38–6.15 (m, 3H), 5.98 (s, 1H), 3.48 (s, 2H), 3.32 (m, 8H), 1.23–1.05 (t, 12H); 13C NMR (125 MHz, CDCl3) δ 166.24, 164.79, 153.59, 153.25, 152.87, 152.61, 150.49, 150.18, 149.81, 148.98, 145.62, 143.52, 141.56, 140.42, 133.28, 132.91, 131.25, 129.54, 128.78, 128.76, 127.53, 126.71, 123.98, 123.54, 123.04, 117.36, 108.41, 106.46, 104.51, 98.05, 65.86, 65.26, 44.38, 12.61; IR (KBr), ν, cm−1: 2968, 2922, 1702, 1619, 1570, 1494, 1428, 1305, 1219, 1080, 702; ESI-MS: m/z = 1037.259.
1, v/v) to obtain a yellowish solid. Yield: 46%; 1H NMR (500 MHz, CDCl3) δ 8.72 (s, 1H), 7.80 (dd, J = 28.8, 7.0 Hz, 2H), 7.42 (s, 2H), 7.14 (d, J = 7.9 Hz, 3H), 7.12–6.89 (m, 18H), 6.85 (t, J = 7.4 Hz, 2H), 6.67 (d, J = 7.4 Hz, 1H), 6.56–6.38 (m, 3H), 6.38–6.15 (m, 3H), 5.98 (s, 1H), 3.48 (s, 2H), 3.32 (m, 8H), 1.23–1.05 (t, 12H); 13C NMR (125 MHz, CDCl3) δ 166.24, 164.79, 153.59, 153.25, 152.87, 152.61, 150.49, 150.18, 149.81, 148.98, 145.62, 143.52, 141.56, 140.42, 133.28, 132.91, 131.25, 129.54, 128.78, 128.76, 127.53, 126.71, 123.98, 123.54, 123.04, 117.36, 108.41, 106.46, 104.51, 98.05, 65.86, 65.26, 44.38, 12.61; IR (KBr), ν, cm−1: 2968, 2922, 1702, 1619, 1570, 1494, 1428, 1305, 1219, 1080, 702; ESI-MS: m/z = 1037.259.
2.4 Measurements
The stock solutions (0.1 mM, A-T1 and A-T2) were prepared by dissolving the requisite amount in EtOH and diluted to 10 μM EtOH solution for the test. Metal ion solutions (Al3+, Fe2+, Fe3+, Co2+, Ni2+, Cu2+, Zn2+, Cd2+, Hg2+, Pb2+, and Ag+) and S2− were prepared in water (10−2 M). The probe solution was pipetted at 3.0 mL each time and 30 μL of the metal ions was injected into the solution. The UV-Vis absorption analysis was carried out after mixing the samples for 3 minutes.The powder fluorescence analysis of A-T1 and A-T2 was performed by pressing the powder onto quartz glass directly. The prepared sample plates were laid flat at the bottom of a 150 mL beaker that was covered with a culture dish. The sample was kept in 500 ppm HCl vapor for 2 h before the fluorescence test. After that, NH3 vapor (500 ppm) was employed to neutralize the acid treated sample.
2.5 Mung bean sprout culture
At room temperature of 25–30 °C, mung beans were successfully cultured in a humid environment for 48 h, and then the sprouts were incubated with the two probe solutions for 0.5 h. After that, the sprouts were washed with PBS twice to remove the surface probe, and finally we performed fluorescence imaging of the sliced cotyledons.2.6 Live fish culture
Zebrafish embryos were cultivated in Ringer's solution (5 mL) with A-T1 and A-T2 aqueous solutions (10 μM, 50 μL) for 48 h. After that, the zebrafish was washed with PBS twice to remove the surface probe and imaged using fluorescence microscopy. All experiments were approved by the Animal Experimentation Ethics Committee at the Inner Mongolia University for Nationalities (permission number: IMUN20190301).3. Results and discussion
3.1 The AIE feature of A-T1 and A-T2 in EtOH
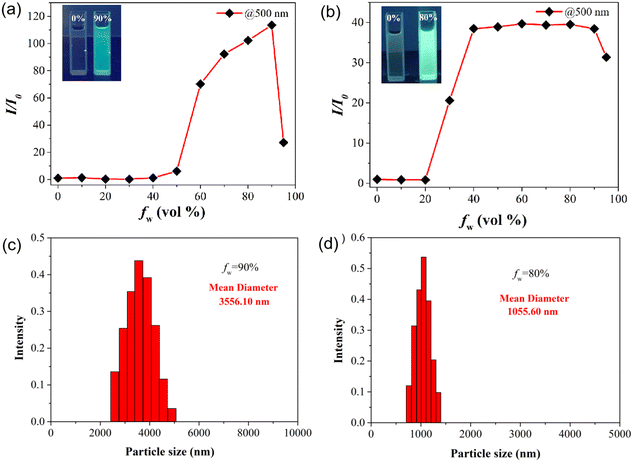
The bonding of the TPE group onto the ABPX structure may endow these probes with a certain AIE behavior. The fluorescence of A-T1 and A-T2 solutions was investigated in EtOH with different water ratios (Fig. S1†). As shown in Fig. 1a, A-T1 exhibited obvious fluorescence enhancement when the water fraction (fw) was more than 40%, and the intensity reached its maximum when fw was 90%. The relative fluorescence intensity was 120 times that in the original solution (500 nm), and the fluorescence quantum yield (ΦF) was calculated to be 0.29. Interestingly, when fw was more than 20%, the intensity of A-T2 increased rapidly and reached its maximum at 40%, and it remained constant until 90% (Fig. 1b). Under the same conditions, the fluorescence of A-T2 was brighter than that of A-T1, and the ΦF was 0.33. Such fluorescence enhancements for A-T1 and A-T2 may be attributed to their hydrophobicity, which was caused by nanoscale aggregation. The dynamic light scattering (DLS) results confirmed that the average particle size of A-T1 and A-T2 was 3556 nm and 1055 nm, respectively (Fig. 1c and d). In the aggregation system, A-T2 has more luminous particles per unit than A-T1, and the fluorescence is stronger. The introduction of TPE into the xanthene structure is a feasible option to increase the AIE properties of the sensing molecules.The structure and stereochemistry of A-T2 were established by X-ray single-crystal analysis.32 The crystal structure of A-T2 is a highly symmetric molecule with two TPE arms vertical to ABPX (Fig. S2†). The planar length of ABPX is about 17 Å, the distance between the two trans-TPE arms is 26 Å, and the shoulder width of the two spirolactam units is 5 Å. When the molecules are stacked, the distance between two ABPX matrices is 4 Å, the distance between hydrazone arms is 10 Å, and the parallel distance between the two TPEs is 23 Å. In the asymmetric A-T1, the length of the extended arm decreased to 20 Å. In the aggregated state, there were more A-T1 molecules in the nanoparticle, which may cause the particle size to grow larger. As for A-T2, the molecules were arranged loosely, and more luminous centers could be formed to contribute brighter fluorescence.
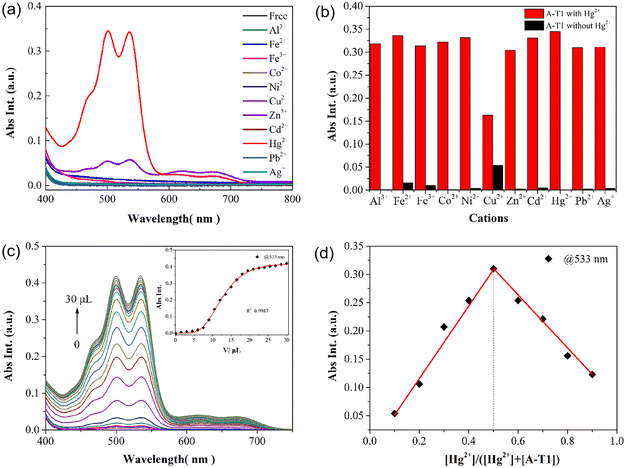
3.2 UV-Vis spectral recognition of Hg2+
When adding transition-metal ions into the aqueous solution, both probes displayed no significant spectral changes, whereas they showed a distinct selectivity to metal ions in EtOH solution. In the presence of 10 equiv. Hg2+ ions, there was a noticeable double peak absorption at 499 and 533 nm, and the solution of A-T1 changed from colorless to pink (Fig. 2a). Other metal ions, such as Fe2+, Fe3+, Co2+, Ni2+, Cu2+, Zn2+, Cd2+, Pb2+, and Ag+, caused a negligible spectral increase under the same conditions. In the A-T2 solution, the addition of Hg2+ had no visible impact on the absorption in the visible region; however, it showed selectivity to Cu2+ with weak visible absorption and color change (Fig. S3†). The time dependence of the selective recognition of Hg2+ was investigated to obtain the optimal operating conditions. The absorbance intensity of the A-T1 solution at 533 nm accelerated within 120 s, and it gradually became stable with prolonged response time.Competition experiments were employed by adding Hg2+ and interfering ions into the A-T1 solution (Fig. 2b). Cu2+ caused a medium decrease in absorbance at 533 nm, and the other metal ions exhibited little influence on the detection of Hg2+. These results indicated that A-T1 displayed high anti-interference ability towards Hg2+ in complex samples. When utilizing A-T2 to run the competition test for Cu2+, it was found to be susceptible to other metal ions, which implied that A-T2 was not the best candidate for sensing Cu2+ in EtOH solution (Fig. S4†).
The relationship between the volume of Hg2+ and the absorption intensity of A-T1 was analyzed, as shown in Fig. 2c. With the volume of Hg2+ titrated to 30.0 μL, there was an exponential growth in absorbance value at 533 nm (R2 = 0.9987), and the maximum intensity was about 560-fold higher than that of the initial state.
3.3 Hg2+ sensing mechanism
To verify the response process of A-T1 towards Hg2+, Na2S was back titrated into the A-T1–Hg2+ solution. As the volume of S2− reached 60.0 μL, the absorption at 499 and 533 nm decreased and the pink color faded. This indicated that the coordinated Hg2+ with A-T1 can be captured by S2− (Fig. S5†).The preferential binding sites of hydrazide and hydrazone are carbonyl O and imide N, which can coordinate with Cu2+ or Hg2+ when the spatial structure is suitable.33 Due to the larger steric hindrance effect of TPE, Hg2+ could not coordinate with the TPE-capped hydrazone site of A-T1. The steric hindrance effect of the hydrazide site of A-T1 was relatively smaller than hydrazone, so Hg2+ could chelate with hydrazide ligands to initiate spirolactam ring opening. The ion radius of Cu2+ is smaller than that of Hg2+, so it can bind to the hydrazone part (Scheme 2). ESI-MS tests were conducted by individually adding 30 μL of Hg2+, Cu2+ or a mixture of them into the A-T1 solution. When Hg2+ was injected, there was a strong MS peak at 1241.358, corresponding to the isotope distribution of A-T1–Hg2+, while Cu2+ was present, the MS peak at 1100.326 illustrated that A-T1 reacted with a single Cu2+. Under the same conditions, when the mixture of Hg2+ and Cu2+ was added, m/z = 1300.275 suggested formation of a mercury–copper bimetallic complex. The coordination mode between A-T1 and Hg2+ was further ascertained by the Job's plot method (Fig. 2d).34 The maximum value was found at 0.5 ([Hg2+]/{[Hg2+] + [A-T1]}), and the most likely binding mode was a 1![[thin space (1/6-em)]](https://www.rsc.org/images/entities/char_2009.gif) :
:![[thin space (1/6-em)]](https://www.rsc.org/images/entities/char_2009.gif) 1 stoichiometry.
1 stoichiometry.
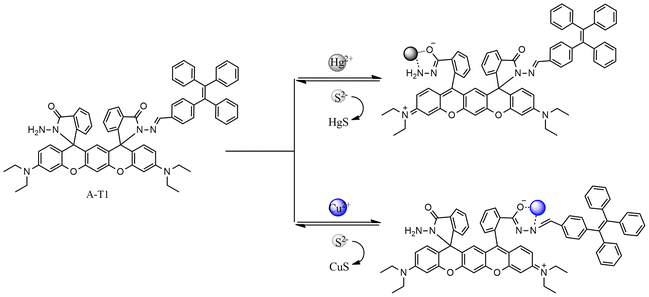 | ||
| Scheme 2 Proposed mechanism for the colorimetric changes of A-T1 upon the addition of Hg2+, Cu2+ and S2−. | ||
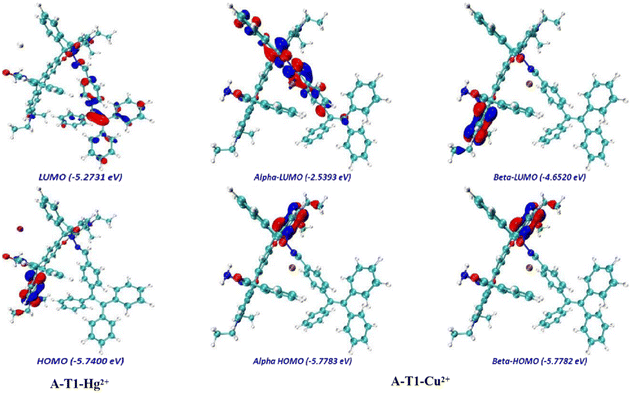
The electron density between the interacting species was analyzed using density functional theory (DFT) calculations (Fig. 3, S6 and S7†). They indicated that the LUMO of A-T1 was mainly distributed on the spirolactam hydrazone and the benzene ring attached to the TPE unit, and the HOMO was mostly distributed on the diethylaniline group near the hydrazide side (band gap: 3.47 eV). Once the TPE-capped hydrazone arm captured Cu2+, the electron density of the LUMO diffused to the spirolactam moiety, and the HOMO of A-T1–Cu2+ was mainly located on the diethylaniline group closer to the hydrazone arm (energy gap: α = 3.24 eV, β = 1.13 eV). When the hydrazide site of A-T1 chelated with Hg2+, the LUMO electron density was uniformly distributed throughout the molecule, whereas the HOMO of A-T1–Hg2+ was generally consistent with A-T1 (energy gap: 0.47 eV). When Cu2+ and Hg2+ sequentially coordinated with A-T1, the majority of electrons transferred to the TPE moiety in the LUMO map, and the HOMO of A-T1–Hg2+–Cu2+ was identical to that of A-T1–Cu2+ (energy gap: α = 0.99 eV, β = 1.16 eV). It also revealed that the complexes A-T1–Hg2+ and A-T1–Hg2+–Cu2+ were stabilized due to the lower energy gaps.
3.4 Solid state fluorescence
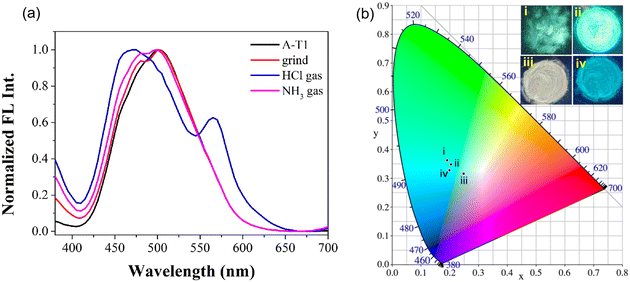
With strong AIE emission in aqueous solution, both probes could emit obvious fluorescence in the solid state. The color and emission spectral changes were observed after grinding and fumigation with acid gas. As can be seen from the CIE 1931 chromaticity diagram (Fig. 4), the fluorescence of A-T1 powder was cyan (i), and the coordinates were (0.1901, 0.3631); after grinding in a mortar, the fluorescence of A-T1 became brighter than the large particles (ii), and the coordinates were (0.2041, 0.3478). Furthermore, when fumigated with HCl gas, the color of the ground powder turned to light pink with white fluorescence emission (iii), and the coordinates moved to the edge of the cyan color range (0.2479, 0.3166). Once retreated with NH3 gas (iv), the white emission could be converted to a blue color, which was very close to the initial state (0.1989, 0.3282). Different from the changes in A-T1, there was no apparent variation for A-T2 in the presence of external stimuli (Fig. S8†).1H NMR spectroscopy could reflect abundant molecular information of A-T1 and A-T2 in the presence of different stimuli (Fig. S9 and S10†). After treating with HCl, the imine proton at 8.7 ppm shifted to 9.3 ppm, due to the ring-opened structure of the spirolactam hydrazone fragment. The aniline proton bound with xanthene (δ = 6.16–6.56 ppm) disappeared because of the protonation of diethylamine. Under basic conditions, the protonated amine proton was neutralized by NH3, and the spirolactam structure was rebuilt. From the chemical shifts of these protons, it is clear that the acid proton at 9.3 ppm gradually returned, and the vanished signals (6.00, 6.16–6.56 ppm) reappeared, roughly consistent with the initial shifts.
3.5 Fluorescence imaging in vivo
AIE probes have been widely used in vivo imaging. Mung beans and zebrafish were selected as living samples to be cultivated in A-T1 and A-T2 solutions (Fig. 5 and 6). Under the excitation of green light, the cotyledon of sprouts exhibited obvious fluorescence after incubation with the probes for 0.5 h, while in the control sample, there was no fluorescence observed from the cotyledon slices. The results confirmed that these probes could be absorbed by plants through their roots.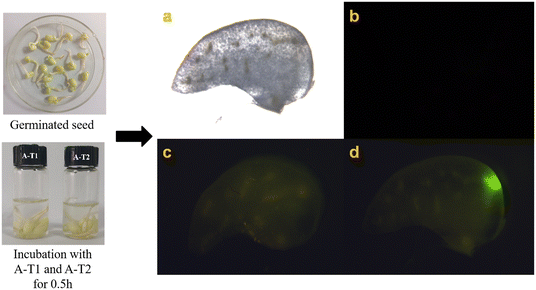 | ||
| Fig. 5 Fluorescence imaging of sprouts from mung bean (a): control (b) and in solutions of (c) A-T1 (10 μM) and (d) A-T2 (10 μM). | ||
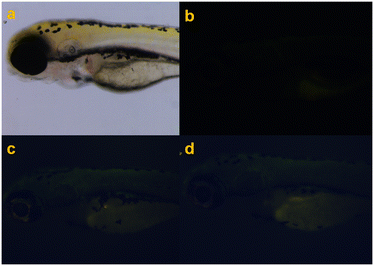 | ||
| Fig. 6 Fluorescence imaging of a zebrafish (a): control (b) and treated with (c) A-T1 (10 μM) and (d) A-T2 (10 μM). | ||
In vivo imaging of zebrafish, after incubation with A-T1 and A-T2 separately, its head, dorsal muscles and abdomen appeared green in fluorescence microscopy. In comparison, the autofluorescence of the control fish glowed softly in the abdomen tissue and the back fin. The reasons for such differences may be the digestive and circulatory processes that transported these probes throughout the body and enriched them in certain tissues. The imaging profiles showed that A-T1 and A-T2 probes could be used as fluorescent markers in vivo experiments.
4. Conclusion
In summary, we have synthesized two AIE probes, A-T1 and A-T2, which were obtained by substituting various TPE groups at the hydrazone sites. The AIE properties of these molecules were verified by increasing the water fraction of EtOH to form the aggregated particles. Their AIE emissions were centered at 475 and 500 nm, and the fluorescence quantum yields were 0.29 and 0.33, respectively. In the aggregated state, due to the repulsion of the TPE arms, the crystal of A-T2 has larger intermolecular spacing and is arranged loosely, which created more luminous centers. In EtOH solution, A-T1 exhibited colorimetric recognition ability and spectral response to Hg2+, while A-T2 showed weak response to Cu2+ with poor anti-interference ability. The hydrazide sites of A-T1 could chelate with Hg2+ to induce spirolactam ring opening, and this process was proven by ESI-MS tests and DFT calculation. The Job's plot analysis demonstrated that the binding mode between A-T1 and Hg2+ was 1![[thin space (1/6-em)]](https://www.rsc.org/images/entities/char_2009.gif) :
:![[thin space (1/6-em)]](https://www.rsc.org/images/entities/char_2009.gif) 1. Cu2+ could bind with the TPE-capped hydrazone arm due to its smaller ion radius, and this was verified in A-T2–Cu2+. The emission of the two solid samples was cyan and the grinding process could enhance their fluorescence. When fumed in HCl gas, the color of A-T1 turned light pink and it emitted white fluorescence, and this could be reversed with NH3 gas. In contrast, under acid stimulus, the fluorescence of A-T2 remained largely unchanged. The two probes could be used as fluorescent markers in vivo imaging of mung beans and zebrafish.
1. Cu2+ could bind with the TPE-capped hydrazone arm due to its smaller ion radius, and this was verified in A-T2–Cu2+. The emission of the two solid samples was cyan and the grinding process could enhance their fluorescence. When fumed in HCl gas, the color of A-T1 turned light pink and it emitted white fluorescence, and this could be reversed with NH3 gas. In contrast, under acid stimulus, the fluorescence of A-T2 remained largely unchanged. The two probes could be used as fluorescent markers in vivo imaging of mung beans and zebrafish.
Author contributions
Yang Yang: funding acquisition, investigation, methodology. Chang Pei: methodology, visualization, writing – original draft. Chao-Ying Gao: funding acquisition, methodology, investigation. Jinglin Liu: investigation, methodology, writing – review & editing, project administration.Conflicts of interest
There are no conflicts of interest to declare.Acknowledgements
We thank Peng Li (Beihua University) for his help with the DFT calculations. This work was financially supported by the National Natural Science Foundation of China (22061033); the Natural Science Foundation of Inner Mongolia Autonomous Region of China (2019MS02004); Inner Mongolia Autonomous Region Funding Project for Science & Technology Achievement Transformation (2022YFDZ0039) and the Fundamental Research Funds for the Colleges and Universities directly under Inner Mongolia Autonomous Region (GXKY22117). Scientific Research Projects of the Inner Mongolian Higher Educational System (NJZY20115).References
- Z. H. Zhang, N. Corrigan, A. Bagheri, J. Y. Jin and C. Boyer, A Versatile 3D and 4D Printing System through Photocontrolled RAFT Polymerization, Angew. Chem., 2019, 131(50), 18122–18131, DOI:10.1002/ange.201912608.
- N. Sharma, M. Maciejczyk, D. Hall, W. B. Li, V. Liégeois, D. Beljonne, Y. Olivier, N. Robertson, I. D. W. Samuel and E. Zysman-Colman, Spiro-Based Thermally Activated Delayed Fluorescence Emitters with Reduced Nonradiative Decay for High-Quantum-Efficiency, Low-Roll-Off, Organic Light-Emitting Diodes, ACS Appl. Mater. Interfaces, 2021, 13(37), 44628–44640, DOI:10.1021/acsami.1c12234.
- X. Li, Y. C. Zhang, Y. J. Zhao, H. P. Zhao, B. Zhang and T. Cai, Xanthene dye-functionalized conjugated porous polymers as robust and reusable photocatalysts for controlled radical polymerization, Macromolecules, 2020, 53(5), 1550–1556, DOI:10.1021/acs.macromol.0c00106.
- C. J. Liu and C. N. Scott, Design strategies to rhodamine analogue fluorophores for near-infrared II biological imaging applications, Dyes Pigm., 2021, 196, 109792, DOI:10.1016/j.dyepig.2021.109792.
- L. L. Wang, W. Du, Z. J. Hu, K. Uvdal, L. Li and W. Huang, Hybrid Rhodamine Fluorophores in the Visible/NIR Region for Biological Imaging, Angew. Chem., Int. Ed., 2019, 58(40), 14026–14043, DOI:10.1002/anie.201901061.
- N. Ando, H. Soutomea and S. Yamaguchi, Near-infrared fluorescein dyes containing a tricoordinate boron atom, Chem. Sci., 2019, 10(33), 7816–7821, 10.1039/C9SC02314C.
- Y. Shirasaki, Y. Okamoto, A. Muranaka, S. Kamino, D. Sawada, D. Hashizume and M. Uchiyama, Fused-Fluoran Leuco Dyes with Large Color-Change Derived from Two-Step Equilibrium: iso-Aminobenzopyranoxanthenes, J. Org. Chem., 2016, 81(23), 12046–12051, DOI:10.1021/acs.joc.6b02403.
- N. Fukino, S. Kamino, M. Takahashi and D. Sawada, Synthesis of Aminobenzopyranoxanthenes with Nitrogen-Containing Fused Rings, J. Org. Chem., 2017, 82(24), 13626–13631, DOI:10.1021/acs.joc.7b02290.
- M. Tanioka, S. Kamino, A. Muranaka, Y. Ooyama, H. Ota, Y. Shirasaki, J. Horigome, M. Ueda, M. Uchiyama, D. Sawada and S. Enomoto, Reversible Near-Infrared/Blue Mechanofluorochromism of Aminobenzopyranoxanthene, J. Am. Chem. Soc., 2015, 137(20), 6436–6439, DOI:10.1021/jacs.5b00877.
- P. Hammershøj, E. K. P. Kumar, P. Harris, T. L. Andresen and M. H. Clausen, Facile Large-Scale Synthesis of 5- and 6-Carboxyfluoresceins: Application for the Preparation of New Fluorescent Dyes, Eur. J. Org. Chem., 2015, 2015(33), 7301–7309, DOI:10.1002/ejoc.201501013.
- L. J. Liang, L. C. Zhao and X. S. Zeng, Synthesis, optical, and chemical properties of a π-extended rhodol derivative and its derivatives with selectivity and sensitivity for sensing Hg2+ in aqueous media, RSC Adv., 2016, 6(88), 85165–85172, 10.1039/C6RA17024B.
- L. Li, C. Y. Wang, J. J. Wu, Y. C. Tse, Y.-P. Cai and K. M.-C. Wong, A molecular chameleon with fluorescein and rhodamine spectroscopic behaviors, Inorg. Chem., 2016, 55(1), 205–213, DOI:10.1021/acs.inorgchem.5b02147.
- C. Y. Wang and K. M.-C. Wong, Selective Hg2+ Sensing Behaviors of Rhodamine Derivatives with Extended Conjugation Based on Two Successive Ring-Opening Processes, Inorg. Chem., 2013, 52(23), 13432–13441, DOI:10.1021/ic401810x.
- S. Kamino, M. Murakami, M. Tanioka, Y. Shirasaki, K. Watanabe, J. Horigome, Y. Ooyama and S. Enomoto, Design and Syntheses of Highly Emissive Aminobenzopyrano-xanthene Dyes in the Visible and Far-Red Regions, Org. Lett., 2014, 16(1), 258–261, DOI:10.1021/ol403262x.
- J. H. Yang, Y. H. Zhang, X. H. Wu, W. B. Dai, D. Chen, J. B. Shi, B. Tong, Q. Peng, H. Y. Xie, Z. X. Cai, Y. P. Dong and X. Zhang, Rational design of pyrrole derivatives with aggregation-induced phosphorescence characteristics for time-resolved and two-photon luminescence imaging, Nat. Commun., 2021, 12(1), 1–8, DOI:10.1038/s41467-021-25174-6.
- Y. Y. Li, Z. C. Cai, S. J. Liu, H. K. Zhang, S. T. H. Wong, J. W. Y. Lam, R. T. K. Kwok, J. Qian and B. Z. Tang, Design of AIEgens for near-infrared IIb imaging through structural modulation at molecular and morphological levels, Nat. Commun., 2020, 11(1), 1–10, DOI:10.1038/s41467-020-15095-1.
- J. W. Xu, M. H. Chua and B. Z. Tang, Aggregation-Induced Emission (AIE) A Practical Guide, 2022, Elsevier, DOI:10.1016/C2020-0-01478-7.
- X. G. Gu and B. Z. Tang, Aggregation-Induced Emission: Applications in Biosensing, Bioimaging and Biomedicine, 2022, vol. 1, De Gruyter, DOI:10.1515/9783110672220.
- Z. H. Sheng, B. Guo, D. H. Hu, S. D. Xu, W. B. Wu, W. H. Liew, K. Yao, J. Y. Jiang, C. B. Liu, H. R. Zheng and B. Liu, Bright Aggregation-Induced-Emission Dots for Targeted Synergetic NIR-II Fluorescence and NIR-I Photoacoustic Imaging of Orthotopic Brain Tumors, Adv. Mater., 2018, 30(29), 1800766, DOI:10.1002/adma.201800766.
- P. F. Xu, F. Kang, W. D. Yang, M. R. Zhang, R. L. Dang, P. Jiang and J. Wang, Molecular engineering of a high quantum yield NIR-II molecular fluorophore with aggregation-induced emission (AIE) characteristics for in vivo imaging, Nanoscale, 2020, 12(8), 5084–5090, 10.1039/c9nr09999a.
- H.-L. Jiang, Y.-H. Yang, Y.-H. He and Z. Guan, Visible-Light-Catalyzed Radical-Radical Cross-Coupling Reaction of Benzyl Trifluoroborates and Carbonyl Compounds to Sterically Hindered Alcohols, Org. Lett., 2022, 24(23), 4258–4263, DOI:10.1021/acs.orglett.2c01583.
- A. Kumar, R. R. Ujjwal, A. Mittal, A. Bansal and U. Ojha, Polyacryloyl Hydrazide: An Efficient, Simple, and Cost Effective Precursor to a Range of Functional Materials through Hydrazide Based Click Reactions, ACS Appl. Mater. Interfaces, 2014, 6(3), 1855–1865, DOI:10.1021/am404837f.
- H.-X. Yu, J. G. Zhi, Z.-F. Chang, T. J. Shen, W.-L. Ding, X. L. Zhang and J.-L. Wang, Rational design of aggregation-induced emission sensor based on Rhodamine B for turn-on sensing of trivalent metal cations, reversible data protection, and bioimaging, Mater. Chem. Front., 2019, 3(1), 151–160, 10.1039/C8QM00424B.
- Y. Yang, C.-Y. Gao and D. W. Dong, Tetraphenylethene functionalized rhodamine dye for fluorescence detection of HCl vapor in the solid state, Anal. Methods, 2016, 8, 7898–7902, 10.1039/C6AY01582D.
- C. Li, K. Xiong, Y. Chen, C. Fan, Y.-L. Wang, H. Ye and M.-Q. Zhu, Visible-Light-Driven Photoswitching of Aggregated-Induced Emission-Active Diarylethenes for Super-Resolution Imaging, ACS Appl. Mater. Interfaces, 2020, 12(24), 27651–27662, DOI:10.1021/acsami.0c03122.
- Y. L. He, L. Chen, H. Zhang, Z. Chen, F. Y. Huo, B. Li, Z. Zhen, X. H. Liu and S. H. Bo, A novel bichromophore based on julolidine chromophores with enhanced transferring efficiency from hyperpolarizability β to electro-optic activity, J. Mater. Chem. C, 2018, 6, 1031–1037, 10.1039/C7TC04928E.
- R. Singh, A. K. Dwivedi, A. Singh, C.-M. Lin, R. Arumugaperumal, K.-H. Wei and H.-C. Lin, Exploration of Energy Modulations in Novel RhB-TPE-Based Bichromophoric Materials via Interactions of Cu2+ Ion under Various Semiaqueous and Micellar Conditions, ACS Appl. Mater. Interfaces, 2016, 8(10), 6751–6762, DOI:10.1021/acsami.5b12768.
- Q. Ilyas, M. T. Waseem, H. M. Junaid, Z. A. Khan, F. Munir, A. J. Shaikh and S. A. Shahzad, Fluorescein based fluorescent and colorimetric sensors for sensitive detection of TNP explosive in aqueous medium: Application of logic gate, Spectrochim. Acta, Part A, 2022, 272, 120994, DOI:10.1016/j.saa.2022.120994.
- J. H. Du, L. Sheng, Y. Xu, Q. N. Chen, C. Gu, M. J. Li and S. X.-A. Zhang, Printable Off-On Thermoswitchable Fluorescent Materials for Programmable Thermally Controlled Full-Color Displays and Multiple Encryption, Adv. Mater., 2021, 33(20), 2008055, DOI:10.1002/adma.202008055.
- Y. Shirasaki, S. Kamino, M. Tanioka, K. Watanabe, Y. Takeuchi, S. Komeda and S. Enomoto, New Aminobenzopyranoxanthene-Based Colorimetric Sensor for Copper(II) Ions with Dual-Color Signal Detection System, Chem. - Asian J., 2013, 8(11), 2609–2613, DOI:10.1002/asia.201300515.
- Y. Yang, C. Y. Gao, N. Zhang and D. W. Dong, Tetraphenylethene functionalized rhodamine chemosensor for Fe3+ and Cu2+ ions in aqueous media, Sens. Actuators, B, 2016, 222, 741–746, DOI:10.1016/j.snb.2015.08.125.
- Crystallographic data for A-T2 (CCDC-2192462) has been deposited with Cambridge Crystallographic Data Centre. The refined structure is summarized in Fig. S1†.
- X. Q. Chen, T. Pradhan, F. Wang, J. S. Kim and J. Yoon, Fluorescent Chemosensors Based on Spiroring-Opening of Xanthenes and Related Derivatives, Chem. Rev., 2012, 112(3), 1910–1956, DOI:10.1021/cr200201z.
- J. S. Renny, L. L. Tomasevich, E. H. Tallmadge and D. B. Collum, Method of continuous variations: applications of job plots to the study of molecular associations in organometallic chemistry, Angew. Chem., Int. Ed., 2013, 52, 11998–12013, DOI:10.1002/anie.201304157.
Footnote |
| † Electronic supplementary information (ESI) available. CCDC 2192462. For ESI and crystallographic data in CIF or other electronic format see DOI: https://doi.org/10.1039/d3sd00048f |
| This journal is © The Royal Society of Chemistry 2023 |


