 Open Access Article
From the lab to the field: handheld surface enhanced Raman spectroscopy (SERS) detection of viral proteins†
Taylor D.
Payne
 a,
Stephen J.
Klawa
 b,
Tengyue
Jian
b,
Qunzhao
Wang
b,
Sang Hoon
Kim
b,
Tengyue
Jian
b,
Qunzhao
Wang
b,
Sang Hoon
Kim
 b,
Ronit
Freeman
 *b and
Zachary D.
Schultz
 *a
*a
aDepartment of Chemistry and Biochemistry, The Ohio State University, Columbus, Ohio 43210, USA. E-mail: schultz.133@osu.edu
bDepartment of Applied Physical Sciences, University of North Carolina, Chapel Hill, North Carolina 27599, USA. E-mail: ronifree@email.unc.edu
First published on 10th August 2023
Abstract
Translating sensors from the lab benchtop to a readily available point-of-need setting is desirable for many fields, including medicine, agriculture, and industry. However, this transition generally suffers from loss of sensitivity, high background signals, and other issues which can impair reproducibility. Here we adapt a label-free surface-enhanced Raman spectroscopy (SERS) sensor for SARS-CoV-2 antigens from a lab-based assay to a handheld device. Utilizing a peptide capture molecule, which we previously employed for a surface-based assay, we optimize a simpler and more cost-efficient nanoparticle-based assay. This new assay allows for the direct detection of these viral antigens by SERS, now with the advantages of robustness and portability. We highlight considerations for nanoparticle modification conditions and warn against methods which can interfere with accurate detection. The comparison of these two assays will help guide further development of SERS-based sensors into devices that can be easily used in point-of-care settings, such as by emergency room nurses, farmers, or quality control technicians.
Introduction
Rapid detection of specific molecules on-site is important in many different fields such as healthcare diagnostics or product quality assurance. The quick detection of easily transmissible viruses such as SARS-CoV-2 is especially important. This enables infected individuals to be identified and isolated to limit the spread of the disease.1 One attractive tool for rapid detection of viral antigens is Raman spectroscopy, a vibrational spectroscopy technique that provides the “molecular fingerprint” of the molecule being measured.2–4 The limit of detection and sensitivity of Raman can be enhanced using noble metal nanostructures. Laser excitation of the localized surface plasmon resonance (LSPR) amplifies Raman signals of analyte molecules by several orders of magnitude.5 This technique, termed surface-enhanced Raman spectroscopy (SERS), can enable detection down to the single molecule limit.5 The development of handheld spectrometers has been essential for enabling on-site SERS measurements. Unfortunately, translating laboratory-based methods to handheld devices while maintaining reproducibility and sensitivity can be challenging.6Many SERS-based sensors have been designed to be compatible with handheld Raman spectrometers, demonstrating detection of viruses, drugs, disease biomarkers, and other targets.7–18 However, there are several known challenges associated with adapting SERS based assays to the point of care.1 When using a fluorescent Raman reporter probe, fluorescence from the laser excitation can impact the resolution of the acquired spectra.19 Additionally, these labeling techniques detect reporter molecule signals, which are non-specific and can be subject to interference from contamination or complex samples obtained in the field. Without using labels, SERS can identify molecules directly based on their unique signature. However, SERS detection of clinical samples is challenged by the vast range of biomolecules that can adsorb to the substrates and yield similar spectra. Measuring desired signals in complex fluids necessitates designing specific capture probes. In addition to these considerations, variability in sample processing and collection setup can cause irreproducible results.20 Furthermore, planar SERS substrates are often less field-suitable due to their fragility and high cost of manufacturing. Alternatively, gold colloids are inexpensive and easy to produce, remain stable and clean upon storage,21 and are simple to use.
We previously reported a label-free SERS assay for the detection of SARS-CoV-2. We utilized ACE2-mimetic peptide-functionalized SERS substrates to selectively bind the receptor binding domain (RBD) of the SARS-CoV-2 spike protein, enabling its quantitative detection.22 Here we translate the surface-based assay to a gold nanoparticle solution-based assay compatible with a handheld Raman spectrometer (Scheme 1). We discuss the challenges that must be considered during the process and highlight the importance of proper nanoparticle functionalization conditions and treatment to achieve target binding and detection. These considerations include obtaining sufficient peptide coverage, maintaining nanoparticle stability, and maximizing SERS signals. As a result of these optimizations, we show the successful utilization of peptide-modified gold nanoparticles (peptide-AuNPs) for the rapid detection of SARS-CoV-2 proteins with a handheld Raman spectrometer.
Experimental
Materials
All purchased chemicals were used without further purification. Dimethyl sulfoxide (DMSO), sodium chloride, tris(hydroxymethyl)aminomethane (Tris), and sodium citrate dihydrate were purchased from Fisher. Gold(III) chloride hydrate, silicone oil, hydrochloric acid (HCl), sodium hydroxide (NaOH) pellets, 4-mercaptobenzoic acid (MBA), glycerol, trehalose, and mannitol were purchased from Sigma Aldrich. Sodium phosphate dibasic and sodium phosphate monobasic were purchased from Calbiochem. Tween-80 was purchased from RPI Research Products. Bradford dye (1×) was purchased from Bio-Rad. Commercial gold nanostructured substrates were purchased from Silmeco. Tris(hydroxymethyl)aminomethane (TCEP HCl) was purchased from Thermo. Ethanol was purchased from Decon Labs. Baculovirus insect-derived SARS-CoV-2 Spike RBD-His (Cat#: 40592-V08B) and SARS-CoV-2 Spike S1 + S2-His (Cat#: 40589-V08B1) were purchased from Sino Biological.Gold nanoparticle synthesis
Gold colloids were synthesized using a protocol adapted from Frens et al.23 An Erlenmeyer flask and stir bar were cleaned by soaking in Nochromix overnight. Solutions of 0.01% by weight gold(III) chloride hydrate and 1% by weight sodium citrate dihydrate were prepared in ultrapure water. Next, 100 mL of the gold solution was heated to 100 °C in a silicone oil bath with an applied voltage while stirring vigorously. To achieve a nanoparticle diameter of approximately 40 nm, 1.4 mL of citrate was added to the flask, and boiling was continued for 20 minutes before cooling to room temperature. Nanoparticles were stored in conical tubes as synthesized.Nanoparticle tracking analysis (NTA)
A Malvern Panalytical NanoSight NS300 equipped with a 532 nm laser was employed to measure the size distribution and concentration of AuNPs after synthesis. The instrument was flushed with water and air to ensure cleanliness before loading the sample. A syringe pump was used to flow 100-fold-diluted sample through the instrument at 50 μL min−1 for a total of 5 particle tracks. The built-in nanoparticle tracking analysis software was used to analyze the data.Transmission electron microscopy (TEM)
A Tecnai G2-30 transmission electron microscope (TEM) at The Ohio State University's Center for Electron Microscopy and Analysis (CEMAS) was used to acquire images of AuNPs at stock concentration prepared on CFLF135-Cu-UL TEM grids (Electron Microscopy Sciences).Peptide synthesis and purification
The ACE-2 mimetic peptide was synthesized using an automated standard fluoren-9-ylmethoxycarbonyl (Fmoc) solid-phase peptide synthesizer (Liberty Blue, CEM) on rink amide MBHA resin. Peptides were cleaved from the resin using a solution of 95% trifluoroacetic acid (TFA), 2.5% triisopropylsilane (TIPS), and 2.5% DI H2O. The acid was evaporated, and the crude peptide was purified using reverse-phase HPLC (Shimadzu UFLC, Ultra C18 5 μM, 100 × 10 mm column) with a gradient of 0.1% TFA in water and acetonitrile over 50 min. Purified peptides were lyophilized and stored at −80 °C. Purity was confirmed by electrospray ionization mass spectrometry and HPLC.Peptide-functionalization of nanoparticles
Peptide solution was prepared at a concentration of 1 mM (6 × 10¹⁷ peptides per mL) in 1% DMSO in ultrapure water. Eppendorf tubes were each filled with approximately 2.6 × 10⁹ AuNPs, specifically by combining 900 μL of ultrapure water and 100 μL of gold nanoparticle stock solution measured by NTA to have a concentration of 2.6 × 10¹⁰ (±0.45 × 10¹⁰) particles per mL. Nanoparticle solutions were centrifuged at 7000 rcf for 30 min, and the supernatant containing excess citrate was removed from the pelleted nanoparticles. To each nanoparticle pellet, 1 mL of peptide solution was added, yielding a peptide-to-nanoparticle ratio of 3 × 10⁸. These solutions were briefly vortexed and sonicated, and then were mixed on a shaker overnight at 500 rpm to functionalize the nanoparticles with a peptide monolayer. To prepare control solutions of nanoparticles, the same procedure was followed, except the peptide solution was replaced with 1% DMSO containing no peptide. To pH adjust peptide-modified particles, HCl and NaOH were used.Ultraviolet-visible (UV-vis) spectroscopy
A VWR UV-1600PC spectrometer was used to obtain extinction spectra from AuNPs both as synthesized and after peptide functionalization. The citrate capped nanoparticles were diluted 10-fold with ultrapure water and measured in a plastic cuvette with a 1 cm pathlength. The peptide-functionalized nanoparticles were diluted 36-fold with ultrapure water and placed in a 1 mm pathlength quartz cuvette. An Agilent Cary 4000 spectrophotometer with a 1 cm plastic cuvette was used to measure extinction spectra of stock AuNPs after 5 months of storage. For each experiment, the instrument was blanked with water, and three spectra were recorded for each sample.Dynamic light scattering (DLS)
A Malvern Panalytical Zetasizer Nano ZS was used to perform dynamic light scattering (DLS) with an applied voltage to obtain zeta potential measurements from AuNPs before and after peptide-functionalization. All samples were diluted 36-fold with ultrapure water and deposited into a Zetasizer cuvette, which was cleaned in between samples with ethanol and water. The zeta potential of each sample was measured three times.Protein treatment of nanoparticles
Peptide-AuNP solutions were adjusted to pH 2 with HCl before the addition of SARS-CoV-2 receptor binding domain (RBD). Concentrations of 10 μM, 5 μM, and 2.5 μM RBD were mixed with peptide-AuNPs on a shaker for 30 min to allow protein binding. Solutions were centrifuged for 30 min at 7000 rcf to remove supernatant containing excess protein.Bradford assay
A buffer solution was prepared in ultrapure water to mimic the SARS-CoV-2 RBD buffer (20 mM phosphate buffer, 300 mM sodium chloride, 10% glycerol, 5% trehalose, 5% mannitol, and 0.01% Tween-80, pH 7.0). AuNPs were treated with RBD buffer mimic, and peptide-AuNPs were treated with either RBD buffer mimic or 10 μM SARS CoV-2 RBD. Bradford dye was added to these samples and shaken at 500 rpm for 5 minutes. UV-vis spectra of solutions were obtained using a VWR UV-1600PC spectrometer. Ratios of absorbance at 590 nm (protein–dye complex) and 450 nm (unbound dye) were used to compare amounts of peptide/protein bound to AuNPs.Raman and surface enhanced Raman spectroscopy (SERS) measurements
A Metrohm Mira DS spectrometer with a 785 nm laser and orbital raster scanning technology was utilized to acquire handheld Raman and surface enhanced Raman (SERS) spectra. The instrument was equipped with the intelligent Universal Attachment set to position 2, giving a 4 mm focal length. Measurements were made for 10 s using power setting 5 in raster scan mode, resulting in a power of 37 mW at the sample. For handheld signal acquisition of solutions, 5 μL of the sample was dropped onto a gold-coated well slide, which avoided the strong background signal from the glass. For comparison of signal from the handheld instrument to a stationary benchtop instrument, a Renishaw inVia Qontor microscope with a 785 nm laser was also employed. For these measurements, a 50× objective with NA = 0.50, a 1200 grooves per mm grating, a power of 570 μW, and acquisition times of 1 s were chosen. Three spectra were obtained from each sample.Data processing and analysis
All spectral analysis, statistics, and plotting were performed in MATLAB (version R2019b, Mathworks Inc.), with the exception of standard error in y (Sy) which was calculated using Microsoft Excel. Spectra were baselined using “airPLS” in MATLAB.24 The PLS Toolbox (version 8.7.1, Eigenvector Research Inc.) was used to perform multivariate curve resolution (MCR) analysis of SERS data.Results and discussion
This work investigates the modifications necessary to achieve successful translation of a SERS-based viral antigen sensor from a laboratory assay to a portable, more cost-effective platform. Specifically, we have outlined a process to adjust our previous methodology using lithographically fabricated commercial substrates coupled with a benchtop Raman microscope to using colloidal nanoparticles with a handheld Raman spectrometer.Miniaturizing instrumentation can often lead to performance trade-offs,25 however the handheld device used for this study demonstrates relatively comparable performance to the microscope. To evaluate the specifications of both instruments, SERS spectra were obtained from Silmeco surfaces covered in a monolayer of 4-mercaptobenzoic acid (MBA), a Raman reporter molecule (Fig. S1†). The full width at half maximum (FWHM) resolutions of the two instruments differ by about 6 cm−1, and the signal-to-noise ratios (S/N) are on the same order of magnitude. Moreover, as compared to point-mapping a sample on the microscope to collect data across an area, the handheld device has orbital raster scanning (ORS) technology, which gives improved signal collection efficiency and reproducibility.26 This ORS feature allows a large sample area to be probed while dispersing laser power density and maintaining high spectral resolution.26
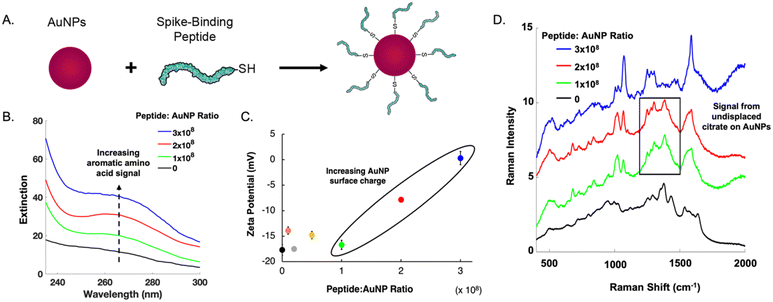
The main challenge surrounding this shift to a point-of-need approach involves designing peptide-modified nanoparticles capable of detecting viral proteins. A simple citrate-reduction method yields reproducible gold colloids with a size of approximately 46 nm and a maximum localized surface plasmon resonance (LSPR) at 530 nm (Fig. S2†). These gold colloids are concentrated by pelleting them before SERS measurement. The intense signals obtained with a 785 nm laser suggest that we are measuring aggregates, which are known to have a red-shifted LSPR. To specifically target viral antigens, the surface of these particles is modified with an ACE2-mimetic, SARS-CoV-2 spike-binding peptide (C-PEG4-IEEQAKTFLDKFNHEAEDLFYQS; Fig. S3†) through a gold-thiol bond (Fig. 1A), yielding peptide-functionalized gold nanoparticles (peptide-AuNPs).
Promoting peptide attachment requires optimizing functionalization conditions, such as the ratio of peptides to nanoparticles. Fig. 1 shows the UV-vis spectra, zeta potential values, and SERS spectra utilized to determine the proper peptide concentration to achieve sufficient nanoparticle surface coverage. At a ratio of 1 × 10⁸, a notable absorbance peak from aromatic amino acids is present (Fig. 1B). This peak continues to increase in intensity with larger amounts of peptide, suggesting a monolayer has not been reached. Nanoparticle surface charge begins to increase at 2 × 10⁸ peptides per nanoparticle (Fig. 1C), but SERS spectra show persistent signal from undisplaced citrate until the ratio reaches 3 × 10⁸ (Fig. 1D). This ratio requires 1 mL of 1 mM peptide to functionalize 109 nanoparticles.
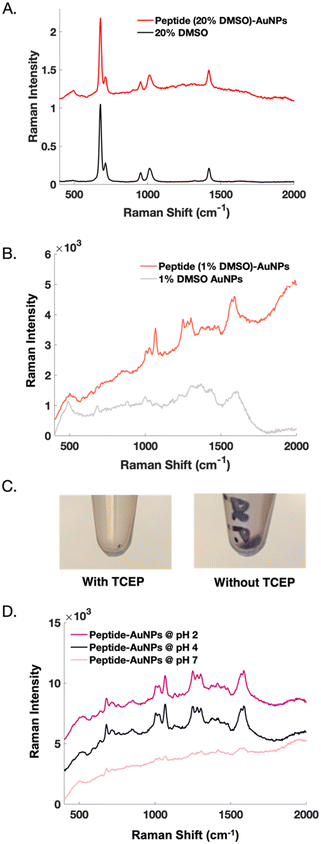
Initial nanoparticle functionalization attempts were based on the protocol conditions from our previous report22 on peptide-modification of commercial substrates. Functionalizing nanoparticles requires different considerations than functionalizing a planar substrate but can be achieved by making slight adjustments to the surface-based approach. For instance, DMSO is used as a solvent to aid with peptide solubility. In nanoparticle experiments, when 20% DMSO is used to solubilize the peptide, the Raman signal from DMSO becomes problematic. We suspect that the signal from DMSO at such a high concentration overshadows the desired, yet weaker SERS signal from the peptide (Fig. 2A). Whereas a surface can be readily rinsed, DMSO adsorbed to colloidal nanoparticles is more difficult to remove. Reducing the DMSO concentration to 1% reveals a clear SERS signal from the peptide (Fig. 2B).
Nanoparticle dispersion relies on electrostatic repulsions which occur between particles in solution.27,28 Using TCEP-HCl to reduce disulfide bonds between peptides causes irreversible nanoparticle aggregation. TCEP significantly decreases particle recovery, as indicated by a visibly smaller pellet (Fig. 2C). AuNPs are highly susceptible to pH and salt-induced aggregation. Reducing agents like TCEP create solutions with low pH, unless they are buffered.29 Buffers introduce salt into solution, making such reducing agents undesirable when needing to maintain dispersed nanoparticles for functionalization. Ultimately, nanoparticle functionalization is successful when TCEP is eliminated from the protocol.
Controlling the pH of the nanoparticles both during and after functionalization is important. Interestingly, neutralizing the peptide-AuNPs eliminates their SERS signal, perhaps because dissociation of the gold-thiol bond has been shown to be more probable at higher pH.30 This result could also be related to an electrostatic repulsion that occurs when the peptide becomes a negatively charged species above its isoelectric point at 4.2.31 Reports have shown that peptide-functionalization of citrate-capped AuNPs is most effective at pH values below the isoelectric point of the peptide.32 On the other hand, acidifying the peptide-AuNPs further does not alter their SERS signal (Fig. 2D), but in later experiments does lead to detectable SERS signal from protein binding.
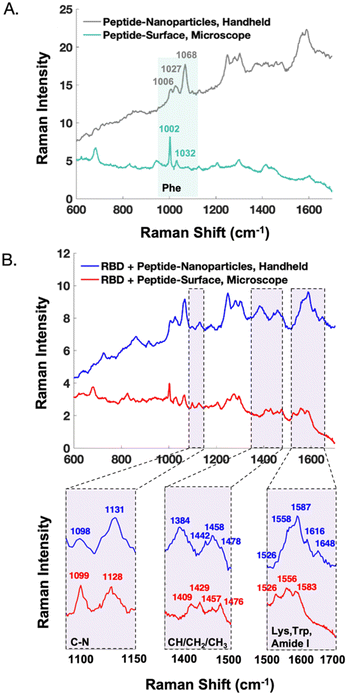
The handheld SERS signal from the peptide immobilized on nanoparticles closely resembles that of the peptide on a commercial surface (Fig. S4†). The majority of the signal results from phenylalanine residues of the capture peptide, exhibiting bands centred at 1006, 1027, and 1068 cm−1. There are discrepancies which are likely due to the orientation of the peptide with respect to the metal. SERS signals from protein-receptor interactions on different substrates have been shown to differ.31 Potential reasons include the degree that the analyte's orientation is controlled with respect to the substrate, along with the preferential enhancement of vibrational modes that align with the plasmon's polarization.33
The peptide-AuNPs bind to their viral antigen counterpart, SARS-CoV-2 receptor binding domain (RBD), as demonstrated by Bradford assay results (Fig. S5†). Protein binding causes detectable changes in the SERS signal (Fig. 3). The novel peaks listed in Table 1 are indicative of protein binding.34–37 Difficulties were faced with protein-binding experiments using peptide-AuNPs at pH 4, but adjusting the nanoparticle solutions to pH 2 yields successful protein detection by SERS. These changes in the SERS spectra are attributed to protein components like tryptophan, tyrosine, and amide backbone, along with potential binding-induced shifts in the orientation of the peptide on the nanoparticle.
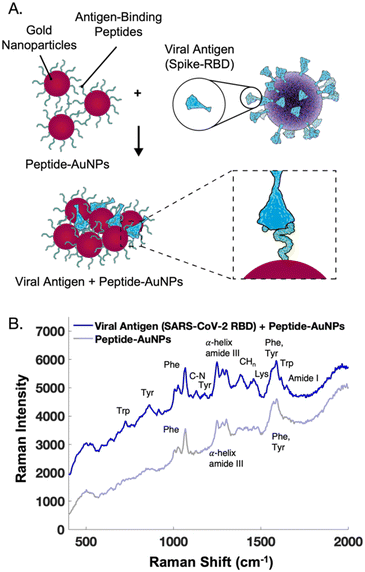 | ||
| Fig. 3 (A) Schematic of peptide-functionalized gold nanoparticles (peptide-AuNPs) binding to viral proteins. (B) Average handheld SERS signal before and after treatment of peptide-AuNPs with receptor binding domain protein from SARS-CoV-2, used to build a two component MCR model in Fig. 6. Spectra offset for clarity. | ||
| Raman shift (cm−1) | Proposed assignment |
|---|---|
| 729 | Tryptophan |
| 862 | Tyrosine |
| 1098 | C–N stretching |
| 1131 | C–N stretching, proline |
| 1178 | Tyrosine |
| 1384 | CH3 symmetric stretching |
| 1458 | CH/CH2/CH3 scissoring |
| 1526 | NH3+ deformation of lysine |
| 1559 | Indole ring stretching of tryptophan |
| 1587 | Tryptophan aromatic ring stretching |
| 1616 | Tryptophan |
| 1648 | Amide I |
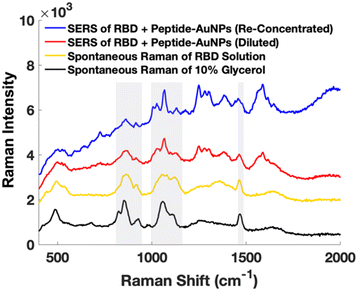
Early attempts using AuNPs treated with protein solution show significant issues with Raman signal from glycerol in the buffer containing the protein (Fig. 4). It is important to ensure that artifactual signals from species such as buffer components are not interpreted as signal from the target molecule. Instead, by centrifuging and removing excess solution from the protein-treated peptide-AuNPs to re-concentrate before measurements, signal from glycerol is minimized in their SERS spectrum (Fig. 4).
In Fig. 5, the handheld SERS signals of AuNPs are compared to previously reported SERS data obtained on a microscope from gold surfaces.22 Notably, after peptide functionalization (Fig. 5A) the AuNPs show preferential enhancement of the 1068 cm−1 phenylalanine band, whereas the surfaces show stronger signal from the 1002 cm−1 phenylalanine band. Unlike the AuNPs, the gold surfaces are backfilled with 2-mercaptoethanol to promote consistent upright peptide orientation, which may explain these signal differences. After treatment with SARS-CoV-2 RBD, the SERS signatures of the nanoparticles and surfaces show similarities as demonstrated in the zoomed in spectral regions (Fig. 5B). An interesting difference is the presence of the tryptophan and amide I bands past 1600 cm−1 in the spectra from the nanoparticles but not the surfaces. Additionally, in the case of the nanoparticles, the CH3 stretching band at 1384 cm−1 is a clear indicator of protein binding, meanwhile this signal is not detected from the surfaces. As previously mentioned, these discrepancies could be due to a difference in the protein orientation with respect to the surface upon binding. Finally, in the nanoparticle spectra, the protein peaks around ∼1450 cm−1 appear on top of signal arising from residual glycerol from the protein buffer that remains after sample re-concentration. In contrast, the surfaces allow for the buffer to be more effectively rinsed away, resulting in clearer protein signal in this region.
The difference in instrument resolution is more evident in the comparisons between handheld and microscope spectra. For instance, in Fig. 5A, the phenylalanine peak at 1002 cm−1 is much narrower in the microscope spectrum. Additionally, in the bottom, far right panel of Fig. 5B, the microscope resolves the 1526, 1556, and 1583 cm−1 peaks, whereas these appear as shoulders in the handheld spectra. These resolution differences do not impact the ability of the handheld assay to differentiate between samples with and without the protein of interest, especially when multivariate analysis is employed.
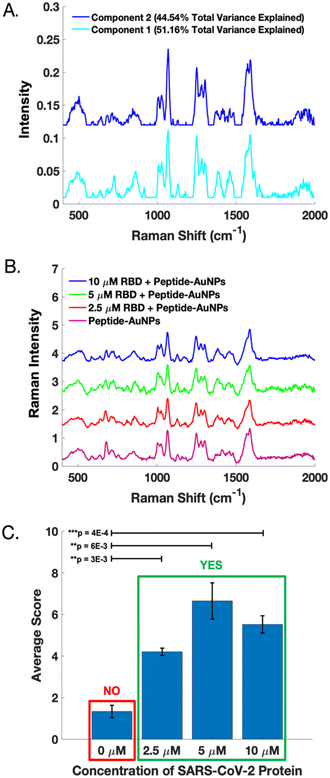
A dataset of handheld SERS spectra from peptide-AuNPs before and after treatment with 10 μM SARS-CoV-2 RBD was used to calibrate a two-component MCR model. The resulting loadings (Fig. 6A) represent the distinct SERS signatures of the peptide-AuNPs before and after protein-binding. These loadings explain 95.70% of the total variance in the data. Importantly, component 1 of the model captures the novel SERS peaks which correspond to the attachment of the protein to the particle.
The MCR model was validated using SERS spectra acquired from peptide-AuNPs treated with different concentrations of RBD on a subsequent day (Fig. 6B). Fig. 6C shows that the protein-treated samples score significantly differently than the untreated peptide-AuNPs on component 1 of the model. These differences are statistically significant based on results of one-tailed t-tests. Notably, the presence or absence of viral protein in a sample can be evaluated by determining its MCR score on component 1 (Fig. 6C). Whether a sample contains protein can also be determined based on the grouping of its scores on a biplot of component 2 vs. component 1 (Fig. S6†). Additional information on calibration, validation, and statistical analysis of the MCR model can be found in the ESI† (Fig. S6).
Although the sensor demonstrates a clear qualitative response to the viral protein, it is unable to discriminate between varying amounts of protein. Attempts at producing a calibration curve reveal a lack of linearity in the response to the amount of protein (Fig. S6†). However, individual MCR scores for the calibration and validation data show that the SERS signals provide diagnostic potential (Fig. S6†). Obtaining quantitative SERS data using these peptide-AuNPs will require further work. One potential strategy would be carefully controlling particle aggregation to ensure even number and distribution of hotspots. Additionally, quantitation might also be improved through incorporation of an internal standard, which has been shown to improve quantification in SERS experiments with nanoparticles.38 Nonetheless, the ON/OFF sensor response achieved here could be sufficient for the purpose of determining whether a patient is infected with a virus.
Lastly, the specifications of the handheld device used in this paper are comparable to many other commercially available handheld Raman spectrometers (Fig. S7†), aside from the unique ORS feature. Given the relatively standard instrumentation used to acquire our data, this sensing method will be broadly accessible even if the availability of equipment varies.
Conclusions
The handheld SERS sensor described here is more affordable and portable than our previously optimized laboratory-based assay using the same antigen-binding peptide. These adjustments greatly increase the accessibility and practical applicability of the sensor, which were the main motivations behind the transition. The work outlined here highlights several important considerations and provides general cautionary advice when translating a SERS sensor from the lab to the field. Knowing how to optimize certain experimental parameters will aid in converting other sensors to point-of-care devices, although each case will present unique challenges. Additionally, with only minor re-optimization, alternative antigen-binding molecules can be developed and substituted for the current peptide to permit the handheld detection of a variety of viruses.Author contributions
Conceptualization, T. D. P., S. J. K., S. H. K., R. F., and Z. D. S; methodology, T. D. P., T. J., and Q. W.; investigation, T. D. P., T. J., and Q. W.; formal analysis, T. D. P.; visualization, T. D. P., S. J. K.; writing, reviewing and editing, T. D. P., S. J. K., S. H. K., R. F., and Z. D. S.; funding acquisition, R. F. and Z. D. S.; resources, R. F. and Z. D. S.; supervision, R. F. and Z. D. S.Conflicts of interest
There are no conflicts to declare.Acknowledgements
This work was supported by the Ohio State University and the University of North Carolina (UNC) at Chapel Hill. RF and ZDS acknowledge financial support from the Research Corporation for Science Advancement. R. F. also acknowledges support from the North Carolina Policy Collaboratory at the University of North Carolina at Chapel Hill with funding from the North Carolina Coronavirus Relief Fund established and appropriated by the North Carolina General Assembly. ZDS acknowledges funding from the National Institutes of Health Award R01 GM 109988. We thank Brian Scarpitti and The Ohio State University's Center for Electron Microscopy and Analysis (CEMAS) for the TEM images. We also thank Peter Harris from the Freeman team for assisting with the illustrations incorporated into the manuscript.References
- T. Ozer and C. S. Henry, TrAC, Trends Anal. Chem., 2021, 144, 116424 CrossRef CAS PubMed
.
- S.-C. Luo, K. Sivashanmugan, J.-D. Liao, C.-K. Yao and H.-C. Peng, Biosens. Bioelectron., 2014, 61, 232–240 CrossRef CAS PubMed
.
- H. Chen, A. Das, L. Bi, N. Choi, J.-I. Moon, Y. Wu, S. Park and J. Choo, Nanoscale, 2020, 12, 21560–21570 RSC
.
-
E. Smith and G. Dent, Modern Raman Spectroscopy- A Practical Approach, John Wiley & Sons, Ltd., England, 2005 Search PubMed
.
- J. Langer, D. Jimenez de Aberasturi, J. Aizpurua, R. A. Alvarez-Puebla, B. Auguié, J. J. Baumberg, G. C. Bazan, S. E. J. Bell, A. Boisen, A. G. Brolo, J. Choo, D. Cialla-May, V. Deckert, L. Fabris, K. Faulds, F. J. García de Abajo, R. Goodacre, D. Graham, A. J. Haes, C. L. Haynes, C. Huck, T. Itoh, M. Käll, J. Kneipp, N. A. Kotov, H. Kuang, E. C. Le Ru, H. K. Lee, J.-F. Li, X. Y. Ling, S. A. Maier, T. Mayerhöfer, M. Moskovits, K. Murakoshi, J.-M. Nam, S. Nie, Y. Ozaki, I. Pastoriza-Santos, J. Perez-Juste, J. Popp, A. Pucci, S. Reich, B. Ren, G. C. Schatz, T. Shegai, S. Schlücker, L.-L. Tay, K. G. Thomas, Z.-Q. Tian, R. P. Van Duyne, T. Vo-Dinh, Y. Wang, K. A. Willets, C. Xu, H. Xu, Y. Xu, Y. S. Yamamoto, B. Zhao and L. M. Liz-Marzán, ACS Nano, 2020, 14, 28–117 CrossRef CAS PubMed
.
- J. Sun, L. Gong, W. Wang, Z. Gong, D. Wang and M. Fan, Luminescence, 2020, 35, 808–820 CrossRef PubMed
.
- C. Song, J. D. Driskell, R. A. Tripp, Y. Cui and Y. Zhao, The use of a handheld Raman system for virus detection, Proc. SPIE 8358, Chemical, Biological, Radiological, Nuclear, and Explosives (CBRNE) Sensing XIII, 2012, p. 83580I, DOI:10.1117/12.918758.
- A. Hakonen, F. Wang, P. O. Andersson, H. Wingfors, T. Rindzevicius, M. S. Schmidt, V. R. Soma, S. Xu, Y. Li, A. Boisen and H. Wu, ACS Sens., 2017, 2, 198–202 CrossRef CAS PubMed
.
- S. K. Gahlaut, D. Savargaonkar, C. Sharan, S. Yadav, P. Mishra and J. P. Singh, Anal. Chem., 2020, 92, 2527–2534 CrossRef CAS PubMed
.
- S. Yadav, S. Senapati, D. Desai, S. Gahlaut, S. Kulkarni and J. P. Singh, Colloids Surf., B, 2021, 198, 111477 CrossRef CAS PubMed
.
- A. Hakonen, K. Wu, M. Stenbæk Schmidt, P. O. Andersson, A. Boisen and T. Rindzevicius, Talanta, 2018, 189, 649–652 CrossRef CAS PubMed
.
- T. Zhang, L. Wu, J. Pei, X. Li, H. Li and F. Inscore, Sensors, 2022, 22, 1778 CrossRef CAS PubMed
.
- H. S. Kim, H. J. Kim, J. Lee, T. Lee, J. Yun, G. Lee and Y. Hong, Anal. Chem., 2021, 93, 14996–15004 CrossRef CAS PubMed
.
- P.-C. Guan, H. Zhang, Z.-Y. Li, S.-S. Xu, M. Sun, X.-M. Tian, Z. Ma, J.-S. Lin, M.-M. Gu, H. Wen, F.-L. Zhang, Y.-J. Zhang, G.-J. Yu, C. Yang, Z.-X. Wang, Y. Song and J.-F. Li, Anal. Chem., 2022, 94, 17795–17802 CrossRef CAS PubMed
.
- S. Yadav, S. Senapati, S. S. Kulkarni and J. P. Singh, J. Photochem. Photobiol., B, 2023, 239, 112629 CrossRef CAS PubMed
.
- E. Zavyalova, O. Ambartsumyan, G. Zhdanov, D. Gribanyov, V. Gushchin, A. Tkachuk, E. Rudakova, M. Nikiforova, N. Kuznetsova, L. Popova, B. Verdiev, A. Alatyrev, E. Burtseva, A. Ignatieva, A. Iliukhina, I. Dolzhikova, A. Arutyunyan, A. Gambaryan and V. Kukushkin, Nanomaterials, 2021, 11, 1394 CrossRef CAS PubMed
.
- D. Antoine, M. Mohammadi, M. Vitt, J. M. Dickie, S. S. Jyoti, M. A. Tilbury, P. A. Johnson, K. E. Wawrousek and J. G. Wall, ACS Sens., 2022, 7, 866–873 CrossRef CAS PubMed
.
- Y. Luo, M. Zhou, C. Fan, Y. Song, L. Wang, T. Xu and X. Zhang, Anal. Chem., 2023, 95, 5316–5322 CrossRef CAS PubMed
.
- A. J. Driscoll, M. H. Harpster and P. A. Johnson, Phys. Chem. Chem. Phys., 2013, 15, 20415 RSC
.
- S. S. Panikar, D. Cialla-May, E. De la Rosa, P. Salas and J. Popp, TrAC, Trends Anal. Chem., 2021, 134, 116122 CrossRef CAS
.
- S. K. Balasubramanian, L. Yang, L.-Y. L. Yung, C.-N. Ong, W.-Y. Ong and L. E. Yu, Biomaterials, 2010, 31, 9023–9030 CrossRef CAS PubMed
.
- T. D. Payne, S. J. Klawa, T. Jian, S. H. Kim, M. J. Papanikolas, R. Freeman and Z. D. Schultz, ACS Sens., 2021, 6, 3436–3444 CrossRef CAS PubMed
.
- G. Frens, Nat. Phys. Sci., 1973, 241, 20–22 CrossRef CAS
.
- Z.-M. Zhang, S. Chen and Y.-Z. Liang, Analyst, 2010, 135, 1138 RSC
.
- A. Ali, E. E. Nettey-Oppong, E. Effah, C. Y. Yu, R. Muhammad, T. A. Soomro, K. M. Byun and S. H. Choi, Biosensors, 2022, 12, 590 CrossRef CAS PubMed
.
- Orbital Raster Scan (ORS™)|Metrohm, https://www.metrohm.com/en/applications/application-notes/raman-anram/an-rs-034.html, (accessed 11 January 2023).
- B. Derjaguin and L. Landau, Prog. Surf. Sci., 1993, 43, 30–59 CrossRef
.
- E. J. W. Verwey, J. Phys. Chem., 1947, 51, 631–636 CrossRef CAS PubMed
.
- Pierce™ TCEP-HCl, https://www.thermofisher.com/order/catalog/product/20490, (accessed 11 January 2023).
- N. Bhatt, P.-J. J. Huang, N. Dave and J. Liu, Langmuir, 2011, 27, 6132–6137 CrossRef CAS PubMed
.
- IPC - ISOELECTRIC POINT CALCULATION OF PROTEINS AND PEPTIDES, https://isoelectric.org/index.html, (accessed 11 January 2023).
- E. Harrison, J. W. J. Hamilton, M. Macias-Montero and D. Dixon, Nanotechnology, 2017, 28, 295602 CrossRef PubMed
.
- H. Wang and Z. D. Schultz, Analyst, 2013, 138, 3150 RSC
.
- G. P. Szekeres and J. Kneipp, Front. Chem., 2019, 7, 30 CrossRef CAS PubMed
.
- S. A. Asher, M. Ludwig and C. R. Johnson, J. Am. Chem. Soc., 1986, 108, 3186–3197 CrossRef CAS
.
- P. Negri and Z. D. Schultz, Analyst, 2014, 139, 5989–5998 RSC
.
- A. Rygula, K. Majzner, K. M. Marzec, A. Kaczor, M. Pilarczyk and M. Baranska, J. Raman Spectrosc., 2013, 44, 1061–1076 CrossRef CAS
.
- R. Goodacre, D. Graham and K. Faulds, TrAC, Trends Anal. Chem., 2018, 102, 359–368 CrossRef CAS
.
Footnote |
| † Electronic supplementary information (ESI) available: Fig. S1–S7 on nanoparticle preparation and stability, comparisons of benchtop to handheld approach, etc. (PDF). See DOI: https://doi.org/10.1039/d3sd00111c |
| This journal is © The Royal Society of Chemistry 2023 |


