Techno-economic-environmental assessment of the integration of power-to-X and biogas utilization towards the production of electricity, hydrogen, methane and methanol
Emanuele
Moioli
 * and
Tilman
Schildhauer
Energy and Environment Division, Paul Scherrer Institute, Forschungstrasse 111, Villigen, Switzerland. E-mail: emanuele.moioli@psi.ch
First published on 12th April 2023
Abstract
The valorisation of biogas is a key element of the circular economy. This study provides an integrated techno-economic-environmental analysis of the most common technologies for the integration of biogas valorisation in the energy system. This involves both the use of biogas in the production of electricity and chemicals and the use of biogenic CO2 as a source for power-to-X. In this latter case, biogas can be seen as a platform for electricity or H2 storage. The study helps in understanding the most suitable product for biogas valorisation, according to the boundary conditions set by the energy sector. Two different cases were considered: when electricity, methane or methanol are directly produced from biogas and when biogas is used to seasonally store renewable electricity, taking advantage of the oscillations in the electricity price. It was found that methanol is the most profitable product from biogas, thanks to the high value of this chemical. Methanol synthesis is profitable for a biogas price up to 0.09 € per kW h, while methane production shows a positive income up to a biogas price of 0.08 € per kW h. When considering the use of biogas in energy storage, it was found that methane is the best carrier for electricity storage, while methanol is the best storage medium for H2. The average electricity production price is 0.18 € per kW h using methane as the storage molecule, while this value is in the order of 0.20 € per kW h for methanol. When looking at H2 production price, it was observed that the route via methane originates costs of 0.15 € per kW h, but the methanol route is less expensive at 0.14 € per kW h. This study shows that the selection of the most suitable pathway for valorisation of biogas should carefully account for the boundary conditions of the energy system, considering the needs of the final users. The flexible combination of upgrading and power-to-X opens the way for broader potential of biogas use.
1 Introduction
One of the main current challenges for mankind is material loop closing, leading to a circular economy. Currently, an important share of the waste produced is sent to landfills or anaerobic digestion plants. This leads to significant environmental concerns linked to gas emissions from these plants.1 However, the product gas from these plants can be valorised in several ways, leading to the reutilisation of the original carbon coming from the waste feedstock. Biogas coming from anaerobic digestion (AD) generally contains methane (30–70% CH4), carbon dioxide (30–70% CO2), and other impurities such as hydrogen sulphide (0–2000 ppm H2S).2 For the full utilization of biogas, it must be cleaned and processed to obtain a product gas with an acceptable heating value. This can be performed in principle in two ways: either by removing CO2 from the stream or by using CO2 in the production of valuable products.3The most common way to valorise biogas is through combustion to generate electricity and heat. This process is commonly referred to as combined heat and power production (CHP).4 The development of this technology was fostered by its simplicity of use and by significant incentives, allowing the sale of the products at a preferential rate.5 However, the CHP technology is affected by a moderate efficiency due to significant heat losses (up to 40%)3 and it is profitable only with appropriate economic incentives. For this reason, several researchers focused on the search for alternative routes to valorise biogas.
One of the possible routes for biogas valorisation is biogas upgrading. Under this definition all the technologies aimed at purifying biogas from CO2 are collected. The product is a concentrated methane stream often referred to as biomethane. CO2 separation can be performed by chemical or physical processes, i.e. by scrubbing, pressure swing adsorption or membrane separation.6 The main advantages of this technology are related to its high efficiency and to the production of an energy carrier that can be directly injected into the existing infrastructure (i.e. into the gas grid) and can eventually be stored in compressed form (compressed natural gas, CNG).7 However, this technology is affected by significant CO2 emissions (due to the release of the CO2 contained in biogas). Hence, several recent studies proposed the utilization of this biogenic CO2 to produce valuable products.8 An appropriate management of biogenic CO2, connected with capture and storage, can also lead to negative CO2 emissions.9 The largest focus of research lies in the coupling of biogas upgrading and power-to-X (PtX), which means the reaction of biogenic CO2 with renewable H2 produced from renewable energy, with the aim of synthesizing valuable products.10
A possible target process in this direction produces additional methane from CO2 and H2. This reaction is referred to as CO2 methanation or the Sabatier reaction and follows the following stoichiometry:
 | (1) |
The reaction can be performed either by thermochemical11 or biological routes.12 An appropriate reactor design can allow high methane yield.13 The profitability of this process depends on several factors, such as the electricity price, the operation hours and the product value.14,15 The Sabatier reaction has been employed in biogas valorisation in several demonstration projects.9
A second possible CO2 valorisation route is the production of methanol. This follows the reaction:
 | (2) |
The reaction is exploited mainly by a thermochemical route.16 This process was demonstrated in some projects in the context of non-biogenic CO2 utilisation.17 Another option for methanol production concerns biogas reforming to produce syngas, followed by standard methanol synthesis.18 The main advantages of methanol production lie in the storage of the product in liquid form (i.e. without need for special infrastructure) and in the various possible uses of methanol. However, methanol synthesis is challenging, due to stringent thermodynamic limitations, which generally require high pressure for the reaction.19
In this framework, some studies are available in the literature comparing biogas upgrading and methanation or the production of various chemicals.15,20–22 This study aims at specifically comparing the valorisation of biogas towards production of electricity, methane or methanol. To the best of our knowledge, such a systematic study is currently missing in the literature. Methane and methanol are selected as products, as their production processes have been demonstrated in various research projects and hence show the highest TRL among the possible products from biogas.9 Additionally, this study focuses on the flexibility aspects of biogas valorisation combined with PtX. Some studies are available in the literature, addressing the use of biogas in energy storage.23–25 This paper shows instead how various routes can adapt to the availability of (cheap) renewable electricity and can contribute to the supply of clean electricity and H2 when renewable energy is scarce. This study contributes to shedding new light on the most favourable biogas valorisation routes to follow according to the boundary conditions.
On the basis of what has been elucidated so far, the study verifies three scientific hypotheses to understand the most appropriate biogas valorisation routes. First, the hypothesis of using biogas in the direct production of a specific product is formulated. To determine the production route generating the highest benefit to the producer, CHP, methane (via upgrading or the thermal Sabatier process) and methanol production (via biogas reforming or synthesis from biogenic CO2) are compared without considering a specific utilization of the product. As performance indicators, process efficiency, direct and equivalent CO2 emissions and economic performance are considered. In the second part of the study, specific hypotheses are formulated about the use of the energy carrier. These consist in the production of electricity or H2 from stored fuels when renewable electricity is scarce. According to fuel production/reforming patterns, the production price of electricity or H2 during energy scarcity times is determined. In this case, CO2 emissions and economic performance indicators are used to determine the optimal process configuration to store electricity or hydrogen with the help of biogenic CO2 available in biogas.
2 Methodology
This work focuses on the investigation of several alternative processes for the valorisation of biogas, with and without coupling with power-to-X. The size of the plant corresponds to a biogas production of 200 Nm3 h−1. Cleaned biogas is used as a feedstock, with a composition of 60% vol. of CH4 and 40% vol. of CO2. This composition was selected because it is the most representative of common biogas production processes (e.g. from sewage sludge and from agricultural waste).5,26 An increase in CH4 content in the biogas results in an increase in the process profitability. A summary of the considered processes is reported in Table 1. Here, it is possible to recall all the abbreviations used and the main parameters of each process. The processes are divided according to the main target product (electricity, methane or methanol) using the colour code. Furthermore, they are divided into standard (operating in the same mode all year) and flexible processes (changing the target product according to electricity price, in bold). Power-to-X strategies are not operated during the entire year to avoid the purchase of too expensive electricity. All the processes are described in detail in the next section.| Short name | Long name | Input | Output | Operation hours (h year−1) | Reference figure |
|---|---|---|---|---|---|
| CHP | Combined heat and power production | Biogas | Electricity | 8000 | Fig. 1 |
| Upg. | Upgrading | Biogas | Biomethane | 8000 | Fig. 2 (straight arrows) |
| Meth. + Upg. | Methanation and upgrading | Biogas and electricity | Biomethane | 6000 methanation and 2000 upgrading | Fig. 2 (dashed arrows) |
| Meth. + CHP | Methanation and CHP | Biogas and electricity | Biomethane and electricity | 6000 methanation and 2000 CHP | N/A |
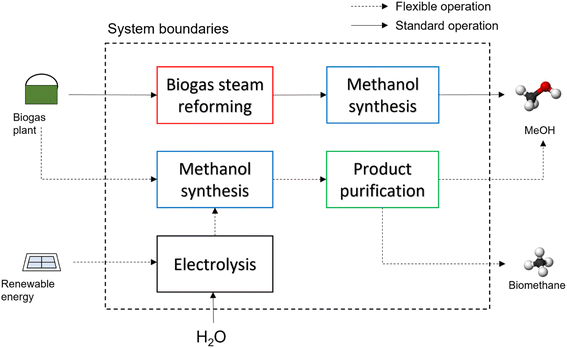
| MeOH via SR | Methanol synthesis via biogas steam reforming | Biogas | Methanol | 8000 | Fig. 3 (straight arrows) |
| MeOH from H 2 + upg. | Methanol synthesis with electrolysis and upgrading | Biogas and electricity | Methanol and biomethane | 6000 methanol and 2000 upgrading | Fig. 3 (dashed arrows) |
| MeOH from H 2 + CHP | Methanol synthesis with electrolysis and CHP | Biogas and electricity | Methanol and electricity | 6000 methanol and 2000 CHP | N/A |
2.1. Process description
The study analyses the above-mentioned processes according to two categories:•Processes aimed at energy carrier production.
•Processes aimed at energy storage (production of electricity or H2 when renewable energy is scarce).
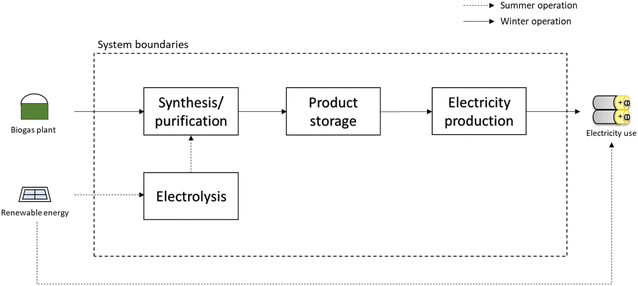
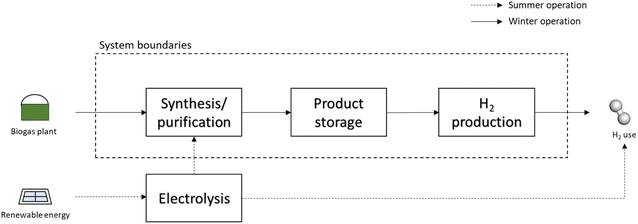
In the first category, the process goal is the production of an energy carrier (i.e. electricity, methane or methanol). This carrier is then placed on the market. In the second category, the final use of the energy carrier is considered. Hence, the target product is either electricity or H2, to be placed on the market only when their value is high (i.e. in energy scarcity). In the latter configuration, the energy carriers are therefore produced when excess electricity is available (i.e. in energy abundance) and they are converted to electricity or H2 when a specific demand for these is present. The processes are described according to this categorization.
| ECHP = ηCHP × QBio × HHVBio | (3) |
 | ||
| Fig. 1 Schematic representation of combined heat and power (CHP) production: independently from renewable energy availability, biogas is combusted to produce electricity. | ||
The capital cost is accounted for as follows:
| CCHP =CC × ECHP | (4) |
C CHP is the total installation cost of a CHP system and CC is the average cost of a new CHP system per kW h. This mathematical relationship is based on real market data recorded by the US Department of Energy.29 Reference CAPEX and OPEX values are reported in Table 2. The annual operation and maintenance costs are accounted for as 5% of the installation cost. The heat value is set to 0.02 € per kW h, an average between a high value in winter and low value in summer.
| Cost (from ref. 29) | |
|---|---|
| OPEX | 0.01–0.025 (€ per kW h) |
| CAPEX | 1400–2900 (€ per kW installed) |
| PBM = ηmet × QBio × (HHVBio − Pug) | (5) |
| Pug = Pop + Pcomp | (6) |
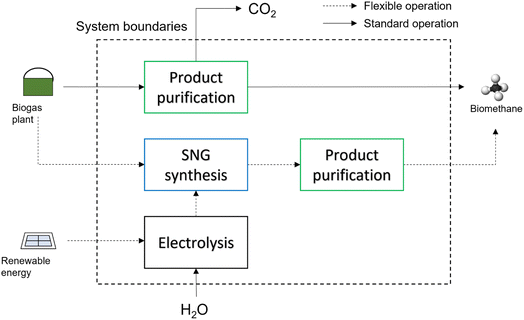 | ||
| Fig. 2 Biomethane process chain: biogas is either purified from CO2 or it is used for SNG synthesis, when renewable energy is available. | ||
P op accounts for the methane losses in the operation (methane lost with the CO2-rich stream). Pcomp considers efficiency losses The efficiency values are reported in Table 3. The installation cost of the water scrubbing system is calculated according to ref. 31. The capital cost includes the scrubbing unit, the compressor and the post treatment units. The operative costs include the biogas cost, the process water, electricity and operation and maintenance (corresponding to 5% of the investment costs). Typical OPEX and CAPEX are reported in Table 4.
| Efficiency term | Value | Source |
|---|---|---|
| P op (kW h m−3) | 0.3 | 30 |
| η met (mout3 min−3) | 0.98 | 31 |
| P comp (kW h m−3) | 0.32 | 3 |
| Cost | |
|---|---|
| CAPEX pressurised water scrubber | 5000–6000 € per (m3 per h biogas) |
| OPEX pressurised water scrubber | 0.1-0.2 € per (m3 per h biogas) |
| CAPEX electrolyser | 1200 € per kW installed |
| CAPEX methanation system (incl. ancillaries) | 10![[thin space (1/6-em)]](https://www.rsc.org/images/entities/char_2009.gif) 000–12000 € per (m3 h−1 biogas) 000–12000 € per (m3 h−1 biogas) |
| OPEX methanation (incl. electricity) | 0.7–0.8 € per (m3 per h biogas) |
The flexible process operates alternatively through biogas upgrading or SNG synthesis, according to the electricity price. We assumed that the operation hours of the SNG mode are 6000 h year−1. This number was obtained by considering the hours where the secondary energy price in Switzerland was below 0.05 € per kW h in 2019.32 The number of hours was determined by including a reasonable amount of intermediate storage units (battery and tank) for peak-shaving purposes. Due to the high electricity price during the remaining part of the year, a continuous operation of the methanation upgrading system is not feasible. Hence, to avoid flaring the biogas when electricity is expensive, an additional upgrading unit is needed. When this unit is in operation, the system functions in the biogas upgrading mode, producing biomethane and removing the excess CO2. In this case, biogas upgrading is operated with a membrane, so that significant synergies between the methanation reactor and the upgrading section are possible, with the membrane operating either as an upgrading unit or as an SNG purification device, removing both CO2 and H2 in excess.33 The electrolyser is modelled with an efficiency model, considering an HHV-based efficiency to H2 of 70%.14 The CO2 methanation reactor is modelled with a 1D-pseudo-homogeneous model, with the intraphase diffusional limitations accounted for with the Thiele modulus method. This model satisfactorily describes the operation of the system.34 The catalyst considered is Ni/Al2O3 as per the kinetic model by Koschany et al.35 The computational details of the model are reported in the Appendix. The membrane section is dimensioned according to experimental data.33 The equipment cost is calculated on the basis of the dimensions determined in the modelling phase. The capital cost is accounted for as follows:
| CBM,k = Cpur × FBM, with FBM = f(FM,FP) | (7) |
 | (8) |
The CEPCI index  is 1.548 (value for January 2019). The total plant cost factor (FPC) is 1.13. For the installation costs, electrolyser, reactors, compressors, membranes and auxiliary units were considered. The operative costs include biogas, electricity, process water, operation and maintenance (2.5% of the installed cost of the electrolyser and 5% of the remaining units). The average CAPEX of the methanation system is reported in Table 4.
In addition to the flexible process, this study also addresses the possibility of coupling SNG synthesis (abundance mode) with CHP (scarcity mode). This case is representative of the retrofitting of a biogas plant already equipped with CHP, to which a methanation reactor is added to turn it into an energy storage system. In this case, CHP and methanation sections are evaluated according to the relative methodologies explained above.
 | (9) |
Followed by the methanol synthesis according to eqn (2), this operation is performed throughout the entire year and the only input is biogas. Biogas reforming to methanol is envisaged as a promising valorisation pathway, as reported in various studies.18,38,39 The biogas reformer is modelled with a 1D heterogeneous reactor model, considering a Ni-based catalyst, and simulated with the kinetic model by Xu and Froment.40 The purchase cost of the reformer is calculated according to ref. 41. The methanol synthesis section is modelled with a 1D pseudo-homogeneous model over a Cu/ZnO/Al2O3 catalyst and modelled with the kinetic model by Vanden Bussche and Froment.42 The computational details of the reactor models are reported in the Appendix. On the basis of the calculated volumes and mass balances, the capital and operative expenditures are accounted for with the same methodology used in the biomethane case.
In the flexible operation, when cheap electricity is available, the CO2 contained in biogas is used in the methanol synthesis section, after addition of H2 produced in an electrolyser.43 Methanol is produced in the standard process, as alternative solutions are not mature enough yet.44 In this case, methanol and methane are co-produced. When cheap electricity is not available, the biogas is upgraded to biomethane in a membrane system. The selection of the operation hours in the two cases follows the same assumptions as in the biomethane case. The methanol reactor is modelled in the same way as in the standard process and the membrane section is evaluated as in the biomethane case.
As a last comparison, the plant combining methanol synthesis (abundance mode) and CHP (scarcity mode) was considered. As in the SNG case, this example is representative of the retrofitting of a biogas plant already equipped with CHP, to which a methanol reactor is added to operate in energy storage mode with cheap electricity. CHP and methanol synthesis sections are evaluated according to the relative methodologies explained above.
An analogous process to produce H2 in the scarcity of renewable energy is shown in Fig. 5. Here, the excess renewable energy is completely consumed in the electrolysis stage to produce H2. This is the pathway to provide H2 to the consumer when large amounts of electricity are available. Part of the H2 produced is used in the biogas plant to produce methane or methanol, which is then stored. When the renewable energy is not sufficient to produce H2via electrolysis, the energy carriers are reformed and the required H2 is obtained. The reforming is operated in a centralized large-scale unit, which is modelled as described in Section 2.1.1. The heat required for the operation is obtained by combustion of part of the feed. As in the previous case, the cost of the reformer is not considered here, but the results obtained represent the cost per kW h of H2 produced that the operator of the reforming unit (i.e. the H2 distributor) has to pay to the biogas plant to purchase the energy carrier.
2.2. Technical indicators
The main performance indicators are defined as follows.CO2 conversion:
 | (10) |
Methanol yield:
 | (11) |
CH4 yield:
 | (12) |
The process efficiency is defined as:
 | (13) |
2.3. Economic indicators
To assess the economic performance of the processes, the discounted cash flow was calculated considering a discount rate of 6% and a plant lifetime (a) of 15 years. With these values and from the installation cost of the equipment, it is possible to determine the capital expenditure (CAPEX): | (14) |
Several economic indicators were used according to the specific needs of the analysis. The biogas break-even price is the price of biogas for which the net present value (NPV) of various solutions equals zero. Hence, the formula is:
 | (15) |
| Rt = Income − OPEX − CAPEX | (16) |
The production cost (Cprod) is defined as:
 | (17) |
| Gp = Eprod − CProd × Pprod | (18) |
| Item | Price (€ per kW h) |
|---|---|
| Biogas | 0.06 |
| Biomethane | 0.12 |
| Biomethanol | 0.20 |
| Electricity (abundance) | 0.05 |
| Electricity (scarcity) | 0.20 |
| Hydrogen (scarcity) | 0.15 |
3 Results and discussion
The results of the techno-economic assessment are elucidated in two different sections, according to the time perspective of the analysis:•all-year operation and sale of the final products of biogas valorisation;
•use of biogas for seasonal storage and sale of products for electrification/H2 production.
In the former case, the results are determined based on the direct use of the biogas valorisation products (e.g., as fuels for mobility). In the latter case, the results depend on the operation time of energy storage, concentrating the sale of the final products (electricity or H2) in the period of the year when electricity production from renewables is limited.
3.1. Biogas valorisation in various products
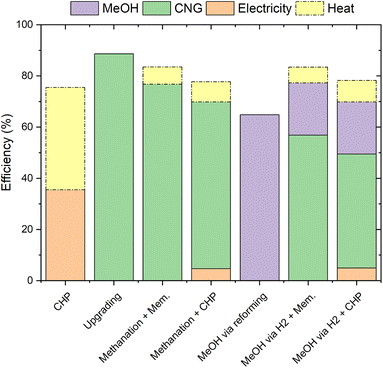
The efficiency values of the various process configurations for biogas valorisation analysed are reported in Fig. 6. The total efficiency is divided into the fractions obtained from the various products (electricity, compressed natural gas and methanol). Additionally, the fraction of the input that is converted into usable heat is shown in the dashed area. CHP has the lowest efficiency (ca. 35%), because of the relatively low effectiveness of the internal combustion engine used in the biogas valorisation.28 In fact, an important part of the biogas (more than 40%) is converted into heat that can be further used in several applications.4 However, the economic valorisation of this heat is challenging, especially when the heat demand is low (e.g. in summer).The highest efficiency value (ca. 88%) is found with biogas upgrading. This is due to the low amount of energy required in this process and to the low product losses. Additionally, this process configuration does not produce significant waste heat. The methane production via PtG shows a lower efficiency value (ca. 76%). In this case, the decrease in efficiency is due to the energy losses in the electrolyser. Note that the result is a combination of the operation hours in CO2 methanation mode and in upgrading using the membrane (i.e. with efficiency similar to that in the previous case). The combination of biogas methanation and CHP shows an even lower efficiency value (ca. 70%), because of the low efficiency of the CHP operation. An advantage of this process configuration is the production of heat and electricity only during times of high electricity price, hence following market demand.
With regards to methanol production, one can observe that the synthesis via steam reforming is significantly less efficient (ca. 65% efficiency) than the processes yielding methane. This is due to the large energy losses in the reforming stage, required to produce H2 from syngas.18 In this configuration, no waste heat is produced, as the entire process is integrated to efficiently use the heat generated by biogas combustion. The methanol production from CO2 and renewable H2 shows higher efficiency with a value of ca. 77%. Compared to the production via steam reforming, this pathway is more efficient. This is thanks to the higher H2 production efficiency of the electrolyser than of the reformer unit. The performance of the methanol synthesis is slightly higher than that of the methanation process due to the better efficiency of the synthesis reaction (the former is less exothermic than the latter).19 As in the methane case, the flexible process coupled with CHP shows a lower efficiency (ca 70%), because of the low efficiency to electricity of this latter operation mode.
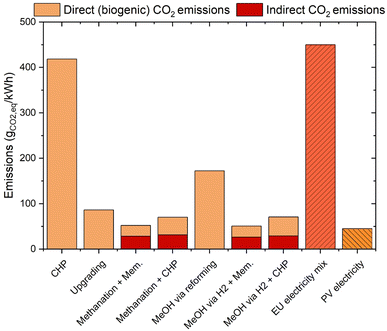
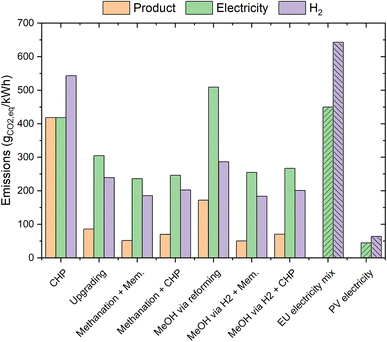
For a better comprehension of the performance of the various processes, the efficiency results should be integrated with the details on CO2 emissions. The results of the calculations aimed at determining this factor are shown in Fig. 7. This figure shows the CO2 emissions generated in the process to produce 1 kW h of the final product (electricity, biomethane or biomethanol) from biogas. Standard processes have a limited requirement for external electricity; therefore, they mainly generate biogenic CO2 emissions. Flexible processes generate significant indirect emissions (from the electricity production). The data should be compared with the emissions of the standard EU electricity mix (ca. 450 gCO2 kW−1 h−1)48 and with the CO2 footprint from photovoltaics (ca. 45 gCO2 kW−1 h−1 equivalent).47 Furthermore, it should be considered that the CO2 emitted in the biogas valorisation comes from a renewable source (e.g. agricultural waste or wastewater). CHP shows the worst performance, due to the total combustion of the biogas inlet. This technology accounts for ca. 400 g of CO2 per kW h of the product. Biogas upgrading is affected by the significant amount of CO2 that is emitted as a waste stream, hence producing ca. 90 gCO2 kW−1 h−1. The utilization of this CO2 in the methanation reaction significantly reduces the carbon footprint of the flexible processes combined with membrane upgrading and CHP. The former accounts for a production of ca. 50 gCO2 kW−1 h−1, while the latter emits ca. 70 gCO2 kW−1 h−1. This improved performance mainly originated from the utilisation of renewable energy to avoid CO2 emissions. Hence, most of the CO2 emissions are due to the indirect footprint of electricity generation, as shown in Fig. 7 (red bars). The carbon footprint of methanol production via steam reforming is significantly worse than that in the biogas upgrading case, due to CO2 emissions in the reformer. Therefore, one can observe that the total CO2 emissions of this process configuration are ca. 170 gCO2 kW−1 h−1. The process configurations producing methanol via PtX show instead a carbon footprint that is really close to that in the methanation case (ca. 50 gCO2 kW−1 h−1 for the methanol/membrane configuration and ca. 70 gCO2 kW−1 h−1 for the methanol/CHP configuration). Hence, biogas upgrading is the best performing technology in the context of standard biogas valorisation processes, while the production of methane or methanol is substantially equivalent in terms of the carbon footprint in the context of flexible biogas utilization. The results obtained in these calculations confirm what was observed in the literature for PtG biogas valorisation.49,50 Note that CO2 sequestration with a standard CCS technique would require ca. 350 kW h/tCO2 (ref. 51) (including sequestration and compression), hence originating an electricity demand of ca. 440 MW h year−1 to sequester the entire CO2 content of the biogas source considered here. This corresponds to ca. 2% of the total CO2 content of the biogas. As an example, this results in a total of ca. 3 gCO2 kW−1 hprod−1 in the case of biogas upgrading. Hence, there is large potential to alternate the valorisation of biogenic CO2 in biofuels when large amounts of renewable energy are available with the capture and storage of excess CO2 in biomethane production (i.e. BECCS), when the renewable energy is scarce.
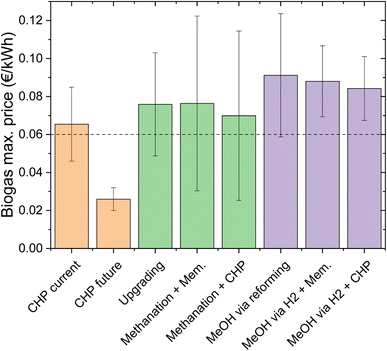
Fig. 8 reports the results of the economic assessment of the various technologies. The results are summarized in terms of the biogas production cost that causes the net present value to equal zero (considering 15 years of plant lifetime and a 6% interest rate). The error bar represents the variation in the product price (the most influential parameter) of ±20 percentage. The dashed line represents a reference biogas price, calculated on the basis of the feed-in tariffs for electricity from biogas (0.06 € per kW h).14 CHP was considered in two different cases: the current conditions, where electricity is supported with a price of 0.20 € per kW h all year and a possible future case, where electricity must be sold in the electricity market (i.e. with low price due to large renewable electricity production). The biogas cost for the current CHP is slightly above 0.06 € per kW h, confirming the assumptions made on the biogas to electricity process. However, a change in the boundary conditions would cause a significant decrease in the economic performance of the CHP system, causing a drop in the maximum biogas price to ca. 0.025 € per kW h. This particularly low value would make it economically unfeasible to produce electricity from most of the existing biogas plants. This result reflects the trend in act in several countries that are incentivising a more efficient and flexible biogas valorisation strategy, causing a decrease in the number of CHP plants installed.52
The break-even biogas price for biogas upgrading is ca. 0.075 € per kW h. This result is in line with what was reported in several studies.5,22,30,31,53 This shows the important potential of this technology, which may become the reference process for standard biogas valorisation in the near future. In fact, in addition to better profitability of this technology compared to CHP, the production of biomethane has a positive influence on the flexibility of the energy system, as the final product does not need to be consumed at the same time as it is first available. However, this flexibility aspect is further enhanced in the coupling of biogas upgrading and CO2 methanation. In this case, the system would not only have a passive influence on the energy system (avoiding the injection of further electricity when this is already in excess), but it would actively participate in the stabilization of the electricity grid, by consuming electricity when this is available in excess. This view is confirmed by the results of the economic calculations. In fact, the break-even biogas price is slightly higher than that in the biogas upgrading case, thanks to this additional energy storage effect. This effect was recognized in several studies in the past.14,54–56 However, the extent of this advantage should be confirmed by a detailed analysis of the boundary conditions that make it possible. For this purpose, a sensitivity analysis was performed, as shown in Fig. 9. Fig. 9a reports the sensitivity analysis results for the variation in the product price. It can be observed that the equivalence point of upgrading and flexible methanation is at 0.118 € per kW h of the methane value. Additionally, the graph shows that the flexible methanation is more sensitive to the product price than upgrading (larger slope of the curve). This is due to the higher productivity of the flexible process. The sensitivity over the electricity price (Fig. 9b) shows a different trend, as biogas upgrading requires a limited amount of electrical power for the operation. Therefore, this process is relatively insensitive to the electricity price, while the profitability of the flexible process is strongly dependent on the electricity price. The equivalence point of the two processes lies at 0.051 € per kW h. These results show how a slight decrease in the electricity price during the energy storage phase would significantly favour flexible operation over standard biogas upgrading. This confirms the hypothesis formulated in the literature that the market for energy storage solutions may increase significantly already in the near future.56
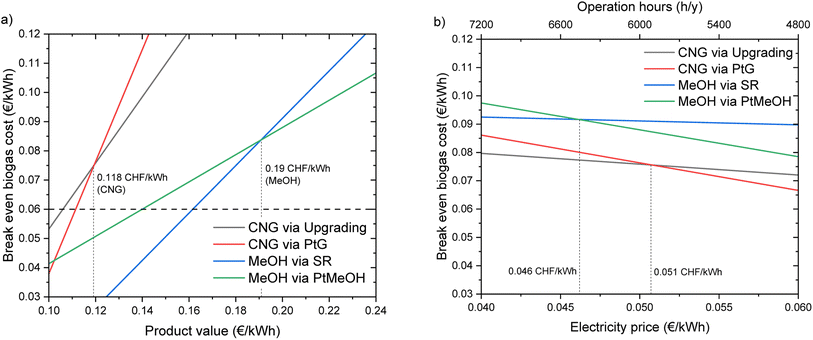 | ||
| Fig. 9 Sensitivity analysis of the economic assessment for CNG and methanol production: (a) sensitivity to the product price; (b) sensitivity to the electricity price. | ||
The break-even biogas price for methanol production via biogas steam reforming is 0.091 € per kW h. This is the highest value found in this study, thanks to the high value of the product and the cheapest way to produce the required H2. However, as explained above, this solution also has a significant carbon footprint, which makes it less desirable from an environmental point of view. The results of the analysis of this process option are in line with those of the techno-economic assessment of similar plants available in the literature.38,57–59 Methanol production via PtMeOH is slightly less profitable than the previous process, due to the higher cost of H2 from electrolysis. Hence, the break-even biogas price lies at 0.088 € per kW h, a significantly higher value than that of the biomethane production processes. The assessment of this process configuration yields similar results to the biomethanol production route described by Baena-Moreno et al.,60 despite the different integration of upgrading and methanol synthesis. A deeper comparison of the two methanol production processes is possible thanks to the sensitivity analysis reported in Fig. 9. The equality point of the two configurations lies at 0.19 € per kW h for the methanol value and at 0.046 € per kW h for the electricity price. Interestingly, the process via steam reforming is more sensitive to the methanol process than the process via PtMeOH. This is due to the important difference in productivity, in favour of the latter configuration. Methanol synthesis via biogas steam reforming is practically insensitive to the change in electricity price, because the electricity requirements in this process are limited. From this analysis, one can conclude that a clear trade-off exists between cheap and green methanol. The profitability of the process decreases significantly with the decrease in CO2 emissions. This directly reflects the trade-off already present between green and grey H2.61
3.2. Use of biogas for H2 or electricity storage
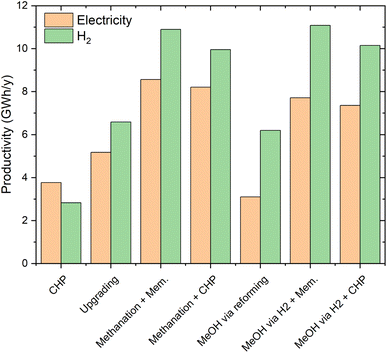
The analysis performed so far has involved the direct valorisation of biogas into various products, without considering the final use of the energy carriers. In this section, the possible utilization of the products is analysed. This analysis is essential in the context of the energy storage processes, where the energy carriers need to be converted back to electricity or H2 when electricity is scarce.Fig. 10 shows the electricity/H2 production cost. The cost of electricity production from CHP and the relative cost of H2 produced from the same electricity are reported as references. These are 0.20 and 0.27 € per kW h, respectively. For a better discussion of these results, Fig. 11 reports productivity in terms of GWh of electricity or H2 per year of the various technologies.
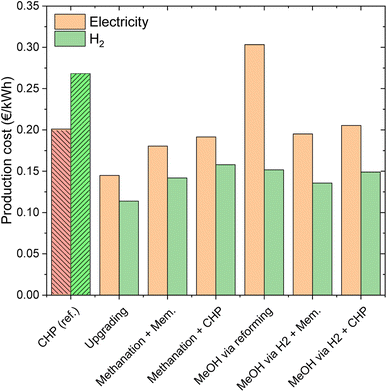 | ||
| Fig. 10 Calculated production costs of electricity and H2 when the selected biogas valorization processes are used for energy storage. | ||
Biogas upgrading is the best technology in terms of production cost for both outputs. The production costs are 0.14 € per kW h for electricity and 0.11 € per kW h for H2. The cost of electricity production is higher than the cost of H2 production for all the energy storage processes because the reforming efficiency is significantly higher than the efficiency of electricity production. The production cost of the flexible configuration upgrading/methanation is 0.18 € per kW h for electricity and 0.14 for H2. These significantly higher costs for the flexible over the standard process reflect the intrinsic cost of energy storage. This is related to the significant amount of electricity that is used in the production of the synthetic fuel. In fact, the additional amount of product obtained in the energy storage mode is sensibly more expensive, resulting in a higher total production cost per kW h. The production costs of the flexible process CHP/methanation are slightly higher (0.19 € per kW h for electricity and 0.16 € per kW h for H2), due to the higher specific cost of CHP over biogas upgrading.
The results are significantly different for the methanol case. The cost of producing electricity in the case of standard methanol production from biogas is high (0.21 € per kW h). This is due to the low productivity (lower than that in the CHP case, as visible in Fig. 11) and to the low efficiency of the methanol to electricity process. The production costs of H2 are significantly lower (0.15 € per kW h), thanks to the efficient methanol steam reforming. The economic performance of the flexible upgrading/methanol synthesis process is superior, with 0.19 € per kW h and 0.135 € per kW h for electricity and H2, respectively. The significantly better performance in electricity storage is related to the larger output of the system and to the important share of methane in the products (hence ensuring a better efficiency). The production cost of H2 is lower than that in the standard biogas to methanol process, thanks to the better process efficiency (see Fig. 6), leading to a higher productivity (ca. 78% higher, as visible in Fig. 11). Note that the trends are reversed compared to the biomethane case, because H2 production is necessary for both the standard and the flexible methanol processes. The flexible CHP/methanol synthesis process is slightly more costly than the flexible biogas upgrading/methanol synthesis route. The production costs in this case are 0.20 € per kW h and 0.15 € per kW h for electricity and H2, respectively. As in the biomethane case, these slightly worse results originated from the lower performance of CHP over biogas upgrading.
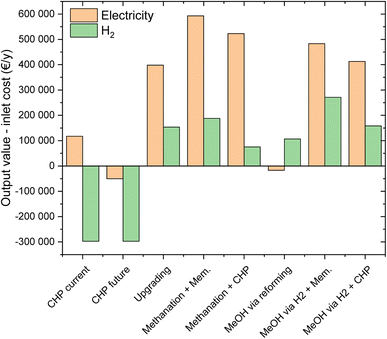 | ||
| Fig. 12 The potential benefit of the utilization of the various integrated biogas valorisation/PtX processes for electricity or H2 storage. | ||
Under the current conditions, characterized by significant all-year operation incentives, biogas valorisation via CHP generates profit, corresponding to ca. 100![[thin space (1/6-em)]](https://www.rsc.org/images/entities/char_2009.gif) 000 € per year, according to the assumptions elucidated above. The results for different market conditions, hence with an oscillation between low electricity price when renewable electricity is abundant and high price in energy scarcity, are significantly different. In this case, CHP would not deliver profits, but generate a loss of about 50
000 € per year, according to the assumptions elucidated above. The results for different market conditions, hence with an oscillation between low electricity price when renewable electricity is abundant and high price in energy scarcity, are significantly different. In this case, CHP would not deliver profits, but generate a loss of about 50![[thin space (1/6-em)]](https://www.rsc.org/images/entities/char_2009.gif) 000 € per year. This underlines the possibility that operation of CHP would be significantly damaged from a change in the legal framework, modulating the incentives according to electricity demand/offer profiles (tab CHP future). In the case of H2 production from this electricity, the calculations show a significantly negative balance, with a value of ca. −300
000 € per year. This underlines the possibility that operation of CHP would be significantly damaged from a change in the legal framework, modulating the incentives according to electricity demand/offer profiles (tab CHP future). In the case of H2 production from this electricity, the calculations show a significantly negative balance, with a value of ca. −300![[thin space (1/6-em)]](https://www.rsc.org/images/entities/char_2009.gif) 000 € per year. This is due to the high production cost of H2 originating from the low efficiency of the consecutive biogas combustion and electrolysis steps. This limitation was discussed in the literature, suggesting instead the use of steam reforming for H2 production from biogas.62 However, this case is used as a reference in this study to represent the use of electricity from CHP to operate an electrolyser when network electricity is scarce. In fact, the purchase of a biogas-reforming unit to operate for such a limited time would be too costly.
000 € per year. This is due to the high production cost of H2 originating from the low efficiency of the consecutive biogas combustion and electrolysis steps. This limitation was discussed in the literature, suggesting instead the use of steam reforming for H2 production from biogas.62 However, this case is used as a reference in this study to represent the use of electricity from CHP to operate an electrolyser when network electricity is scarce. In fact, the purchase of a biogas-reforming unit to operate for such a limited time would be too costly.
In the case of biogas valorisation into biomethane, the reference case is given by biogas upgrading. With this technology, the profitability is significantly higher than that from CHP. In fact, the possible profits from electricity and H2 production are 400![[thin space (1/6-em)]](https://www.rsc.org/images/entities/char_2009.gif) 000 and 150
000 and 150![[thin space (1/6-em)]](https://www.rsc.org/images/entities/char_2009.gif) 000 € per year, respectively. The higher performance originated from the higher efficiency and from the better adaptation to market demand (thanks to the possibility to store methane). Better profitability is obtained by taking advantage of the price oscillations by using the biogas plant as an active energy storage unit. This is well visible in the results of the flexible methanation operation, where the profit in electricity production is 600
000 € per year, respectively. The higher performance originated from the higher efficiency and from the better adaptation to market demand (thanks to the possibility to store methane). Better profitability is obtained by taking advantage of the price oscillations by using the biogas plant as an active energy storage unit. This is well visible in the results of the flexible methanation operation, where the profit in electricity production is 600![[thin space (1/6-em)]](https://www.rsc.org/images/entities/char_2009.gif) 000 € per year and the profit in H2 production is 200
000 € per year and the profit in H2 production is 200![[thin space (1/6-em)]](https://www.rsc.org/images/entities/char_2009.gif) 000 € year. Note that this process appears to be the most appropriate among the technologies analysed here for energy storage towards electricity production. The results of the calculations for the flexible CHP/methanation show that the potential profit is significantly lower than that of the flexible upgrading/methanation, with 520
000 € year. Note that this process appears to be the most appropriate among the technologies analysed here for energy storage towards electricity production. The results of the calculations for the flexible CHP/methanation show that the potential profit is significantly lower than that of the flexible upgrading/methanation, with 520![[thin space (1/6-em)]](https://www.rsc.org/images/entities/char_2009.gif) 000 € per year for electricity and 75
000 € per year for electricity and 75![[thin space (1/6-em)]](https://www.rsc.org/images/entities/char_2009.gif) 000 € year for H2 production. This inferior performance is due to the lower efficiency during the CHP phase compared to biogas upgrading.
000 € year for H2 production. This inferior performance is due to the lower efficiency during the CHP phase compared to biogas upgrading.
When considering biogas valorisation in methanol, the situation is significantly different. Standard methanol production from biogas (i.e. via steam reforming) is not suitable for energy storage towards electricity production, as made evident by the slightly negative profitability of this route. This is due to both the low amount of energy stored (due to the efficiency issues in biogas reforming) and to the efficiency of the methanol to electricity process. The results are significantly better when considering energy storage towards H2 production, with a potential profit of 105![[thin space (1/6-em)]](https://www.rsc.org/images/entities/char_2009.gif) 000 € per year. Note that this value is higher than that in the flexible CHP/methanation process. However, the economic results of this process are in any case worse than those of standard biogas upgrading. Methanol can be better employed in energy storage processes. In fact, for the flexible upgrading/methanol process, the possible profit is 480
000 € per year. Note that this value is higher than that in the flexible CHP/methanation process. However, the economic results of this process are in any case worse than those of standard biogas upgrading. Methanol can be better employed in energy storage processes. In fact, for the flexible upgrading/methanol process, the possible profit is 480![[thin space (1/6-em)]](https://www.rsc.org/images/entities/char_2009.gif) 000 € per year for electricity and 270
000 € per year for electricity and 270![[thin space (1/6-em)]](https://www.rsc.org/images/entities/char_2009.gif) 000 € year for H2 production. Note that the value for electricity is lower than that for the flexible methanation configurations, but the H2 profitability is significantly higher than that in all the other cases. This is due to the interplay of efficiencies in the synthesis and reforming phases, favouring methanol production via power-to-X. The results of the flexible CHP/methanol synthesis show a significantly lower performance than the previous case, due to the efficiency issues arising from CHP.
000 € year for H2 production. Note that the value for electricity is lower than that for the flexible methanation configurations, but the H2 profitability is significantly higher than that in all the other cases. This is due to the interplay of efficiencies in the synthesis and reforming phases, favouring methanol production via power-to-X. The results of the flexible CHP/methanol synthesis show a significantly lower performance than the previous case, due to the efficiency issues arising from CHP.
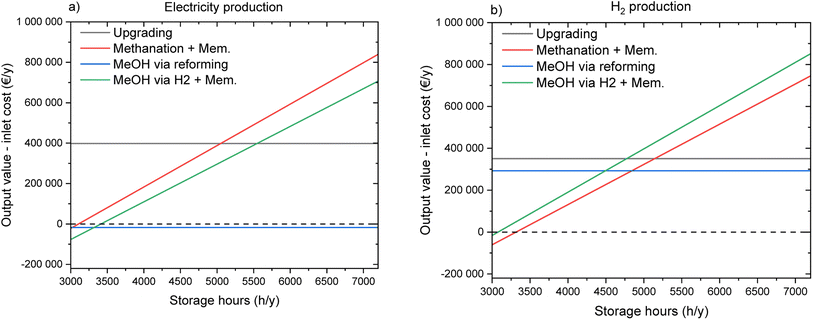
From the results described above, it can be concluded that methane is the carrier of choice to store electricity and that methanol is the most suitable carrier for H2 storage. Additionally, in the case assessed here, where the market is supposed to develop towards a division between times of high electricity prices and times of low electricity price, it is evident that PtX configurations would become significantly more profitable. These assumptions are agreed upon by several researchers in the field.63,64 Hence, new perspectives can be provided for the use of biogas plants not only as a source of renewable gas, but also as a platform for renewable energy storage and production, enhancing the circular economy. In order to further assess this hypothesis, Fig. 13 shows a sensitivity analysis on the operation hours in storage and utilization mode. The flexible processes are dependent linearly on the operation hours in energy storage, as this modifies the total output. The standard processes are almost independent from the operation hours because their productivity remains unchanged. However, with a larger number of hours and with high electricity price, the product selling time increases, hence decreasing the power output (less kW h h−1) but not the total output. It can be observed that the crossover between flexible and standard operation modes occurs at 5000 h year−1 for methane and at 3400 h year−1 for methanol in the production of electricity. For H2 production, the crossover point is located at 5200 h year−1 for methane and 4500 h year−1 for methanol. The break-even point of the two flexible processes is placed between 3000 and 4000 storage hours for both methane and methanol.
4 Conclusions
This study determined the most suitable biogas valorisation strategies under various boundary conditions. It was found that CHP is a technology that will probably go through a generalised phase out if the current (strong) incentives decrease. Hence, the shift towards different processes for biogas valorisation appears to be beneficial. Methane and methanol seem to be promising alternative products to synthesise from biogas. The main advantage of these molecules lies in the possibility of decoupling production and final product use in time and space, storing the energy carriers in the existing infrastructure. It was found that methanol is in general a better energy vector to produce from biogas, because of its higher energy efficiency and the potential higher value of the product. However, an efficient methanol synthesis involves the co-production of methane, hence requiring the combined handling of the two carriers.The introduction of energy carrier use in the analysis leads to further interesting insights. It was observed that biogas could significantly support the development of the renewable energy storage infrastructure. This is carried out by using a biogas plant producing methane and/or methanol as an energy absorber when electricity is available in excess and consuming the energy carrier for electricity or hydrogen production when renewable energy is scarce. The flexibility of this system allows decentralised energy storage, coupled with a centralised consumption of the energy carriers. For this purpose, it was determined that methane is the optimal product for energy storage towards electricity production, while methanol is the best for hydrogen production. This is due to the significantly different efficiency of the two processes.
This study shows that the technologies for the conversion of a biogas plant into a platform for renewable energy production and storage are available and the suggested pathways are economically promising and sound from a carbon footprint perspective. The implementation of such technologies on a large scale is now dependent on the definition of specific legal and economic initiatives aimed at fostering the demonstration of such solutions in large quantities, hence progressively realizing the energy storage infrastructure that will be needed in the future. Biogas can certainly play a role in this technological development and the specific process selection can be guided by the careful analysis of the boundary conditions a biogas plant has to fulfil. In this sense, this study sets the foundations for the development of new energy storage processes centred on biogas valorisation strategies.
Appendix
Reactor model
The model for the steam-reforming reactor is a pseudo-homogeneous 1D model with heat balance on the heating fluid: | (A1) |
 | (A2) |
 | (A3) |
The model for methane and methanol synthesis is a pseudo-homogeneous 1D model with constant coolant temperature:
 | (A4) |
 | (A5) |
The kinetics models used are from Xu and Froment40 for methane steam reforming, from Koschany et al.35 for CO2 methanation and from Vanden Bussche and Froment42 for methanol synthesis.
For all the reactors, the catalyst efficiency factor is calculated via the Thiele modulus:
 | (A6) |
 | (A7) |
The heat transfer coefficient is calculated considering the transport phenomena on tube and shell sides, as well as the conductivity of the tube:
 | (A8) |
k is calculated considering a stagnant and a dynamic contribution:
 | (A9) |
Sensitivity to CAPEX and OPEX
Fig. 15 shows the sensitivity of the various configurations to CAPEX and OPEX variation. The flexible configurations are more sensitive to variations in these parameters because they include a larger number of units and they require abundant electricity for operation.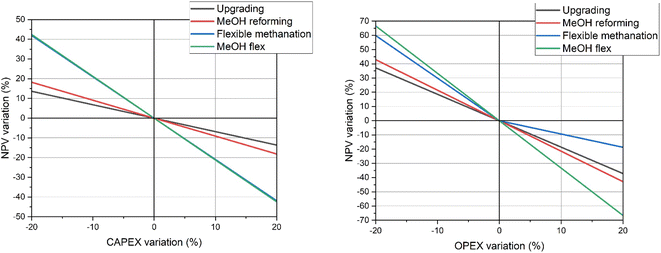 | ||
| Fig. 15 Sensitivity analysis with respect to CAPEX and OPEX variations for the various biogas valorisation processes. | ||
Nomenclature
| AD | Anaerobic digestion |
| AEL | Alkaline electrolyser |
| CAPEX | Capital expenditure (€ per year) |
| CEPCI | Chemical engineering plant cost index |
| CHP | Combined heat and power production |
| CNG | Compressed natural gas |
| HHV | Higher heating value (kJ mol−1) |
| MeOH | Methanol |
| OPEX | Operative expenditures (€ per year) |
| PtG | Power to gas |
| PtMeOH | Power to methanol |
| PtX = | Power to X |
| RWGS | Reverse water gas shift reaction |
| SNG | Synthetic natural gas |
| STY | Space time yield |
| C BM | Bare module cost (€) |
| C BM,today | Current bare module cost (€) |
| C p | Equipment purchase cost (€) |
| E i | The electrical output of the system (kW) |
| F | Stoichiometric factor (H2![[thin space (1/6-em)]](https://www.rsc.org/images/entities/char_2009.gif) : :![[thin space (1/6-em)]](https://www.rsc.org/images/entities/char_2009.gif) CO2) CO2) |
| F C | Cost factor |
| F e | Exchange rate |
| F M | Material factor |
| F P | Pressure factor |
| Q Bio | The volumetric flowrate of biogas (m3 h−1) |
| R T | Process income (€ per year) |
| X i | Conversion of the component i |
| Y i | Yield of the component i |
| η | Process efficiency |
| a | Plant lifetime (years) |
| i | Interest rate (%) |
| ΔHR | Reaction enthalpy (kJ mol−1) |
Data availability
Data will be made available by the authors upon reasonable request.Author contributions
Emanuele Moioli: conceptualization, methodology, formal analysis, data curation, writing – original draft, writing – review & editing, funding acquisition. Tilman Schildhauer: conceptualization, methodology, writing – original draft, writing – review & editing, funding acquisition.Conflicts of interest
The authors declare that there is no conflict of interest.Acknowledgements
This work received funding from the project “Efficient Small-Scale methanol synthesis from biogas” supported by the Swiss Federal Office for Energy (project number SI/502147) and from the Synfuels initiative of the board of the ETH domain (ETH Rat). The authors acknowledge the support from the ESI platform at the Paul Scherrer Institute.References
- A. Bosmans, I. Vanderreydt, D. Geysen and L. Helsen, The crucial role of Waste-to-Energy technologies in enhanced landfill mining: A technology review, J. Cleaner Prod., 2013, 55, 10–23, DOI:10.1016/j.jclepro.2012.05.032.
- R. Kadam and N. L. Panwar, Recent advancement in biogas enrichment and its applications, Renewable Sustainable Energy Rev., 2017, 73, 892–903, DOI:10.1016/j.rser.2017.01.167.
- J. P. Sheets and A. Shah, Techno-economic comparison of biogas cleaning for grid injection, compressed natural gas, and biogas- to-methanol conversion technologies Johnathon, Biofuels, Bioprod. Biorefin., 2017, 12, 412–425, DOI:10.1002/bbb.
- S. E. Hosseini and M. A. Wahid, Development of biogas combustion in combined heat and power generation, Renewable Sustainable Energy Rev., 2014, 40, 868–875, DOI:10.1016/j.rser.2014.07.204.
- F. Cucchiella and I. D'Adamo, Technical and economic analysis of biomethane: A focus on the role of subsidies, Energy Convers. Manage., 2016, 119, 338–351, DOI:10.1016/j.enconman.2016.04.058.
- R. Kapoor, P. Ghosh, M. Kumar and V. K. Vijay, Evaluation of biogas upgrading technologies and future perspectives: a review, Environ. Sci. Pollut. Res., 2019, 26, 11631–11661, DOI:10.1007/s11356-019-04767-1.
- W. M. Budzianowski, C. E. Wylock and P. A. Marciniak, Power requirements of biogas upgrading by water scrubbing and biomethane compression: Comparative analysis of various plant configurations, Energy Convers. Manage., 2017, 141, 2–19, DOI:10.1016/j.enconman.2016.03.018.
- B. R. de Vasconcelos and J. M. Lavoie, Recent advances in power-to-X technology for the production of fuels and chemicals, Front. Chem., 2019, 7, 1–24, DOI:10.3389/fchem.2019.00392.
- E. Moioli and T. Schildhauer, Negative CO2 emissions from flexible biofuel synthesis: Concepts, potentials, technologies, Renewable Sustainable Energy Rev., 2022, 158, 112120, DOI:10.1016/j.rser.2022.112120.
- A. Sternberg and A. Bardow, Power-to-What?-Environmental assessment of energy storage systems, Energy Environ. Sci., 2015, 8, 389–400, 10.1039/c4ee03051f.
- S. Rönsch, J. Schneider, S. Matthischke, M. Schlüter, M. Götz and J. Lefebvre, et al., Review on methanation - From fundamentals to current projects, Fuel, 2016, 166, 276–296, DOI:10.1016/j.fuel.2015.10.111.
- M. Götz, J. Lefebvre, F. Mörs, A. McDaniel Koch, F. Graf and S. Bajohr, et al., Renewable Power-to-Gas: A technological and economic review, Renewable Energy, 2016, 85, 1371–1390, DOI:10.1016/j.renene.2015.07.066.
- E. Moioli, R. Mutschler, A. Borsay, M. Calizzi and A. Züttel, Synthesis of grid compliant substitute natural gas from a representative biogas mixture in a hybrid Ni/Ru catalysed reactor, Chem. Eng. Sci.: X, 2020, 8, 100078, DOI:10.1016/j.cesx.2020.100078.
- J. Witte, A. Kunz, S. M. A. Biollaz and T. J. Schildhauer, Direct catalytic methanation of biogas – Part II: Techno-economic process assessment and feasibility reflections, Energy Convers. Manage., 2018, 178, 26–43, DOI:10.1016/j.enconman.2018.09.079.
- G. Leonzio, Power to Gas Systems Integrated with Anaerobic Digesters and Gasification Systems, Waste Biomass Valorization, 2021, 12, 29–64, DOI:10.1007/s12649-019-00914-4.
- M. Bowker, Methanol Synthesis from CO2 Hydrogenation, ChemCatChem, 2019, 11, 4238–4246, DOI:10.1002/cctc.201900401.
- E. I. Koytsoumpa, C. Bergins and E. Kakaras, The CO2 economy: Review of CO2 capture and reuse technologies, J. Supercrit. Fluids, 2018, 132, 3–16, DOI:10.1016/j.supflu.2017.07.029.
- S. Ghosh, V. Uday, A. Giri and S. Srinivas, Biogas to methanol: A comparison of conversion processes involving direct carbon dioxide hydrogenation and via reverse water gas shift reaction, J. Cleaner Prod., 2019, 217, 615–626, DOI:10.1016/j.jclepro.2019.01.171.
- E. Moioli, R. Mutschler and A. Züttel, Renewable energy storage via CO 2 and H 2 conversion to methane and methanol : Assessment for small scale applications, Renewable Sustainable Energy Rev., 2019, 107, 497–506, DOI:10.1016/j.rser.2019.03.022.
- F. M. Baena-Moreno, L. Pastor-Pérez, Q. Wang and T. R. Reina, Bio-methane and bio-methanol co-production from biogas: A profitability analysis to explore new sustainable chemical processes, J. Cleaner Prod., 2020, 265, 121909, DOI:10.1016/j.jclepro.2020.121909.
- P. Yadav, D. Athanassiadis, D. M. M. Yacout, M. Tysklind and V. K. K. Upadhyayula, Environmental Impact and Environmental Cost Assessment of Methanol Production from wood biomass, Environ. Pollut., 2020, 265, 114990, DOI:10.1016/j.envpol.2020.114990.
- M. Prussi, M. Padella, M. Conton, E. D. Postma and L. Lonza, Review of technologies for biomethane production and assessment of Eu transport share in 2030, J. Cleaner Prod., 2019, 222, 565–572, DOI:10.1016/j.jclepro.2019.02.271.
- S. N. B. Villadsen, P. L. Fosbøl, I. Angelidaki, J. M. Woodley, L. P. Nielsen and P. Møller, The Potential of Biogas; the Solution to Energy Storage, ChemSusChem, 2019, 12, 2147–2153, DOI:10.1002/cssc.201900100.
- M. Wegener, J. Villarroel Schneider, A. Malmquist, A. Isalgue, A. Martin and V. Martin, Techno-economic optimization model for polygeneration hybrid energy storage systems using biogas and batteries, Energy, 2021, 218, 119544, DOI:10.1016/j.energy.2020.119544.
- I. Ullah Khan, M. Hafiz Dzarfan Othman, H. Hashim, T. Matsuura, A. F. Ismail and M. Rezaei-DashtArzhandi, et al., Biogas as a renewable energy fuel – A review of biogas upgrading, utilisation and storage, Energy Convers. Manage., 2017, 150, 277–294, DOI:10.1016/j.enconman.2017.08.035.
- O. W. Awe, Y. Zhao, A. Nzihou, D. P. Minh and N. Lyczko, A Review of Biogas Utilisation, Purification and Upgrading Technologies, Waste Biomass Valorization, 2017, 8, 267–283, DOI:10.1007/s12649-016-9826-4.
- U.S. Department of Energy, Combined Heat & Power eCatalog: Recognized Packaged CHP Systems, 2021, https://chp.ecatalog.lbl.gov/ Search PubMed.
- D. M. Riley, J. Tian, G. Güngör-Demirci, P. Phelan, J. Rene Villalobos and R. J. Milcarek, Techno-economic assessment of chp systems in wastewater treatment plants, Environ., 2020, 7, 1–32, DOI:10.3390/environments7100074.
- U.S. Department of Energy, Combined Heat and Power Technology—Reciprocating Engines, Washington DC, USA: 2016 Search PubMed.
- I. Angelidaki, L. Treu, P. Tsapekos, G. Luo, S. Campanaro and H. Wenzel, et al., Biogas upgrading and utilization: Current status and perspectives, Biotechnol. Adv., 2018, 36, 452–466, DOI:10.1016/j.biotechadv.2018.01.011.
- R. Kapoor, P. Ghosh, M. Kumar and V. K. Vijay, Evaluation of biogas upgrading technologies and future perspectives: a review, Environ. Sci. Pollut. Res., 2019, 26, 11631–11661, DOI:10.1007/s11356-019-04767-1.
- Swissgrid, Production and Consuption Electricity Data for Switzerland, 2021, https://www.swissgrid.ch/en/home/operation/grid-data/generation.html#downloads Search PubMed.
- A. Gantenbein, J. Witte, S. M. A. Biollaz, O. Kröcher and J. Schildhauer, Flexible Application of Biogas Upgrading Membranes for Hydrogen Recycle in Power-to-Methane Processes, Chem. Eng. Sci., 2020, 116012, DOI:10.1016/j.ces.2020.116012.
- R. Mutschler, E. Moioli and A. Züttel, Modelling the CO2 hydrogenation reaction over Co, Ni and Ru/Al2O3, J. Catal., 2019, 375, 193–201, DOI:10.1016/j.jcat.2019.05.023.
- F. Koschany, D. Schlereth and O. Hinrichsen, On the kinetics of the methanation of carbon dioxide on coprecipitated NiAl ( O ) x, Appl. Catal., B, 2016, 181, 504–516, DOI:10.1016/j.apcatb.2015.07.026.
- G. D. Ulrich and P. T. Vasudevan, Chemical Engineering Process Design and Economics: A Practical Guide, Taylor & Francis, Bosa Roca, United States, 2nd edn, 2004 Search PubMed.
- E. Moioli and T. Schildhauer, Eco-Techno-Economic Analysis of Methanol Production from Biogas and Power-to-X, Ind. Eng. Chem. Res., 2022, 61, 7335–7348, DOI:10.1021/acs.iecr.1c04682.
- R. O. dos Santos, L. de S. Santos and D. M. Prata, Simulation and optimization of a methanol synthesis process from different biogas sources, J. Cleaner Prod., 2018, 186, 821–830, DOI:10.1016/j.jclepro.2018.03.108.
- A. Vita, C. Italiano, D. Previtali, C. Fabiano, A. Palella and F. Freni, et al., Methanol synthesis from biogas: A thermodynamic analysis, Renewable Energy, 2018, 118, 673–684, DOI:10.1016/j.renene.2017.11.029.
- J. Xu and G. F. Froment, Methane steam reforming, methanation and water-gas shift: I. Intrinsic kinetics, AIChE J., 1989, 35, 88–96, DOI:10.1002/aic.690350109.
- K. Ibsen, Equipment Design and Cost Estimation for Small Modular Biomass Systems, Synthesis Gas Cleanup and Oxygen Separation Equipments, San Francisco, California: 2015 Search PubMed.
- K. M. Vanden Bussche and G. F. Froment, A steady-state kinetic model for methanol synthesis and the water gas shift reaction on a commercial Cu/ZnO/Al2O3 catalyst, J. Catal., 1996, 161, 1–10, DOI:10.1006/jcat.1996.0156.
- E. Moioli, A. Wötzel and T. Schildhauer, Feasibility assessment of small-scale methanol production via power-to-X, J. Cleaner Prod., 2022, 359, 132071, DOI:10.1016/j.jclepro.2022.132071.
- E. Moioli and T. Schildhauer, Tailoring the Reactor Properties in the Small-Scale Sorption-Enhanced Methanol Synthesis, Chem.-Ing.-Tech., 2023, 95, 631–641, DOI:10.1002/cite.202200200.
- L. A. Pellegrini, G. Soave, S. Gamba and S. Langè, Economic analysis of a combined energy-methanol production plant, Appl. Energy, 2011, 88, 4891–4897, DOI:10.1016/j.apenergy.2011.06.028.
- F. Samimi and M. R. Rahimpour, Direct Methanol Fuel Cell, in Methanol Sci. Eng., ed. Basile A. and Dalena F., Elsevier B.V., 2017, pp. 381–397, DOI:10.1016/B978-0-444-63903-5.00014-5.
- M. de Wild-Scholten, C. Valérick and T. Huld. Solar resources and carbon footprint of photovoltaic power in different regions in europe, 29th Eur. Photovolt. Sol. Energy Conf. Exhib. Sol., 2016, pp. 3421–30 Search PubMed.
- A. Moro and L. Lonza, Electricity carbon intensity in European Member States: Impacts on GHG emissions of electric vehicles, Transp. Res. D: Transp. Environ., 2018, 64, 5–14, DOI:10.1016/j.trd.2017.07.012.
- L. Eggemann, N. Escobar, R. Peters, P. Burauel and D. Stolten, Life cycle assessment of a small-scale methanol production system: A power-to-fuel strategy for biogas plants, J. Cleaner Prod., 2020, 271, 122476, DOI:10.1016/j.jclepro.2020.122476.
- S. Schiebahn, T. Grube, M. Robinius, V. Tietze, B. Kumar and D. Stolten, Power to gas: Technological overview, systems analysis and economic assessment for a case study in Germany, Int. J. Hydrogen Energy, 2015, 40, 4285–4294, DOI:10.1016/j.ijhydene.2015.01.123.
- N. S. Sifat and Y. Haseli, A critical review of CO2 capture technologies and prospects for clean power generation, Energies, 2019, 12, 4143, DOI:10.3390/en12214143.
- PowerTechnology, Getting to grips with Germany's CHP regulations, Power Technol., 2018, accessed 2nd May 2023, https://www.power-technology.com/comment/getting-grips-germanys-chp-regulations/ Search PubMed.
- A. H. Seifert, S. Rittmann and C. Herwig, Analysis of process related factors to increase volumetric productivity and quality of biomethane with Methanothermobacter marburgensis, Appl. Energy, 2014, 132, 155–162, DOI:10.1016/j.apenergy.2014.07.002.
- P. Collet, E. Flottes, A. Favre, L. Raynal, H. Pierre and S. Capela, et al., Techno-economic and Life Cycle Assessment of methane production via biogas upgrading and power to gas technology, Appl. Energy, 2017, 192, 282–295, DOI:10.1016/j.apenergy.2016.08.181.
- L. Jürgensen, E. A. Ehimen, J. Born and J. B. Holm-Nielsen, Utilization of surplus electricity from wind power for dynamic biogas upgrading: Northern Germany case study, Biomass Bioenergy, 2014, 66, 126–132, DOI:10.1016/j.biombioe.2014.02.032.
- J. Gorre, F. Ortloff and C. van Leeuwen, Production costs for synthetic methane in 2030 and 2050 of an optimized Power-to-Gas plant with intermediate hydrogen storage, Appl. Energy, 2019, 253, 113594, DOI:10.1016/j.apenergy.2019.113594.
- D. Previtali, A. Vita, A. Bassani, C. Italiano, A. F. Amaral and C. Pirola, et al., Methanol synthesis: A distributed production concept based on biogas plants, Chem. Eng. Trans., 2018, 65, 409–414, DOI:10.3303/CET1865069.
- M. Rivarolo, D. Bellotti, L. Magistri and A. F. Massardo, Feasibility study of methanol production from different renewable sources and thermo-economic analysis, Int. J. Hydrogen Energy, 2016, 41, 2105–2116, DOI:10.1016/j.ijhydene.2015.12.128.
- R. Gao, C. Zhang, Y. J. Lee, G. Kwak, K. W. Jun and S. K. Kim, et al., Sustainable production of methanol using landfill gas via carbon dioxide reforming and hydrogenation: Process development and techno-economic analysis, J. Cleaner Prod., 2020, 272, 122552, DOI:10.1016/j.jclepro.2020.122552.
- F. M. Baena-Moreno, L. Pastor-Pérez, Q. Wang and T. R. Reina, Bio-methane and bio-methanol co-production from biogas: A profitability analysis to explore new sustainable chemical processes, J. Cleaner Prod., 2020, 265, 121909, DOI:10.1016/j.jclepro.2020.121909.
- P. J. Megiá, A. J. Vizcaíno, J. A. Calles and A. Carrero, Hydrogen Production Technologies: From Fossil Fuels toward Renewable Sources. A Mini Review, Energy Fuels, 2021, 35, 16403–16415, DOI:10.1021/acs.energyfuels.1c02501.
- L. B. Braga, J. L. Silveira, M. E. Da Silva, C. E. Tuna, E. B. Machin and D. T. Pedroso, Hydrogen production by biogas steam reforming: A technical, economic and ecological analysis, Renewable Sustainable Energy Rev., 2013, 28, 166–173, DOI:10.1016/j.rser.2013.07.060.
- E. Panos and M. Densing, The future developments of the electricity prices in view of the implementation of the Paris Agreements: Will the current trends prevail, or a reversal is ahead?, Energy Econ., 2019, 84, 104476, DOI:10.1016/j.eneco.2019.104476.
- E. Panos, T. Kober and A. Wokaun, Long term evaluation of electric storage technologies vs. alternative flexibility options for the Swiss energy system, Appl. Energy, 2019, 252, 113470, DOI:10.1016/j.apenergy.2019.113470.
- C. Antonini, K. Treyer, A. Streb, M. Van der Spek, C. Bauer and M. Mazzotti, Hydrogen production from natural gas and biomethane with carbon capture and storage – a techno-environmental analysis, Sustainable Energy Fuels, 2020, 4, 2697–2986, 10.1039/d0se00222d.
- C. Antonini, K. Treyer, E. Moioli, C. Bauer, T. Schildhauer and M. Mazzotti, Hydrogen from wood gasification with CCS - a techno-environmental analysis of production and use as transport fuel, Sustainable Energy Fuels, 2021, 5, 2602–2621, 10.1039/d0se01637c.
| This journal is © The Royal Society of Chemistry 2023 |

