 Open Access Article
Creative Commons Attribution 3.0 Unported Licence
Influence of the dispersity and molar mass distribution of conjugated polymers on the aggregation type and subsequent chiral expression†
Annelien
Van Oosten
 a,
Cynthia
Verduyckt
 a,
Julien
De Winter
 b,
Pascal
Gerbaux
 b and
Guy
Koeckelberghs
 *a
*a
aLaboratory for Polymer Synthesis, KU Leuven, Celestijnenlaan 200F, B-3001 Heverlee, Belgium. E-mail: guy.koeckelberghs@kuleuven.be
bOrganic Synthesis and Mass Spectrometry Laboratory, Center of Innovation and Research in Materials and Polymers (CIRMAP) – University of Mons (UMONS), Place du Parc 23, B-7000 Mons, Belgium
First published on 10th May 2023
Abstract
This study aims to determine the influence of the dispersity on the aggregation of conjugated polymers and their subsequent chiral expression. Dispersity has been thoroughly investigated for industrial polymerizations, but research on conjugated polymers is lacking. Nonetheless, knowledge thereof is crucial for controlling the aggregation type (type I versus type II) and its influence is therefore investigated. For that purpose, a series of polymers is synthesized via metered initiator addition, resulting in dispersities ranging from 1.18–1.56. The lower dispersity polymers yield type II aggregates and the resulting symmetrical electronic circular dichroism (ECD) spectra while the higher dispersity polymers are predominantly type I due to the longer chains effectively acting as a seed and therefore yield asymmetrical ECD spectra. Furthermore, a monomodal and bimodal molar mass distribution of similar dispersity are compared, demonstrating that bimodal distributions show both aggregation types and therefore more disorder, leading to a decrease in chiral expression.
Introduction
Recent work has demonstrated the influence of the aggregation type on the chiral expression of conjugated polymers (CPs), and has given an overview of many parameters that can be adjusted to control the aggregation.1 In general, factors that lead to strong π-stacking, such as high molar mass2 and high planarity,3 give rise to type I aggregation (herringbone like structure), while factors benefitting van der Waals interactions, e.g. long sidechains,4 will yield type II aggregated polymers with interdigitated sidechains (comb like structure).5 However, some parameters remain unexplored, of which dispersity is the most prominent. There have been indications that dispersity has an influence on the morphology and self-assembly, mainly of block copolymers,6–12 but in-depth knowledge of the influence of all parameters is important to control the resulting aggregation type. In turn, this is crucial for further applications as the effects of type I and type II on the electronic and optical properties differ significantly. For example, as there is a stronger π-stacking and therefore shorter interlamellar distance between adjacent chains in type I, charge transfer is facilitated by a more beneficial hopping between chains. Therefore, the presence of type I aggregates benefits applications in which a good charge transfer is essential, such as organic photovoltaic devices (oPVs), thermo-electronics and organic field effect transistors (oFETs).13–16 In type II, the longer interlamellar distance increases fluorescence as photoluminescence quenching is diminished. This aids applications in which the optical aspects are important, such as organic light emitting devices (oLEDs).17,18 Of course, controlling the aggregation type can help finetune applications in which the chiral properties themselves are relevant, such as metamaterials.19In industrial polymerizations, the influence of dispersity is already well-known, for example in the case of polystyrene. For excellent material properties, high molar mass is necessary, usually limiting the processability of the polymer. This processability can be improved by increasing the dispersity, as the lower mass chains act as plasticizers, while the outstanding material properties originating from the higher mass chains are maintained.20–22 Nevertheless, dispersity is only scarcely investigated in CPs, even though it differs significantly between the common synthesis procedures for CPs: a (controlled) chain-growth or a step-growth polymerization. In a controlled chain-growth polymerization, very low dispersities of around 1.05–1.1 can be obtained when the appropriate initiator is employed, for example in the Kumada catalyst transfer condensative polymerization (KCTCP) of 2-bromo-3-hexyl-5-magnesiumchloride thiophene with an external o-tolyl [bis(diphenylphosphino)propane] nickel(II)bromide.23,24 Other controlled CTCPs of 2-bromo-3-hexyl-5-magnesiumchloride thiophene, such as the Suzuki–Miyaura CTCP25 or the Negishi polymerization with Pd(RuPhos),26,27 often yield higher dispersities around 1.4, although recent methods have succeeded in narrowing the dispersity.28 Commonly, step-growth polymerizations yield a dispersity ∼2, but this can be much higher as well. Consequently, to adequately compare their resulting polymers, full knowledge of the influence of all parameters, including dispersity, is necessary.
In controlled polymerizations, there are a multitude of ways to vary and therefore study dispersity, which are generally divided into four categories.29 The first one is the traditional blending of high and low molar mass chains as described above.30,31 While this method is relatively straightforward and easily applicable to any polymer, it requires the synthesis and purification of multiple polymers and often yields a multimodal distribution, which can be undesirable for some applications. The second method is tailored catalyst concentration, in which the catalyst concentration is often extremely low (ppm range).12,32 This can lead to several drawbacks, such as higher than intended molar mass and low conversions. Nonetheless, this method has been successfully performed by multiple groups in atom transfer radical polymerizations (ATRP) to synthesize polymers with a dispersity between 1.06 and ∼2.33–35 A third way to tune the dispersity, is by addition of additional reagents which can irreversibly trap a growing polymer chain.36–38 This can either be a nonfunctional monomer, other polymer chains or terminating agents often also denoted as chain-stoppers or chain-transfer agents.39 In many cases, addition of these agents leads to lower end-group fidelity and the formation of more advanced macromolecular structures such as block copolymers is not possible in a one-pot synthesis. The last method entails the regulation of the initiation speed, and has been demonstrated in a wide array of polymerization types such as anionic polymerization40 and nitroxide mediated polymerization (NMP).41 By introducing the initiator to the monomer at a selected rate, both the dispersity and the shape of the molar mass distribution can be tuned.8 The strength of this method lies in the excellent end-group control, the high range of obtainable dispersities and the possibility to form block copolymers. Moreover, controlling the rate of initiation and propagation allows the prediction of the dispersity with high accuracy.42 Therefore, this is the method of choice in this paper, and will be combined with KCTCP. To the best of our knowledge, this will be the first time the dispersity is varied using a CTCP of any kind in this manner.
The aim of this paper is twofold. First, a series of chiral poly(3-(3,7-(S)-dimethyloctyl)thiophene)s (P3DMOT) with varying dispersity is synthesized using a KCTCP in which the initiator is added to the monomer solution at variable rates. In order to do so adequately, the correct initiator and catalyst system is investigated and the reaction rate is calculated. Second, the aggregation type is determined using UV-Vis and ECD characterization. In UV-Vis, type I will give a more pronounced 0–0 transition around 635 nm due to the stronger π-stacking, versus a weak transition at 615 nm for a type II aggregate of P3DMOT.43 In ECD, two neighbouring chromophores which have an angular momentum between them, will yield two similar but opposite signals, giving rise to a bisignate Cotton effect as a result of the helicity in the exciton coupling.44,45 Recently, it has been determined that the difference in signal between both types is very pronounced as the long range interactions in type I aggregates yield an additional monosignate Cotton effect, leading to an asymmetrical spectrum.1 Additionally, the zero-crossing occurs at higher wavelength since the polymers have an increased planarity and the zero-crossing is directly related to the absorption spectrum, which is more redshifted for type I. Therefore, the combination of both techniques provides a straightforward elucidation of the aggregation type in solution, which is an uncommon feature in other techniques. The knowledge of the influence of the dispersity on the aggregation type, and how to control this dispersity in a new manner for CTCP, will contribute to the general comparison of CPs and improvement of their properties for various applications.
Results and discussion
Four CPs with increasing dispersity are synthesized via KCTCP. This polymerization method is commonly known to yield low dispersities (<1.2) for poly(3-alkylthiophene)s as it is a chain-growth polymerization with a fast initiation step. Additionally, the degree of polymerization (DP) can be predicted by the initial monomer to initiator ratio, and the end groups are well controlled.46–48 To get a range of polymers with increasing dispersity, the rate of initiation is artificially lowered by slowly adding the initiator to the active monomer using an automated syringe pump containing an initiator solution (see Scheme 1). To do so, two factors are important: solubility of the initiator and the total polymerization time. Common nickel (+II) initiators, such as [1,3-bis(diphenylphosphino)propane] dichloronickel(II) (Ni(dppp)Cl2) or [1,3-bis(diphenylphosphino)ethane] dichloronickel(II) (Ni(dppe)Cl2) are insoluble in THF. If this dispersion would be employed, the initiator would not be homogeneously distributed and fluctuations will occur. This can lead to both an asymmetrical molar mass distribution as the addition of initiator is not constant over time, and to deviations from the predicted average molar mass as some initiator might not be added due to sedimentation. However, to enable a concrete comparison to previous literature, external soluble initiators must be avoided as they influence the overall aggregation behavior.49 Therefore, it is opted to oligomerize (∼4 monomer units) a nickel (+II) salt to dissolve the catalyst and utilize this initiator solution for further polymerization (see Scheme 1). This is possible due to the controlled character of the polymerization, in which every polymer chain remains reactive as a result of the oxidative resting state of the nickel until purposeful termination.50 In the initiation step, two monomer units are subsequently coupled by a tail-to-tail coupling as a result of two transmetallation steps in the beginning of the polymerization mechanism.48,51 The influence of this tail-to-tail coupling is minimal, especially compared to other types of couplings or external initiators.27 Next, the total polymerization time must be known to determine the different rates of initiator addition, as all initiator should be added to the monomer solution before the polymerization finishes to not have an excess of unreacted initiator, and to have an accurate estimation of the DP according to DP = [monomer]0/[initiator]. As the rate determining step of Ni(dppp)Cl2 is the transmetallation step (TM), the polymerization rate of Ni(dppp)Cl2 is dependent on the monomer concentration at that moment and will therefore decline in function of conversion.50 To ensure an equal distribution of the molar mass, it is necessary to add the initiator at a rate linearly proportional to the rate of monomer reaction. Therefore, the addition rate should exponentially decrease over time, which is experimentally unpractical. In contrast, the rate determining step of Ni(dppe)Cl2 is the reductive elimination (RE) and is therefore monomer concentration independent and linear in function of conversion.52 As this enables the possibility of a constant addition rate, Ni(dppe)Cl2 was selected as the optimal pre-initiator. Note that the propagation reaction rate is catalyst dependent, so other Ni(dppe) systems such as an external aryl Ni(dppe)Br could be used in the future under similar conditions. | ||
| Scheme 1 Schematic representation of the polymerization reaction of P1-P4. The soluble initiator (red) is slowly added to the active monomer (yellow) at a rate dependent on the desired dispersity. | ||
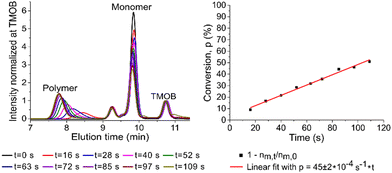
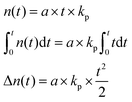
To determine the total reaction time, the polymerization rate constant (kp) was determined by plotting the conversion (p) in function of reaction time (t; see Fig. 1, right). Ni(dppe) as catalyst after propagation of 4 monomer units (further referred to as ‘initiator’) is employed, similarly to the dispersity experiment to give an accurate indication, and to avoid deviations because of a different initiation step. Trimethoxybenzene (TMOB) is added to the monomer solution as an internal standard to calculate the unreacted amount of monomer (nm,t) compared to the initial amount of monomer (nm,0). Starting at time 0 (just before addition of the initiator), an aliquot of the polymerization mixture is removed every ∼15 seconds, and analyzed with size exclusion chromatography (SEC) to determine the conversion (see Fig. 1, left). The conversion can be related to kpviaeqn (1), where nm,0 is the initial mol active monomer, ninitiator the amount initiator in mol, and t the time in seconds. This yields a kp of 0.25 ± 0.01 s−1 for the polymerization of 2-bromo-3-(3,7-(S)-dimethyloctyl)-5-magnesiumchloride thiophene (1) with Ni(dppe) as catalyst, as ninitiator is 0.0018 mmol and nm,0 is 0.100 mmol.
 | (1) |
 | (2) |
![[M with combining macron]](https://www.rsc.org/images/entities/i_char_004d_0304.gif) n), weight average molar mass (
n), weight average molar mass (![[M with combining macron]](https://www.rsc.org/images/entities/i_char_004d_0304.gif) w) and dispersity (Đ)) as well as the nature of the end-groups (see ESI† and Table 1). Note that this approach provides for the first time conjugated polymers of which both molar mass and dispersity can be independently varied. Compared to some industrially synthesized polymers, the dispersity is still rather limited as a result of the medium-low molar mass. A broader distribution would in this case also lead to an increase in molar mass, which should be avoided as the polymers would always aggregate according to type I at high molar mass.
w) and dispersity (Đ)) as well as the nature of the end-groups (see ESI† and Table 1). Note that this approach provides for the first time conjugated polymers of which both molar mass and dispersity can be independently varied. Compared to some industrially synthesized polymers, the dispersity is still rather limited as a result of the medium-low molar mass. A broader distribution would in this case also lead to an increase in molar mass, which should be avoided as the polymers would always aggregate according to type I at high molar mass.
| Addition time | Addition rate | Total time of polymerization |
![[M with combining macron]](https://www.rsc.org/images/entities/i_char_004d_0304.gif) n (kg mol−1)
n (kg mol−1) |
![[M with combining macron]](https://www.rsc.org/images/entities/i_char_004d_0304.gif) w (kg mol−1)
w (kg mol−1) |
Đ | |
|---|---|---|---|---|---|---|
| P1 | 1 min | 0.01 mmol min−1 | 150 s | 9.3 | 10.9 | 1.18 |
| P2 | 2 min | 0.005 mmol min−1 | 180 s | 9.8 | 13.5 | 1.37 |
| P3 | 3 min | 0.00333 mmol min−1 | 210 s | 11.3 | 16.7 | 1.48 |
| P4 | 5 min | 0.002 mmol min−1 | 268 s | 8.4 | 13.0 | 1.56 |
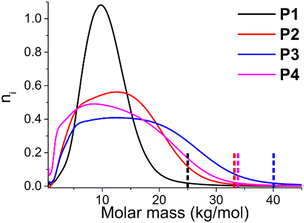
A plot of the actual SEC chromatograms demonstrates that the molar mass distribution broadens (see Fig. 2). The different chromatograms are normalized by their area, meaning that the total area of each graph is identical, which leads to a decrease in height when the dispersity broadens. Due to the relatively low molar mass, it is not possible to create fully symmetrical molar mass distributions, as there is a lower limit, and the distributions are slightly skewed towards higher molar mass. The sudden decrease at very low molar mass is a result of the Soxhlet purification in which these short oligomers are removed. Overall, it can be observed that the molar mass distributions become broader with increasing dispersity, and that the maximum molar mass present at the right limit of the molar mass distribution increases substantially, from 25 kg mol−1 for P1 to 40 kg mol−1 to P3 (taken as the point where the SEC elution curve reaches zero, see dotted lined in Fig. 2). The highest molar mass is ∼33 kg mol−1 for P4 even though it has the highest dispersity, as the ![[M with combining macron]](https://www.rsc.org/images/entities/i_char_004d_0304.gif) n of this polymer is also the lowest overall.
n of this polymer is also the lowest overall.
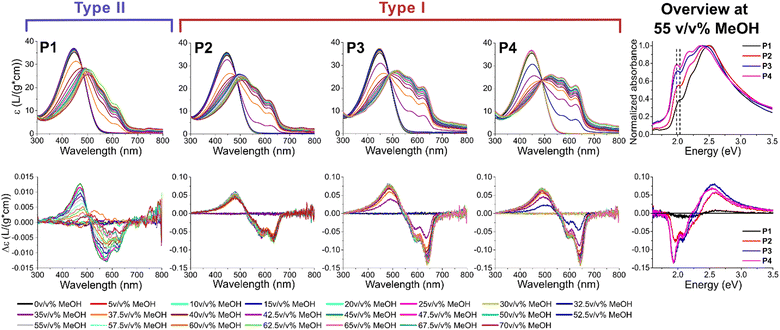
To induce aggregation, the polymers are dissolved in chloroform (CHCl3) and the non-solvent methanol (MeOH) is added stepwise (see ESI† for full details). The polymers slowly transition from a random coil conformation to aggregated stacks, in which either π-stacking (type I) or van der Waals interactions (type II) dominate. ECD measurements are commonly employed in chiral CPs and here utilized to impartially and straightforwardly determine the correct aggregation type of the solution.53–57 Specifically, type I aggregation has a more effective long range interaction due to closer interlamellar distances and stronger π-stacking, leading to an additional monosignate Cotton effect. Contrarily, a symmetrical bisignate Cotton effect is expected in type II as the interactions are mostly governed by the sidechains.1 This technique is less complicated and more readily available than other common techniques to determine the aggregation type, such as X-ray diffraction (XRD) or selected area electronic diffraction (SAED). Furthermore, ECD has the advantage that the process of aggregation can be investigated as not only the final state (thin film) is measured, and that only short range interactions are required, while other techniques require (high) crystallinity. Additionally, the onset of aggregation is determined by UV-Vis spectroscopy by the presence of a bathochromic shift of the π–π* transition and the appearance of finestructure. The bathochromic shift is the result of planarization, increasing the effective conjugation length upon aggregation. This finestructure is a result of different vibronic transitions, of which the 0–0 transition at ∼635 nm for type I and ∼615 nm for type II is mostly of interest for determining the amount of π-stacking.58 This transition clearly shifts towards higher wavelength (lower energy levels) and becomes more pronounced with increasing dispersity (see Fig. 3, right) with the transition at the highest wavelength (630 nm or 1.97 eV) present in P4. The reason for this bathochromic shift upon transition from type I to type II is directly related to the driving forces of their aggregation: π–π stacking and van der Waals forces, respectively. The stronger π–π stacking in type I, and resulting closer interlamellar distance between neighboring polymer chains, leads to a stronger planarization upon aggregation. This planarization in turn leads to a more efficient delocalization of the electrons, effectively decreasing their energy transition levels. Analyzing the ECD chromatograms, a clear trend is observed in function of dispersity (see Fig. 3). At low dispersity (P1), the polymer initially forms type II upon aggregation, while type I is also formed at high MeOH percentages. This can be concluded from a change in sign of the spectrum after 40 v/v% MeOH. Nonetheless, the spectrum remains relatively symmetrical, and the zero-crossing occurs at higher energy (lower wavelength) compared to the other polymers. P2 can be considered an intermediate aggregation state with both type I and II present, both from the intermediate zero-crossing, the relatively low amount of π-stacking and the fairly symmetrical ECD spectrum, even though the monosignate peak is already clearly visible. This monosignate peak is the result of long range order, which is more prevalent in type I aggregates, as their stronger π–π stacking leads to a shorter interlamellar distance. At the highest dispersity (P3 and P4), type I prevails distinctly. When comparing the ECD spectra after full aggregation (55 v/v% MeOH) of P1-P4, the increase of the monosignate contribution at 635 nm (1.95 eV) and the zero-crossing at progressively higher wavelength (lower energy) in function of increasing dispersity is clear (see Fig. 3, right). For P3 and P4, the ECD spectra are almost identical, even though the amount of π-stacking still increases for P4 according to the UV-Vis spectra. This is particularly interesting as the ![[M with combining macron]](https://www.rsc.org/images/entities/i_char_004d_0304.gif) n and
n and ![[M with combining macron]](https://www.rsc.org/images/entities/i_char_004d_0304.gif) w are slightly lower for P4 than for P3, indicating that the formation of type I is effectively derived from the higher dispersity and not a result of the higher mass of P3. The measurements are repeated to confirm their reproducibility (see ESI†).
w are slightly lower for P4 than for P3, indicating that the formation of type I is effectively derived from the higher dispersity and not a result of the higher mass of P3. The measurements are repeated to confirm their reproducibility (see ESI†).
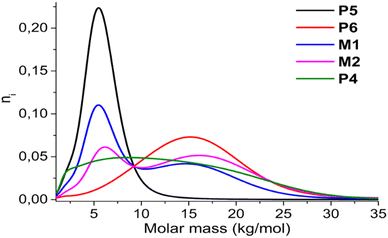
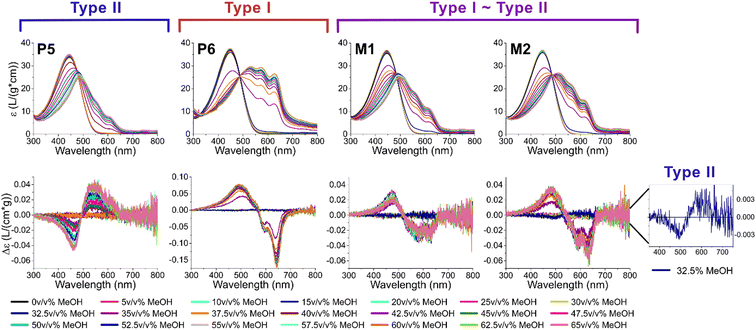
To determine the influence of the low versus high molar mass chains on the overall aggregation behavior, two mixtures were prepared of two different low dispersity polymers (low molar mass P5 and high molar mass P6). The first mixture (M1) had the same mass of both polymers, while in the second mixture (M2) both polymers were present in an equimolar amount (see Table 2; full characterization can be found in the ESI†). Although the average molar masses of M1 and M2 diverge due to the varying amounts of low molar mass P5 and high molar mass P6, both are in range of P3 and P4 of the previous experiments. Similarly, the overall dispersity of the mixtures is in range of P3 and P4, even though the actual molar mass distribution is different (see Fig. 4). In the mixtures, an increased amount of lower and higher molar mass chains is present, with a gap between them due to the absence of intermediate length chains. This gap enables separate comparison of the short and long chains, as both are known to exhibit different aggregation behavior, and is therefore a means to determine possible interactions between chains of different lengths.2 Longer chains typically aggregate at lower amounts of non-solvent, and starting at ∼10 kg mol−1,59 they usually chain fold, while tie crystals can occur at a molar mass higher than 19 kg mol−1.60 On the other hand, shorter chains have recently been shown to aggregate in a two-step process, where the first step forms sheet-like structures with interdigitated sidechains without further π-stacking (pre-aggregation).1 Mixing both without a smooth transition enables the determination of the type of chain/aggregate that takes the lead as the seed of aggregation, while also determining the effect of a bimodal versus monomodal molar mass distribution.
| Molar ratio of P5 | Molar ratio of P6 |
![[M with combining macron]](https://www.rsc.org/images/entities/i_char_004d_0304.gif) n (kg mol−1)
n (kg mol−1) |
![[M with combining macron]](https://www.rsc.org/images/entities/i_char_004d_0304.gif) w (kg mol−1)
w (kg mol−1) |
Đ | |
|---|---|---|---|---|---|
| P5 | 100 | 0 | 5.2 | 6.0 | 1.17 |
| P6 | 0 | 100 | 15.0 | 16.9 | 1.15 |
| M1 | 73 | 27 | 7.6 | 11.4 | 1.49 |
| M2 | 50 | 50 | 10.3 | 14.7 | 1.43 |
To adequately ascertain which events originate from the short or long polymer chains, P5 and P6 are assessed first to reveal their individual effect (see Fig. 5, left). As already described in previous literature, the low molar mass polymers typically aggregate according to type II, while high molar mass polymers have a tendency to aggregate according to type I.2 When measuring P5 and P6 with UV-Vis spectroscopy and ECD, analogous to the previous experiment, it is indeed confirmed that P5 displays the typical symmetrical ECD spectra for type II, while P6 has an additional monosignate Cotton effect due to the long range interactions in type I. Whereas the ECD signal of P6 is almost identical to those of P3 and P4, the mixtures M1 and M2 show a much more symmetrical and smaller ECD effect, indicating that both type I and II are present. This is also clearly observed in the initial aggregation phase of M2, which has an opposite sign and is indicative of type II. This is very surprising, as it is generally believed that high molar mass (type I) chains aggregate first since their solubility is lower. The initial formation of type II could be a result of the pre-aggregation formation of sheet-like structures, which already occurs at 25–30 v/v% MeOH.1 Nonetheless, this “seed” is not continued as afterwards the sign switches and type I is formed, indicating that both types are present in the mixture. If the short and long chains would aggregate completely independently, the resulting ECD spectra of the mixtures should be a weighted average of the individual polymers, which is not the case (see ESI†). Overall, a similar shape can be observed, but the intensity of the signal is about halved, and more in range of what is typically observed for type II, or polymers who are on edge between both types. We therefore hypothesize that the presence of type II aggregates disrupts the long range order of type I aggregates, leading to a less pronounced monosignate effect. When comparing M1 and M2, the latter shows a more pronounced monosignate peak at 635 nm, presumably due to the higher overall molar mass.
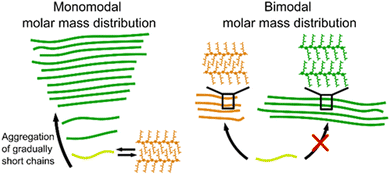
By comparing the mixtures M1 and M2 to P3 and P4, which are all similar in molar mass and dispersity, but differ in the shape of their molar mass distribution, a mechanism of the formation of type I aggregates in high dispersity polymers can be proposed. In general, aggregate formation occurs readily when there is little difference between the aggregating units. In polymers, this translates to the necessity of similar molar mass chains to form the most optimal stacks. If a polymer is longer than its neighbor, the remainder of the chain has no possibilities to form π-stacks and will form dangling ends which are less favorable due to a larger free surface energy. If a polymer is shorter than its neighbor, not all possible π-stacks are utilized, which is enthalpically less favorable. Herein, the distinction between monomodal (P3 and P4) and bimodal (M1 and M2) becomes relevant. In the monomodal distribution, on the one hand, a continuous increase/decrease in chain length between all polymer chains is present. Therefore, the high molar mass polymers aggregate first according to type I, and on this seed, increasingly shorter chains can gradually stack, while keeping the initial aggregation type (see Fig. 6). The short polymer chains can form sheets with interdigitating sidechains, but they are unlikely to form a type II seed. As there is only a small amount of short chains present, the sheets are more inclined to reversibly dissociate and propagate on the type I seed than stacking multiple sheets together to form a nucleation point as their aggregation point occurs slowly and at higher methanol percentages.1 In the bimodal distribution, on the other hand, there is a discrepancy between the lower and higher molar mass fraction with a larger amount of both lower and higher molar mass chains present compared to P3 and P4. Therefore, they aggregate relatively independently of each other. Consequently, two different seeds are formed, resulting in the presence of two aggregation types. The presence of both aggregation types leads to more overall disorder and disruption of the long range π–π stacking. Correspondingly, the chiral expression is lower than expected.
Conclusions
For the first time, a combination of metered initiation addition and KCTCP is successfully employed to vary the dispersity in a controlled manner. Ni(dppe)Cl2 is selected as a suitable pre-initiator due to its rate invariability towards conversion, making linear initiator addition possible. The polymerization rate constant of a Ni(dppe) catalyst with a 2-bromo-3-(3,7-(S)-dimethyloctyl)-5-magnesiumchloride thiophene monomer is calculated at 0.25 ± 0.01 s−1. Four polymers are synthesized with a total initiator addition time between 1 and 5 min, yielding polymers with dispersities ranging from 1.18 to 1.56. Solutions of these polymers are aggregated due to non-solvent addition, and their resulting aggregation type is characterized with UV-Vis and ECD spectroscopy. It is determined that polymers with low dispersity tend to aggregate according to type II with the resulting symmetric ECD spectra, while high dispersity polymers form type I aggregates and the corresponding asymmetric ECD spectra. By comparing these monomodal distributions with a mixture of a short and long polymer solution with a similar molar mass and dispersity, an aggregation mechanism is proposed. The mixtures show clear presence of both aggregation types, originating from both individual polymers, leading to a low monosignate Cotton effect in ECD due to disruption of the long range type I aggregates. In contrast, monomodal polymers with a similar dispersity predominantly aggregate according to type I, as the high molar mass chains aggregate first and act as a seed, and shorter polymer chains can adhere continuously to this seed. In conclusion, this paper demonstrates a new manner to control the dispersity in conjugated polymers, while simultaneously determining the influence of this dispersity and the shape of the molar mass distribution on the aggregation behavior and chiral expression. Given the fact that the dispersity of conjugated polymers can vary significantly as a result of different polymerization techniques, we have identified the dispersity as an important but yet overlooked parameter for the properties of conjugated polymers.Author contributions
All authors have given approval to the final version of the manuscript. All authors significantly contributed to this research. A. Van Oosten and C. Verduyckt were the main contributors to the investigation, the methodology and the validation. A. Van Oosten conducted the visualisation and writing of the original draft. P. Gerbaux and J. De Winter were responsible for the formal analysis and investigation of the MALDI-ToF data. G. Koeckelberghs is responsible for conceptualization, funding acquisition, project administration and supervision. All authors contributed evenly to the review and editing of writing this manuscript.Conflicts of interest
There are no conflicts to declare.Acknowledgements
This research was funded by Onderzoeksfonds KU Leuven/Research Fund KU Leuven.Notes and references
- A. Van Oosten, K. Aerts, Y. de Coene, J. De Winter, P. Gerbaux, T. Verbiest and G. Koeckelberghs, submitted.
- Y. Guo, L. Wang, Y. Han, Y. Geng and Z. Su, Polym. Chem., 2014, 5, 1938–1944 RSC.
- S. V. Meille, V. Romita, T. Caronna, A. J. Lovinger, M. Catellani and L. Belobrzeckaja, Macromolecules, 1997, 30, 7898–7905 CrossRef CAS.
- T. J. Prosa, M. J. Winokur and R. D. McCullough, Macromolecules, 1996, 29, 3654–3656 CrossRef CAS.
- R. Noriega, J. Rivnay, K. Vandewal, F. P. V. Koch, N. Stingelin, P. Smith, M. F. Toney and A. Salleo, Nat. Mater., 2013, 12, 1038–1044 CrossRef CAS PubMed.
- N. A. Lynd, A. J. Meuler and M. A. Hillmyer, Prog. Polym. Sci., 2008, 33, 875–893 CrossRef CAS.
- N. A. Lynd and M. A. Hillmyer, Macromolecules, 2005, 38, 8803–8810 CrossRef CAS.
- T. M. Beardsley and M. W. Matsen, Eur. Phys. J. E: Soft Matter Biol. Phys., 2008, 27, 323–333 CrossRef CAS.
- D. T. Gentekos, J. Jia, E. S. Tirado, K. P. Barteau, D. M. Smilgies, R. A. Distasio and B. P. Fors, J. Am. Chem. Soc., 2018, 140, 4639–4648 CrossRef CAS PubMed.
- B. Oschmann, J. Lawrence, M. W. Schulze, J. M. Ren, A. Anastasaki, Y. Luo, M. D. Nothling, C. W. Pester, K. T. Delaney, L. A. Connal, A. J. McGrath, P. G. Clark, C. M. Bates and C. J. Hawker, ACS Macro Lett., 2017, 6, 668–673 CrossRef CAS PubMed.
- J. M. Widin, A. K. Schmitt, A. L. Schmitt, K. Im and M. K. Mahanthappa, J. Am. Chem. Soc., 2012, 134, 3834–3844 CrossRef CAS PubMed.
- J. Listak, W. Jakubowski, L. Mueller, A. Plichta, K. Matyjaszewski and M. R. Bockstaller, Macromolecules, 2008, 41, 5919–5927 CrossRef CAS.
- Y. Wang, H. Cui, M. Zhu, F. Qiu, J. Peng and Z. Lin, Macromolecules, 2017, 50, 9674–9682 CrossRef CAS.
- P. E. Keivanidis, J. I. Khan, L. Katzenmeier, Z. Kan, S. Limbu, M. Constantinou, E. Lariou, G. Constantinides, S. C. Hayes, J. S. Kim and F. Laquai, J. Phys. Chem. C, 2018, 122, 29141–29149 CrossRef CAS.
- K. S. Ahn, H. Jo, J. B. Kim, I. Seo, H. H. Lee and D. R. Lee, ACS Appl. Mater. Interfaces, 2020, 12, 1142–1150 CrossRef CAS PubMed.
- C. Poelking and D. Andrienko, Macromolecules, 2013, 46, 8941–8956 CrossRef CAS.
- Z. L. Gong, X. Zhu, Z. Zhou, S. W. Zhang, D. Yang, B. Zhao, Y. P. Zhang, J. Deng, Y. Cheng, Y. X. Zheng, S. Q. Zang, H. Kuang, P. Duan, M. Yuan, C. F. Chen, Y. S. Zhao, Y. W. Zhong, B. Z. Tang and M. Liu, Sci. China: Chem., 2021, 64, 2060–2104 CrossRef CAS.
- T. Kobayashi, K. Kinoshita, A. Niwa, T. Nagase and H. Naito, Nanoscale Res. Lett., 2017, 12, 268 CrossRef PubMed.
- B. Nowacki, H. Oh, C. Zanlorenzi, H. Jee, A. Baev, P. N. Prasad and L. Akcelrud, Macromolecules, 2013, 46, 7158–7165 CrossRef CAS.
- D. Nichetti and I. Manas-Zloczower, Polym. Eng. Sci., 1999, 39, 887–895 CrossRef CAS.
- M. Nadgorny, D. T. Gentekos, Z. Xiao, S. P. Singleton, B. P. Fors and L. A. Connal, Macromol. Rapid Commun., 2017, 38, 1–5 CrossRef PubMed.
- X. Ye and T. Sridhar, Macromolecules, 2005, 38, 3442–3449 CrossRef CAS.
- A. Smeets, P. Willot, J. De Winter, P. Gerbaux, T. Verbiest and G. Koeckelberghs, Macromolecules, 2011, 44, 6017–6025 CrossRef CAS.
- A. Smeets, K. Van Den Bergh, J. De Winter, P. Gerbaux, T. Verbiest and G. Koeckelberghs, Macromolecules, 2009, 42, 7638–7641 CrossRef CAS.
- T. Yokozawa, R. Suzuki, M. Nojima, Y. Ohta and A. Yokoyama, Macromol. Rapid Commun., 2011, 32, 801–806 CrossRef CAS PubMed.
- P. Willot, J. Steverlynck, D. Moerman, P. Leclère, R. Lazzaroni and G. Koeckelberghs, Polym. Chem., 2013, 4, 2662–2671 RSC.
- L. Verheyen, J. De Winter, P. Gerbaux and G. Koeckelberghs, Macromolecules, 2019, 52, 8587–8595 CrossRef CAS.
- K. Kosaka, T. Uchida, K. Mikami, Y. Ohta and T. Yokozawa, Macromolecules, 2018, 51, 364–369 CrossRef CAS.
- R. Whitfield, N. P. Truong, D. Messmer, K. Parkatzidis, M. Rolland and A. Anastasaki, Chem. Sci., 2019, 10, 8724–8734 RSC.
- N. Corrigan, A. Almasri, W. Taillades, J. Xu and C. Boyer, Macromolecules, 2017, 50, 8438–8448 CrossRef CAS.
- R. Whitfield, N. P. Truong and A. Anastasaki, Angew. Chem., Int. Ed., 2021, 60, 19383–19388 CrossRef CAS PubMed.
- R. Whitfield, K. Parkatzidis, M. Rolland, N. P. Truong and A. Anastasaki, Angew. Chem., Int. Ed., 2019, 58, 13323–13328 CrossRef CAS PubMed.
- M. Rolland, N. P. Truong, R. Whitfield and A. Anastasaki, ACS Macro Lett., 2020, 9, 459–463 CrossRef CAS PubMed.
- A. Plichta, M. Zhong, W. Li, A. M. Elsen and K. Matyjaszewski, Macromol. Chem. Phys., 2012, 213, 2659–2668 CrossRef CAS.
- Z. Wang, J. Yan, T. Liu, Q. Wei, S. Li, M. Olszewski, J. Wu, J. Sobieski, M. Fantin, M. R. Bockstaller and K. Matyjaszewski, ACS Macro Lett., 2019, 8, 859–864 CrossRef CAS PubMed.
- K. Parkatzidis, N. P. Truong, M. N. Antonopoulou, R. Whitfield, D. Konkolewicz and A. Anastasaki, Polym. Chem., 2020, 11, 4968–4972 RSC.
- S. I. Rosenbloom, R. J. Sifri and B. P. Fors, Polym. Chem., 2021, 12, 5910–5915 RSC.
- V. Yadav, N. Hashmi, W. Ding, T. H. Li, M. K. Mahanthappa, J. C. Conrad and M. L. Robertson, Polym. Chem., 2018, 9, 4332–4342 RSC.
- X. Liu, C. G. Wang and A. Goto, Angew. Chem., Int. Ed., 2019, 58, 5598–5603 CrossRef CAS PubMed.
- V. Kottisch, D. T. Gentekos and B. P. Fors, ACS Macro Lett., 2016, 5, 796–800 CrossRef CAS PubMed.
- D. T. Gentekos, L. N. Dupuis and B. P. Fors, J. Am. Chem. Soc., 2016, 138, 1848–1851 CrossRef CAS PubMed.
- S. Domanskyi, D. T. Gentekos, V. Privman and B. P. Fors, Polym. Chem., 2020, 11, 326–336 RSC.
- P. J. Brown, D. S. Thomas, A. Köhler, J. S. Wilson, J. S. Kim, C. M. Ramsdale, H. Sirringhaus and R. H. Friend, Phys. Rev. B: Condens. Matter Mater. Phys., 2003, 67, 1–16 CAS.
- E. R. Lermo, B. M. W. Langeveld-voss, R. A. J. Janssen and E. W. Meijer, Chem. Commun., 1999, 791–792 RSC.
- B. M. W. Langeveld-Voss, D. Beljonne, Z. Shuai, R. A. J. Janssen, S. C. J. Meskers, E. W. Meijer and J. L. Brédas, Adv. Mater., 1998, 10, 1343–1348 CrossRef CAS.
- T. Yokozawa and A. Yokoyama, Polym. J., 2004, 36, 65–83 CrossRef CAS.
- A. Yokoyama, R. Miyakoshi and T. Yokozawa, Macromolecules, 2004, 37, 1169–1171 CrossRef CAS.
- M. C. Iovu, E. E. Sheina, R. R. Gil and R. D. McCullough, Macromolecules, 2005, 38, 8649–8656 CrossRef CAS.
- M. P. Van Den Eede, A. Bedi, J. Delabie, J. De Winter, P. Gerbaux and G. Koeckelberghs, Polym. Chem., 2017, 8, 5666–5672 RSC.
- E. L. Lanni and A. J. McNeil, Macromolecules, 2010, 43, 8039–8044 CrossRef CAS.
- R. Miyakoshi, A. Yokoyama and T. Yokozawa, J. Am. Chem. Soc., 2005, 127, 17542–17547 CrossRef CAS PubMed.
- E. L. Lanni and A. J. McNeil, J. Am. Chem. Soc., 2009, 131, 16573–16579 CrossRef CAS PubMed.
- A. R. A. Palmans and E. W. Meijer, Angew. Chem., Int. Ed., 2007, 46, 8948–8968 CrossRef CAS PubMed.
- K. Wang and Y. Xiao, Chirality, 2021, 33, 424–446 CrossRef CAS PubMed.
- T. Yamamoto, Macromol. Rapid Commun., 2002, 23, 583–606 CrossRef CAS.
- T. Yamamoto, Bull. Chem. Soc. Jpn., 2010, 83, 431–455 CrossRef CAS.
- Z.-B. Zhang, M. Fujiki, M. Motonaga, H. Nakashima, K. Torimatsu and H.-Z. Tang, Macromolecules, 2002, 35, 941–944 CrossRef CAS.
- Y. Qu, Q. Su, S. Li, G. Lu, X. Zhou, J. Zhang, Z. Chen and X. Yang, ACS Macro Lett., 2012, 1, 1274–1278 CrossRef CAS PubMed.
- J. Liu, M. Arif, J. Zou, S. I. Khondaker and L. Zhai, Macromolecules, 2009, 42, 9390–9393 CrossRef CAS.
- M. Brinkmann and P. Rannou, Macromolecules, 2009, 42, 1125–1130 CrossRef CAS.
Footnote |
| † Electronic supplementary information (ESI) available. See DOI: https://doi.org/10.1039/d3sm00163f |
| This journal is © The Royal Society of Chemistry 2023 |

